Data Center Infrastructure Management Market Outlook (2023 to 2033)

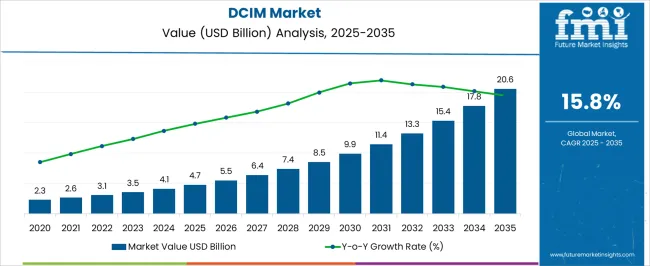
The global DCIM market size is anticipated to gain astonishing growth from 2023 to 2033. According to the research report published by Future Market Insights, the global market is predicted to exceed a valuation of US$ 3,540.4 million in 2023. It is anticipated to hit a valuation of US$ 15,295.3 million by 2033. The market is estimated to showcase a splendid CAGR of 15.8% from 2023 to 2033.

Gaining end-to-end visibility for predicting capacity requirements is an utmost priority for several businesses. The necessity to integrate monitoring systems with disparate applications and databases for better data accuracy is rising. The emergence of next-generation DCIM offerings is boosting the market’s growth potential.

The mandate of the data center optimization initiative to address critical infrastructure inefficiencies is creating growth opportunities. The demand for DCIM-integrated monitoring systems with disparate applications and databases for better data accuracy is bolstering. These drivers are strongly influencing the market sales of DCIM and their adoption rate.

IT management is essential because of how the equipment is crammed into the data center space. These factors indicate the pressing need, which underlies the robust regional DCIM sales. The market's growth is likely to be aided by rising demand for DCIM in the cloud and data traffic traveling from and within data centers.

According to Cisco Systems, IP traffic in cloud data centers is expected to increase to 19,509 exabytes by 2023. Market vendors are focussing on increasing their product portfolios by emphasizing sales of DCIM. They are focusing on higher power consumption capacity and reduced space needs. For instance, to meet specific customer requirements, nVent Schroff GmbH introduced its Power Distribution Unit (PDU) platform. SCHROFF RackPower Intelligent is utilized for networking and data center infrastructure. It features easy customization and configuration with no minimum quantity requirements.

Snowballing demand for cloud computing, big data, and artificial intelligence aids market expansion significantly. These technologies can help providers to scale their businesses based on demand. Automated tasks help in reducing the workload and improve efficiency. Real-time information gathering helps in streamlining overall operations.

Attributes Details
DCIM Market Share (2022) US$ 3,100.2 million
DCIM Market Share (2023) US$ 3,540.4 million
DCIM Market Share (2033) US$ 15,295.3 million
DCIM Market Share (2023 to 2033) 15.8%

Don't pay for what you don't need

Customize your report by selecting specific countries or regions and save 30%!

DCIM Market Historical Analysis (2018 to 2022) Vs. Forecast Outlook (2023 to 2033)

The global data center infrastructure management market expanded at a captivating CAGR of 13.7% from 2018 to 2022. In 2018, the global market size stood at US$ 1,851.8 million. In the following years, the market gained significant traction, accounting for US$ 3,100.2 million.

In recent years, digitalization and internet reach have astronomically increased. Businesses are rapidly dispersing computer resources across many settings. Such as cloud servers, edge data centers, and physical systems.

According to the 2018 Voice of the Enterprise: Datacenter Transformation, Budgets, and Outlook study, 57% of respondents said they use cloud service providers. Nearly 54% said they own and run their data centers. Around 41% said they rent space from colocation data center operators.

The adoption of the hybrid strategy for demand for DCIM agility and 24x7 connection has resulted in a surge in the utilization of Software as a Service (SaaS) solutions. Because more equipment is squeezed into the data center area, IT management is critical. These factors point to the demanding necessity, hence strong sales of DCIM are predicted.

As the market develops, data center operators' need for end-to-end visibility across infrastructure increases. However, the data center industry is going through a significant shift due to the introduction of supplementary and new technologies. Data centers, IT, and facility operators are gradually implementing tools like DCIM. To gain comprehensive visibility into key data centers infrastructure information, such as operations, configuration, and resource consumption.

Category-wise Insights

Which Factors Bolster Expansion of Facility Management Segment in the Market?

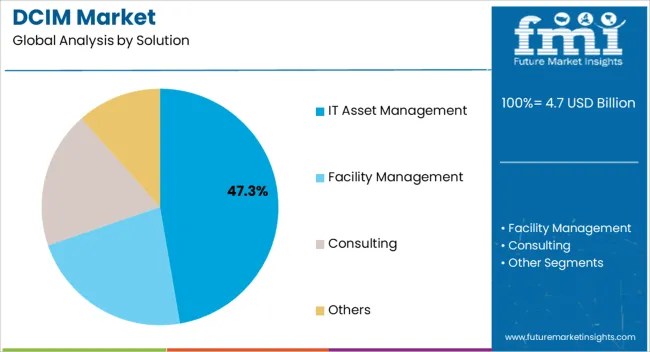
By solutions, the facility management segment is anticipated to garner swift growth in the coming years. The segment captured a market share of 40.3% in 2022. Facility management is integral in ensuring that data centers run efficiently. They can help in the identification of areas to save energy and cut costs. The increasing energy costs impel data center operators to increase energy efficiency. As data centers become more complex, facility management’s demand is bound to augment.

The IT asset management segment is anticipated to witness substantial growth. The increasing adoption of cloud computing is boosting the need to manage mushroom IT assets. Due to the growing numbers of IT assets in different locations, IT asset management becomes more critical. To ensure proper compliance, security, and utilization of resources, demand for IT asset management in the market is likely to escalate. Racks, Hyperview, Sunbird Software, and Nlyte Software, are a few of the DCIM market companies with notable IT asset management features.

Which is the Booming Segment in the Market by Industry Vertical?

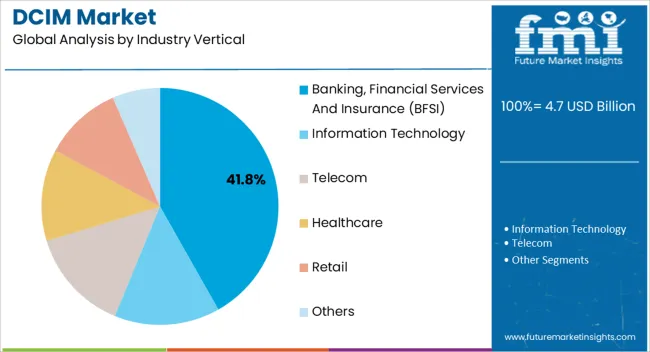
The Banking, Financial Services, and Insurance (BFSI) industry vertical captured 21.2% of the global market share in 2022. For the BFSI vertical, data centers enable business continuity by concentrating on concerns such as manageability, scalability, efficiency, and energy efficiency. These concerns may not be addressed until data centers are properly monitored. The growing demand for digital banking services impels the NFSI industry to manage large amounts of data and IT infrastructure. The increasing data traffic in the BFSI sector is likely to bolster the segment’s expansion.

Cloud services are being adopted by the Information Technology (IT) sector. Cloud services assist reduce operating expenses and provide high business continuity. The use of cloud services in the IT sector necessitates data centers that can store and analyze data in real-time. Sales of DCIM in this area provide significant computational power and minimize time to market. Data centers also provide services in the form of overlays or Virtual Local Area Networks (VLANs), such as virtual machine disc libraries, file or object storage, firewalls, load balancers, IP addresses, or network connections.
Sudip Saha
Sudip Saha

Principal Consultant

Talk to Analyst

Find your sweet spots for generating winning opportunities in this market.

Country-wise Insights

North America to Benefit from Early Technology Adoption

The North America DCIM market exhibited a CAGR of 28.4% in 2022. The data center market in the Western region of the United States is established and developed. The area has excellent connectivity and is adjacent to IT centers, making it a smart investment for data center operators.

California comprises nearly 90% of digital businesses, including cloud service providers and other IT and technology firms. The demand for additional data center infrastructures is being driven by the increasing use of mobile broadband, cloud computing, and big data analytics. Additionally, the growing popularity of cloud computing among organizations in North America is escalating. The falling server prices are anticipated to uptick demand for DCIM throughout the forecast period.

Heft Investments to Bolster Market Growth in Asia Pacific

Asia Pacific is a swiftly developing region in the DCIM market, with significant data center development investments. Huge investments in verticals such as BFSI, retail, healthcare, manufacturing, telecommunications, and IT are being made in key nations such as India, China, and Japan. Resulting in the development and economic expansion in Asia Pacific countries.

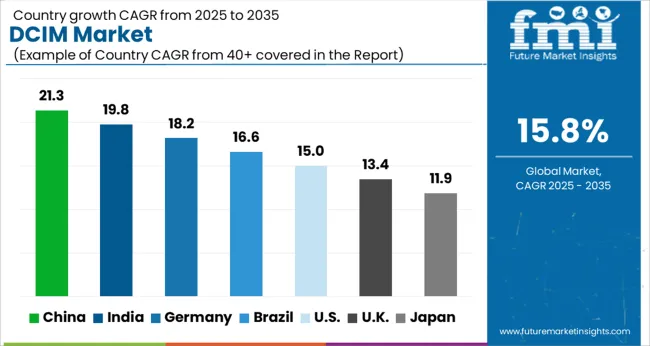
China garnered a 15.4% market share in 2022. The demand for DCIM in this region continues to rise with the increase in internet-enabled gadgets grows. This surge in development has spurred data center building in the area, which is likely to drive sales of DCIM solutions and service adoption.

India captured a 14.6% market share in 2022. As part of a green effort, governments around the area are proposing new energy efficiency rules. These include carbon emission taxes, efficient power consumption, and other measures. The demand for DCIM software to manage data centers is necessitated by such regulatory constraints.

Key Players Sought Strategic Alliance and New Launches to Garner Growth

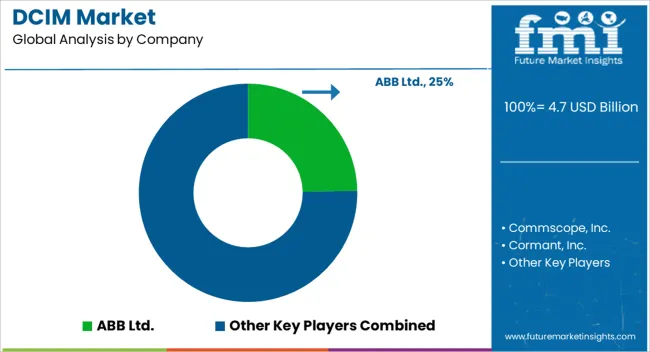
Owing to certain sizable competitors, such as IBM, Siemens, and Schneider Electric, which are present in the DCIM market, there is fierce competition. They have gained a competitive advantage over other players due to their capacity to constantly develop their services. They've been able to gain a firmer footing in the market through strategic alliances, research and development, and mergers and acquisitions.

The key players are concentrating on releasing products and services that, depending on numerous factors, align with shifting business dynamics. The key players may work together by forming strategic alliances to enter new markets.

Recent Developments in the DCIM Market:
  • In February 2023, Schneider Electric released a new whitepaper and tradeoff tool addressing ‘how DCIM addresses hybrid IT management challenges.’
  • In June 2022, Schneider Electric debuted its data center infrastructure management (DCIM) product called Ecostruxure IT. The new launch enables CIOs to manage infrastructure distributed across public cloud services, edge resources, colocation, and on-premises resources.
  • Siemens unveiled the open Industrial Edge ecosystem breakthrough IT platform in November 2021. This facilitates and supports scalable IT technology and application deployment in the production environment. This also allows B2B clients to buy and manage different software components from a single platform.
  • Sunbird Software released a new version of the dcTrack solution in October 2021. Previously, enterprise-class clients struggled to administer all of their data centers, labs, units, and edge locations remotely. Due to the slowness of the first-generation DCIM. To overcome these challenges, dcTrack has improved its scalability and tool management capabilities.

Get the data you need at a Fraction of the cost

Personalize your report by choosing insights you need
and save 40%!

Key Players in the Market

  • ABB Ltd.
  • Commscope Inc.
  • Cormant Inc.
  • Eaton Corp Inc.
  • IBM Corp.

Report Scope

Attribute Details
Forecast Period 2023 to 2033
Historical Data Available for 2018 to 2022
Market Analysis US$ million for Value
Key Regions Covered North America, Latin America, Europe, East Asia, South Asia, Oceania & The Middle East and Africa
Key Countries Covered United States, Canada, Brazil, Mexico, Germany, United Kingdom, France, Spain, Italy, Russia, Benelux, South Africa, Northern Africa GCC Countries, China, Japan, South Korea, India, Thailand, Malaysia, Indonesia, Australia & New Zealand.
Key Segments Covered The solution, Component, Industry Vertical, and Region.
Report Coverage Market Forecast, Company Share Analysis, Competition Intelligence, Trend Analysis, Market Dynamics and Challenges, and Strategic Growth Initiatives

Market Segmentation

By Solution:

  • IT Asset Management
  • Facility Management
  • Consulting
  • Others

By Component:

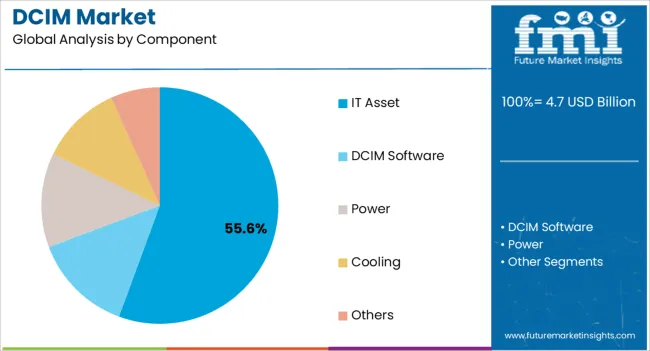
  • IT Asset
  • DCIM Software
  • Power
  • Cooling
  • Others

By Industry Vertical:

  • Banking, Financial Services and Insurance (BFSI)
  • Information Technology
  • Telecom
  • Healthcare
  • Retail
  • Others

By Region:

  • North America
  • Latin America
  • Europe
  • Asia Pacific
  • The Middle East and Africa

Frequently Asked Questions

Which are the Key Asian Countries in the DCIM Market?

The key Asian countries in the market are China, India, and Japan.

Which Industry is the Key Consumer of Data Center Infrastructure Management Market?

The IT and telecoms industries are the primary DCIM consumers.

How much can the DCIM Market Grow by 2033 in the United States?

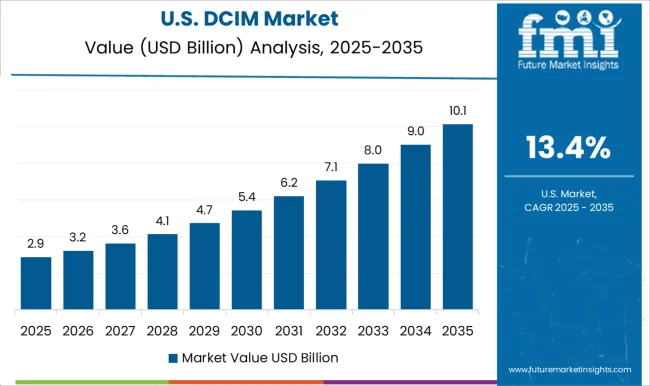
The United States is anticipated to register a CAGR of 10% from 2023 to 2033.

What is Current Market Valuation of Data Center Infrastructure Management Market?

In 2023, the global DCIM market was estimated to be worth US$ 3,540.3 million.

How Big will be the Data Center Infrastructure Management Market by 2033?

The global DCIM market is expected to reach US$ 15.295.3 billion by 2033.

Table of Content
1. Executive Summary | DCIM Market
    1.1. Global Market Outlook
    1.2. Demand-side Trends
    1.3. Supply-side Trends
    1.4. Technology Roadmap Analysis
    1.5. Analysis and Recommendations
2. Market Overview
    2.1. Market Coverage / Taxonomy
    2.2. Market Definition / Scope / Limitations
3. Market Background
    3.1. Market Dynamics
        3.1.1. Drivers
        3.1.2. Restraints
        3.1.3. Opportunity
        3.1.4. Trends
    3.2. Scenario Forecast
        3.2.1. Demand in Optimistic Scenario
        3.2.2. Demand in Likely Scenario
        3.2.3. Demand in Conservative Scenario
    3.3. Opportunity Map Analysis
    3.4. Investment Feasibility Matrix
    3.5. PESTLE and Porter’s Analysis
    3.6. Regulatory Landscape
        3.6.1. By Key Regions
        3.6.2. By Key Countries
    3.7. Regional Parent Market Outlook
4. Global Market Analysis 2018 to 2022 and Forecast, 2023 to 2033
    4.1. Historical Market Size Value (US$ Million) Analysis, 2018 to 2022
    4.2. Current and Future Market Size Value (US$ Million) Projections, 2023 to 2033
        4.2.1. Y-o-Y Growth Trend Analysis
        4.2.2. Absolute $ Opportunity Analysis
5. Global Market Analysis 2018 to 2022 and Forecast 2023 to 2033, By Component
    5.1. Introduction / Key Findings
    5.2. Historical Market Size Value (US$ Million) Analysis By Component, 2018 to 2022
    5.3. Current and Future Market Size Value (US$ Million) Analysis and Forecast By Component, 2023 to 2033
        5.3.1. Solution
            5.3.1.1. Asset Management
            5.3.1.2. Network Management
            5.3.1.3. Cooling Management
            5.3.1.4. Power Management
            5.3.1.5. Security Management
        5.3.2. Service
            5.3.2.1. Installation & Integration
            5.3.2.2. Managed
            5.3.2.3. Consulting
    5.4. Y-o-Y Growth Trend Analysis By Component, 2018 to 2022
    5.5. Absolute $ Opportunity Analysis By Component, 2023 to 2033
6. Global Market Analysis 2018 to 2022 and Forecast 2023 to 2033, By Deployment Model
    6.1. Introduction / Key Findings
    6.2. Historical Market Size Value (US$ Million) Analysis By Deployment Model, 2018 to 2022
    6.3. Current and Future Market Size Value (US$ Million) Analysis and Forecast By Deployment Model, 2023 to 2033
        6.3.1. On-Premises
        6.3.2. Cloud
    6.4. Y-o-Y Growth Trend Analysis By Deployment Model, 2018 to 2022
    6.5. Absolute $ Opportunity Analysis By Deployment Model, 2023 to 2033
7. Global Market Analysis 2018 to 2022 and Forecast 2023 to 2033, By Industry Vertical
    7.1. Introduction / Key Findings
    7.2. Historical Market Size Value (US$ Million) Analysis By Industry Vertical, 2018 to 2022
    7.3. Current and Future Market Size Value (US$ Million) Analysis and Forecast By Industry Vertical, 2023 to 2033
        7.3.1. Banking, Financial Services and Insurance
        7.3.2. Government and Public Sector
        7.3.3. Healthcare and Life Sciences
        7.3.4. IT and ITeS
        7.3.5. Manufacturing
        7.3.6. Telecommunications
        7.3.7. Others
    7.4. Y-o-Y Growth Trend Analysis By Industry Vertical, 2018 to 2022
    7.5. Absolute $ Opportunity Analysis By Industry Vertical, 2023 to 2033
8. Global Market Analysis 2018 to 2022 and Forecast 2023 to 2033, By Region
    8.1. Introduction
    8.2. Historical Market Size Value (US$ Million) Analysis By Region, 2018 to 2022
    8.3. Current Market Size Value (US$ Million) Analysis and Forecast By Region, 2023 to 2033
        8.3.1. North America
        8.3.2. Latin America
        8.3.3. Europe
        8.3.4. South Asia
        8.3.5. East Asia
        8.3.6. Oceania
        8.3.7. MEA
    8.4. Market Attractiveness Analysis By Region
9. North America Market Analysis 2018 to 2022 and Forecast 2023 to 2033, By Country
    9.1. Historical Market Size Value (US$ Million) Trend Analysis By Market Taxonomy, 2018 to 2022
    9.2. Market Size Value (US$ Million) Forecast By Market Taxonomy, 2023 to 2033
        9.2.1. By Country
            9.2.1.1. USA
            9.2.1.2. Canada
        9.2.2. By Component
        9.2.3. By Deployment Model
        9.2.4. By Industry Vertical
    9.3. Market Attractiveness Analysis
        9.3.1. By Country
        9.3.2. By Component
        9.3.3. By Deployment Model
        9.3.4. By Industry Vertical
    9.4. Key Takeaways
10. Latin America Market Analysis 2018 to 2022 and Forecast 2023 to 2033, By Country
    10.1. Historical Market Size Value (US$ Million) Trend Analysis By Market Taxonomy, 2018 to 2022
    10.2. Market Size Value (US$ Million) Forecast By Market Taxonomy, 2023 to 2033
        10.2.1. By Country
            10.2.1.1. Brazil
            10.2.1.2. Mexico
            10.2.1.3. Rest of Latin America
        10.2.2. By Component
        10.2.3. By Deployment Model
        10.2.4. By Industry Vertical
    10.3. Market Attractiveness Analysis
        10.3.1. By Country
        10.3.2. By Component
        10.3.3. By Deployment Model
        10.3.4. By Industry Vertical
    10.4. Key Takeaways
11. Europe Market Analysis 2018 to 2022 and Forecast 2023 to 2033, By Country
    11.1. Historical Market Size Value (US$ Million) Trend Analysis By Market Taxonomy, 2018 to 2022
    11.2. Market Size Value (US$ Million) Forecast By Market Taxonomy, 2023 to 2033
        11.2.1. By Country
            11.2.1.1. Germany
            11.2.1.2. United Kingdom
            11.2.1.3. France
            11.2.1.4. Spain
            11.2.1.5. Italy
            11.2.1.6. Rest of Europe
        11.2.2. By Component
        11.2.3. By Deployment Model
        11.2.4. By Industry Vertical
    11.3. Market Attractiveness Analysis
        11.3.1. By Country
        11.3.2. By Component
        11.3.3. By Deployment Model
        11.3.4. By Industry Vertical
    11.4. Key Takeaways
12. South Asia Market Analysis 2018 to 2022 and Forecast 2023 to 2033, By Country
    12.1. Historical Market Size Value (US$ Million) Trend Analysis By Market Taxonomy, 2018 to 2022
    12.2. Market Size Value (US$ Million) Forecast By Market Taxonomy, 2023 to 2033
        12.2.1. By Country
            12.2.1.1. India
            12.2.1.2. Malaysia
            12.2.1.3. Singapore
            12.2.1.4. Thailand
            12.2.1.5. Rest of South Asia
        12.2.2. By Component
        12.2.3. By Deployment Model
        12.2.4. By Industry Vertical
    12.3. Market Attractiveness Analysis
        12.3.1. By Country
        12.3.2. By Component
        12.3.3. By Deployment Model
        12.3.4. By Industry Vertical
    12.4. Key Takeaways
13. East Asia Market Analysis 2018 to 2022 and Forecast 2023 to 2033, By Country
    13.1. Historical Market Size Value (US$ Million) Trend Analysis By Market Taxonomy, 2018 to 2022
    13.2. Market Size Value (US$ Million) Forecast By Market Taxonomy, 2023 to 2033
        13.2.1. By Country
            13.2.1.1. China
            13.2.1.2. Japan
            13.2.1.3. South Korea
        13.2.2. By Component
        13.2.3. By Deployment Model
        13.2.4. By Industry Vertical
    13.3. Market Attractiveness Analysis
        13.3.1. By Country
        13.3.2. By Component
        13.3.3. By Deployment Model
        13.3.4. By Industry Vertical
    13.4. Key Takeaways
14. Oceania Market Analysis 2018 to 2022 and Forecast 2023 to 2033, By Country
    14.1. Historical Market Size Value (US$ Million) Trend Analysis By Market Taxonomy, 2018 to 2022
    14.2. Market Size Value (US$ Million) Forecast By Market Taxonomy, 2023 to 2033
        14.2.1. By Country
            14.2.1.1. Australia
            14.2.1.2. New Zealand
        14.2.2. By Component
        14.2.3. By Deployment Model
        14.2.4. By Industry Vertical
    14.3. Market Attractiveness Analysis
        14.3.1. By Country
        14.3.2. By Component
        14.3.3. By Deployment Model
        14.3.4. By Industry Vertical
    14.4. Key Takeaways
15. MEA Market Analysis 2018 to 2022 and Forecast 2023 to 2033, By Country
    15.1. Historical Market Size Value (US$ Million) Trend Analysis By Market Taxonomy, 2018 to 2022
    15.2. Market Size Value (US$ Million) Forecast By Market Taxonomy, 2023 to 2033
        15.2.1. By Country
            15.2.1.1. GCC Countries
            15.2.1.2. South Africa
            15.2.1.3. Israel
            15.2.1.4. Rest of MEA
        15.2.2. By Component
        15.2.3. By Deployment Model
        15.2.4. By Industry Vertical
    15.3. Market Attractiveness Analysis
        15.3.1. By Country
        15.3.2. By Component
        15.3.3. By Deployment Model
        15.3.4. By Industry Vertical
    15.4. Key Takeaways
16. Key Countries Market Analysis
    16.1. USA
        16.1.1. Pricing Analysis
        16.1.2. Market Share Analysis, 2022
            16.1.2.1. By Component
            16.1.2.2. By Deployment Model
            16.1.2.3. By Industry Vertical
    16.2. Canada
        16.2.1. Pricing Analysis
        16.2.2. Market Share Analysis, 2022
            16.2.2.1. By Component
            16.2.2.2. By Deployment Model
            16.2.2.3. By Industry Vertical
    16.3. Brazil
        16.3.1. Pricing Analysis
        16.3.2. Market Share Analysis, 2022
            16.3.2.1. By Component
            16.3.2.2. By Deployment Model
            16.3.2.3. By Industry Vertical
    16.4. Mexico
        16.4.1. Pricing Analysis
        16.4.2. Market Share Analysis, 2022
            16.4.2.1. By Component
            16.4.2.2. By Deployment Model
            16.4.2.3. By Industry Vertical
    16.5. Germany
        16.5.1. Pricing Analysis
        16.5.2. Market Share Analysis, 2022
            16.5.2.1. By Component
            16.5.2.2. By Deployment Model
            16.5.2.3. By Industry Vertical
    16.6. United Kingdom
        16.6.1. Pricing Analysis
        16.6.2. Market Share Analysis, 2022
            16.6.2.1. By Component
            16.6.2.2. By Deployment Model
            16.6.2.3. By Industry Vertical
    16.7. France
        16.7.1. Pricing Analysis
        16.7.2. Market Share Analysis, 2022
            16.7.2.1. By Component
            16.7.2.2. By Deployment Model
            16.7.2.3. By Industry Vertical
    16.8. Spain
        16.8.1. Pricing Analysis
        16.8.2. Market Share Analysis, 2022
            16.8.2.1. By Component
            16.8.2.2. By Deployment Model
            16.8.2.3. By Industry Vertical
    16.9. Italy
        16.9.1. Pricing Analysis
        16.9.2. Market Share Analysis, 2022
            16.9.2.1. By Component
            16.9.2.2. By Deployment Model
            16.9.2.3. By Industry Vertical
    16.10. India
        16.10.1. Pricing Analysis
        16.10.2. Market Share Analysis, 2022
            16.10.2.1. By Component
            16.10.2.2. By Deployment Model
            16.10.2.3. By Industry Vertical
    16.11. Malaysia
        16.11.1. Pricing Analysis
        16.11.2. Market Share Analysis, 2022
            16.11.2.1. By Component
            16.11.2.2. By Deployment Model
            16.11.2.3. By Industry Vertical
    16.12. Singapore
        16.12.1. Pricing Analysis
        16.12.2. Market Share Analysis, 2022
            16.12.2.1. By Component
            16.12.2.2. By Deployment Model
            16.12.2.3. By Industry Vertical
    16.13. Thailand
        16.13.1. Pricing Analysis
        16.13.2. Market Share Analysis, 2022
            16.13.2.1. By Component
            16.13.2.2. By Deployment Model
            16.13.2.3. By Industry Vertical
    16.14. China
        16.14.1. Pricing Analysis
        16.14.2. Market Share Analysis, 2022
            16.14.2.1. By Component
            16.14.2.2. By Deployment Model
            16.14.2.3. By Industry Vertical
    16.15. Japan
        16.15.1. Pricing Analysis
        16.15.2. Market Share Analysis, 2022
            16.15.2.1. By Component
            16.15.2.2. By Deployment Model
            16.15.2.3. By Industry Vertical
    16.16. South Korea
        16.16.1. Pricing Analysis
        16.16.2. Market Share Analysis, 2022
            16.16.2.1. By Component
            16.16.2.2. By Deployment Model
            16.16.2.3. By Industry Vertical
    16.17. Australia
        16.17.1. Pricing Analysis
        16.17.2. Market Share Analysis, 2022
            16.17.2.1. By Component
            16.17.2.2. By Deployment Model
            16.17.2.3. By Industry Vertical
    16.18. New Zealand
        16.18.1. Pricing Analysis
        16.18.2. Market Share Analysis, 2022
            16.18.2.1. By Component
            16.18.2.2. By Deployment Model
            16.18.2.3. By Industry Vertical
    16.19. GCC Countries
        16.19.1. Pricing Analysis
        16.19.2. Market Share Analysis, 2022
            16.19.2.1. By Component
            16.19.2.2. By Deployment Model
            16.19.2.3. By Industry Vertical
    16.20. South Africa
        16.20.1. Pricing Analysis
        16.20.2. Market Share Analysis, 2022
            16.20.2.1. By Component
            16.20.2.2. By Deployment Model
            16.20.2.3. By Industry Vertical
    16.21. Israel
        16.21.1. Pricing Analysis
        16.21.2. Market Share Analysis, 2022
            16.21.2.1. By Component
            16.21.2.2. By Deployment Model
            16.21.2.3. By Industry Vertical
17. Market Structure Analysis
    17.1. Competition Dashboard
    17.2. Competition Benchmarking
    17.3. Market Share Analysis of Top Players
        17.3.1. By Regional
        17.3.2. By Component
        17.3.3. By Deployment Model
        17.3.4. By Industry Vertical
18. Competition Analysis
    18.1. Competition Deep Dive
        18.1.1. ABB Ltd.
            18.1.1.1. Overview
            18.1.1.2. Product Portfolio
            18.1.1.3. Profitability by Market Segments
            18.1.1.4. Sales Footprint
            18.1.1.5. Strategy Overview
                18.1.1.5.1. Marketing Strategy
        18.1.2. Commscope, Inc.
            18.1.2.1. Overview
            18.1.2.2. Product Portfolio
            18.1.2.3. Profitability by Market Segments
            18.1.2.4. Sales Footprint
            18.1.2.5. Strategy Overview
                18.1.2.5.1. Marketing Strategy
        18.1.3. Cormant, Inc.
            18.1.3.1. Overview
            18.1.3.2. Product Portfolio
            18.1.3.3. Profitability by Market Segments
            18.1.3.4. Sales Footprint
            18.1.3.5. Strategy Overview
                18.1.3.5.1. Marketing Strategy
        18.1.4. Eaton Corporation
            18.1.4.1. Overview
            18.1.4.2. Product Portfolio
            18.1.4.3. Profitability by Market Segments
            18.1.4.4. Sales Footprint
            18.1.4.5. Strategy Overview
                18.1.4.5.1. Marketing Strategy
        18.1.5. IBM Corporation
            18.1.5.1. Overview
            18.1.5.2. Product Portfolio
            18.1.5.3. Profitability by Market Segments
            18.1.5.4. Sales Footprint
            18.1.5.5. Strategy Overview
                18.1.5.5.1. Marketing Strategy
        18.1.6. Delta Electronic Inc.
            18.1.6.1. Overview
            18.1.6.2. Product Portfolio
            18.1.6.3. Profitability by Market Segments
            18.1.6.4. Sales Footprint
            18.1.6.5. Strategy Overview
                18.1.6.5.1. Marketing Strategy
        18.1.7. Cisco Systems Inc.
            18.1.7.1. Overview
            18.1.7.2. Product Portfolio
            18.1.7.3. Profitability by Market Segments
            18.1.7.4. Sales Footprint
            18.1.7.5. Strategy Overview
                18.1.7.5.1. Marketing Strategy
        18.1.8. Infosys Limited
            18.1.8.1. Overview
            18.1.8.2. Product Portfolio
            18.1.8.3. Profitability by Market Segments
            18.1.8.4. Sales Footprint
            18.1.8.5. Strategy Overview
                18.1.8.5.1. Marketing Strategy
        18.1.9. NTT Data Corporation
            18.1.9.1. Overview
            18.1.9.2. Product Portfolio
            18.1.9.3. Profitability by Market Segments
            18.1.9.4. Sales Footprint
            18.1.9.5. Strategy Overview
                18.1.9.5.1. Marketing Strategy
        18.1.10. Modius Inc.
            18.1.10.1. Overview
            18.1.10.2. Product Portfolio
            18.1.10.3. Profitability by Market Segments
            18.1.10.4. Sales Footprint
            18.1.10.5. Strategy Overview
                18.1.10.5.1. Marketing Strategy
19. Assumptions & Acronyms Used
20. Research Methodology

Explore Technology Insights

View Reports
Future Market Insights

DCIM Market

Schedule a Call