Dosimetry Market Size and Share Forecast Outlook 2025 to 2035

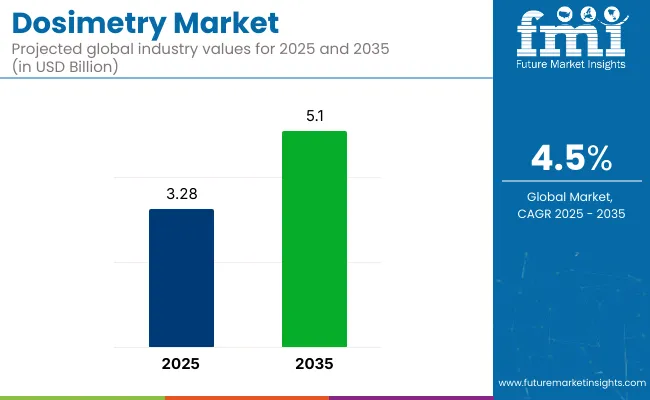
The dosimetry market is valued at USD 3.28 billion in 2025 and is slated to exhibit USD 5.1 billion by 2035, which shows a CAGR of 4.5%. This growth is primarily driven by the increasing demand for dosimetry solutions in radiation therapy, especially due to the rising prevalence of cancer and other diseases that require radiation treatment.
Accurate dosimetry ensures precise delivery of radiation doses, improving treatment outcomes and minimizing side effects. Additionally, dosimetry tools are critical in diagnostic imaging and radiology, helping to measure radiation exposure and ensuring patient safety during medical procedures. The growing focus on radiation safety in industries like nuclear energy is also contributing to the market's growth.

Attributes Key Insights
Dosimetry Market Size (2025) USD 3.28 billion
Market Valuation (2035) USD 5.1 billion
Value-based CAGR (2025 to 2035) 4.5%

Looking ahead, the dosimetry market is likely to continue its upward trajectory, driven by technological advancements. The shift from traditional analog dosimetry systems to digital systems, which offer greater precision and efficiency, is expected to accelerate market growth. Digital systems provide more accurate data, enhancing radiation therapy planning and improving safety protocols.

Moreover, the integration of artificial intelligence (AI) and machine learning (ML) in dosimetry systems is expected to enhance the personalization of radiation therapies, improving treatment outcomes. The increasing adoption of wearable dosimeters, capable of monitoring real-time radiation exposure in medical professionals and workers in radiation-heavy industries, is likely to drive further market expansion. As the need for real-time monitoring increases, wearable solutions will become more critical for ensuring safety.

Government regulations will play a vital role in shaping the dosimetry market’s future. Regulatory bodies like the USA Food and Drug Administration (FDA) and the International Atomic Energy Agency (IAEA) enforce strict guidelines to ensure the safety and reliability of dosimetry systems. These regulations push manufacturers to innovate and meet high standards, fueling demand for advanced dosimetry technologies. As regulatory requirements evolve, the need for precise, reliable dosimetry systems will continue to drive market growth.

Analyzing Dosimetry Market by Top Investment Segments

The market is segmented based on product type, modality, energy, end user, and region. By product type, the market is divided into personal electronic dosimeter, self-reading dosimeters, and processed dosimeters. In terms of modality, it is segmented into wearable and non-wearable. Based on energy, the market is categorized into active dosimeters and passive dosimeters.

By end user, the market is segmented into industrial, medical, oil and gas, defence and homeland security, mining, environmental, and others (nuclear power plants, research laboratories, aerospace, and food industry). Regionally, the market is classified into North America, Latin America, Western Europe, Eastern Europe, South Asia and Pacific, East Asia, and Middle East and Africa.

By Product Type, Personal Electronic Dosimeters Dominate Due to Real-Time Monitoring Advantage

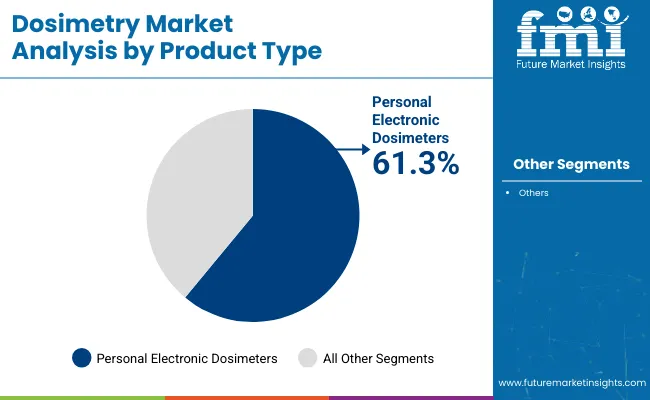
The personal electronic dosimeters segment is anticipated to maintain leadership in 2025, accounting for 61.3% market share, a slight increase over 2024’s 60.8% share. The surge stems from the expanding demand for accurate and real-time radiation exposure tracking, particularly across healthcare, nuclear, and defense sectors. These dosimeters offer instant feedback and advanced data storage, ensuring worker safety in radiation-prone environments.
The product’s lightweight, durable design and compatibility with software-based analytics tools have led to widespread adoption in nuclear plants, hospitals, and research laboratories. Innovations by companies such as Mirion Technologies and Thermo Fisher Scientific, including Bluetooth connectivity and cloud data integration, are expanding product scope. Furthermore, tightening occupational safety regulations worldwide are propelling the segment’s usage across industrial and environmental sectors.

Product Type Segment Market Share (2025)
Personal Electronic Dosimeters 61.3%

By Modality, Wearable Dosimeters Continue to Command Market Leadership

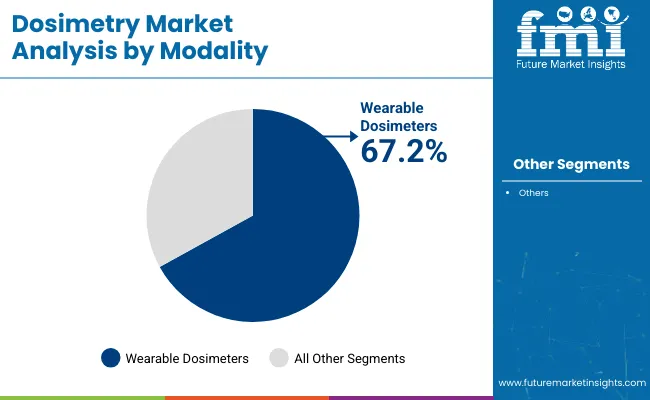
The wearable dosimeters segment is forecast to capture a 67.2% market share in 2025, up slightly from 66.8% in 2024, sustaining its leadership in the modality category. These dosimeters’ ability to provide continuous radiation monitoring without impeding user movement is key to their dominance. Widely used in healthcare, nuclear facilities, and defense, wearable dosimeters have seen increasing acceptance due to their ergonomic design, ease of use, and adaptability to varying operational environments.
Manufacturers like LANDAUER and Polimaster are integrating features such as real-time alarms, wireless data transmission, and waterproof casings, further solidifying market preference. The proliferation of radiological emergency preparedness protocols in homeland security and environmental monitoring also accelerates this segment's demand. The shift towards wearable solutions highlights the market's direction towards safety, convenience, and data-driven radiation management systems.

Modality Segment Market Share (2025)
Wearable Dosimeters 67.2%

By Energy, Active Dosimeters to Record Higher Growth Owing to Demand for Real-Time Detection

The active dosimeters segment is expected to register a CAGR of 5.4% from 2025 to 2035, outpacing the passive dosimeters category. This growth is driven by the rising preference for real-time radiation monitoring solutions that offer instant alerts and accumulated dose readouts, especially in high-risk industries like nuclear energy, medical imaging, and defense operations.

Active dosimeters, which rely on electronic components, provide superior functionality compared to their passive counterparts, including data storage, Bluetooth connectivity, and digital display features. With increasing regulatory scrutiny and worker safety norms in sectors such as mining, oil & gas, and environmental monitoring, demand for active dosimeters is expected to remain robust.

Key players such as Mirion Technologies and Thermo Fisher Scientific are continuously investing in compact and wearable active dosimetry devices with improved battery life and sensitivity, further bolstering this segment’s prospects.

Energy Segment CAGR (2025 to 2035)
Active Dosimeters 5.4%

By End User, Medical Sector to Lead with Significant CAGR Due to Growing Radiology and Oncology Practices

The medical end user segment is projected to expand at a CAGR of 5.8% between 2025 and 2035, making it the fastest-growing among all end-user categories. The growth is primarily attributed to the increasing use of radiation-based diagnostic and therapeutic techniques such as CT scans, PET imaging, and radiotherapy. The rising cancer incidence worldwide and the need for radiation exposure monitoring among oncologists, radiologists, and technical staff are critical growth drivers.

Moreover, advancements in nuclear medicine and radiopharmaceutical development have spurred the necessity for precise dosimetry equipment in healthcare facilities. The growing awareness regarding occupational radiation hazards and strict regulatory frameworks enforced by agencies like the FDA and IAEA have further compelled hospitals and diagnostic centers to adopt modern dosimetry solutions, particularly electronic and wearable devices. Leading suppliers, including LANDAUER and Mirion Technologies, are expanding their offerings tailored for medical environments.

End User Segment CAGR (2025 to 2035)
Medical 5.8%

Key Trends that Can be Optimized by Dosimetry Manufacturers

  • Growing use of dosimetry equipment in nuclear medicine and the surging acceptance of radiopharmaceuticals in the therapeutic field are creating lucrative opportunities for industry players.
  • Increasing usage of radiopharmaceuticals in hospitals can result in heightened radiation levels beyond the set limit. This increases the risk of developing any radiation-related disease among healthcare professionals. As a result, it has become crucial for every healthcare facility to monitor the radiation levels and minimize the exposure of an individual to these radiations.
  • Surging adoption of wearable dosimeters by healthcare staff to analyze radiation levels. Key players are thus focusing on developing improved versions of wearable dosimeters to enhance customer experience.
  • Rising use of imaging devices raises the contact of radiation with the hospital staff. This is creating demand for dosimeters.
  • Mounting investments in research and development of innovative dosimeter technologies to fuel market growth.
  • Increasing demand for dosimetry systems for military forces, featuring reliable performance, extreme durability, and capacity to operate under harsh environments, to enhance the defense, homeland security.

Dosimetry Market Dynamics by Country

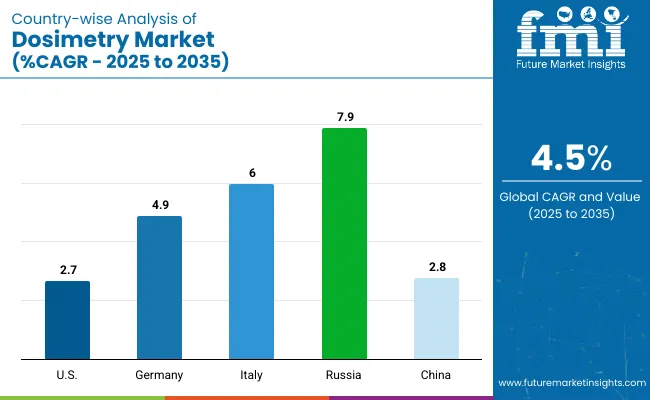
Countries Forecast CAGR (2025 to 2035)
USA 2.70%
Germany 4.90%
Italy 6.0%
Russia 7.90%
China 2.80%

Firms in the United States Invest in Development of Latest Dosimeter Technology to Stay Competitive

Sales of dosimeters in the United States are predicted to steadily expand at a 2.7% CAGR over the forecast period. The increasing cancer and geriatric population are contributing to this market’s growth. Further, investment in the latest technology to improve health protection is projected to sustain key players in this market throughout the years ahead.

Players are further investing in effective customer service departments to help customers select the appropriate radiation monitoring device to cost-effectively and safely meet their state and federal requirements. Some of the frequent users of dosimeters are diagnostic labs, dental labs, educational laboratories, hospitals, diagnostic labs, industrial testing facilities, and veterinary offices.

Use of active dosimetry systems is increasing among medical staff and physicians as it offers immediate insights regarding radiation exposure, helping them to take prompt action to effectively utilize radiation reduction measures.

Players in Germany Strategize for Greater Share by Focusing on Transparent Transactions

The demand for dosimeters in Germany is anticipated to increase at an average of 4.9% CAGR over the next 10 years. The widespread prevalence of cancer, especially skin cancer, is a chief factor that is fueling the dosimetry market in the country. Cases of melanoma cancer are projected to accelerate rapidly in Germany, translating to profitable prospects for providers of dosimeters in the country.

Other key aspects that are supporting the market growth are surging radiation-based treatment and growing awareness about dosimeters. Key players in the country are emphasizing transparency in transactions, affordable price range, and superior quality personnel monitoring service to build consumer loyalty and encourage repeat business.

Russia is Investing in Dosimeter Solutions to Combat the Challenges of Nuclear Industry

The sales of dosimeters in Russia are projected to witness a compelling 7.9% CAGR over the assessment period. The business of dosimeters appears to be as promising as the predictions.

Key players in the country are offering a wide portfolio of dosimetry technology in the industry, ranging from electrometers and dosemeters to smart solutions for quality assurance of sophisticated clinical radiation equipment.

Players in Russia are also offering a complete line of software and hardware products that target aspects like radiation protection and health physics to meet the present nuclear industry challenges.

Use of Dosimeters Increasing Among Interventional Staff of Healthcare Sector in Italy

The dosimetry industry in Italy is experiencing a growth rate of 6% over the forecast period. Key players in Italy offer a diversified range of comprehensive solutions designed for use in radiographic imaging rooms.

The primary reason behind the significant use of dosimeters among interventional staff is that their radiation exposure is higher than in other medical professions owing to scattered radiation. This makes the use of real-time dosimetry a top choice to easily observe, minimize, and manage radiation exposure so that they concentrate on protecting lives.

Climbing Cancer Incidences to Promote Sales of Dosimeters in China

Growth of the dosimetry industry in China is projected to be at a consistent 2.8% CAGR. The country has observed significant installments of dosimeters in the historical period. Looking ahead, the installment rate is predicted to increase, especially in healthcare facilities, to monitor and manage the radiation exposed to hospital staff.

Since cancer cases are climbing, and simultaneously the diagnosis rates, the demand for new radiation therapy is also rising. Key players are thus investing in new radiation therapy to offer effective treatment solutions.

Additionally, the growing demand to modernize equipment and enhance clinical efficiency is going to be the driving force behind innovative new dosimetry solutions.

Strategic Moves Employed by Leading Key Players in the Dosimetry Market

The dosimetry market is fragmented in nature, with limited players providing dosimeter solutions. Players are forming strategic alliances and focusing on system automation to gain more customers.

Key industry participants are developing affordable and reliable dosimeters that cater to various fields. Additionally, they are investing their funds in research and development to develop innovations that will help reduce the cancer burden on medical facilities.

A go-to strategy of competitive players is distribution agreements. Leading players are coming into distribution agreements to ensure stable earnings from end users. Players are also planning to expand into other geographical markets to raise their revenue sources and visibility.

Market contenders are making their pricing completely transparent to ensure their customers that there are no setup charges, no hidden fees, no mailing fees, and no processing fees. Consistently developing high-quality dosimeters, in addition to transparent transactions, are predicted to hold customers loyal to the company for a long time.

Latest Developments Giving Shape to the Landscape

  • In March 2024, Radiation Detection Company, which is a dosimetry service company dedicated to making radiotherapy safety affordable, easy-to-use, and reliable, for healthcare, veterinary, dental, and industrial fields, entered a contract with Thermo Fisher Scientific. Under this agreement, the former will distribute and service the digital dosimetry solution of Thermo Fisher Scientific.
  • In April 2023, NUS researchers invented an affordable and ingestible capsule that acts as an X-ray dosimeter for real-time radiotherapy monitoring. The capsule monitors the temperature, radiation dose, and pH in the gastrointestinal tract in real-time, and has the potential to benefit gastric cancer patients undertaking radiotherapy.
  • In July 2021, the World Health Organization (WHO) and IAEA introduced a new type of dosimetry audit, which is available as a cost-free service to radiotherapy centers. This will help hospitals across the globe to tackle the growing cancer burden.

Key Coverage in the Global Dosimetry Market Research Report

  • Adjacent Study of Global Personal Electronic Dosimeter Market, Radiation Dosimeters Market, Active Dosimeter Market, Medical Radiation Detection, Monitoring & Safety Market, and Global Thermoluminescent Dosimeter (TLD) Services Market
  • Exhaustive Category-wise Market Analysis

Top Companies in the Dosimetry Market

  • Honeywell
  • Fisher Scientific Inc.
  • Landauer, Inc. (Fortive)
  • Mirion Technologies Inc.
  • Fuji Electric Corporation of America
  • Polimaster Inc.
  • JP Laboratories Inc.
  • X-Z Lab Inc.
  • Ludlum Measurements Inc
  • Laurus Systems Inc.
  • Far West Technology Inc.
  • S.E. International Inc.
  • Others

Dosimetry Market Segmentation

By Product Type:

  • Personal Electronic Dosimeter
  • Self-reading Dosimeters
  • Processed Dosimeters

By Modality:

  • Wearable
    • Collar level
    • Chest level
    • Waist level
    • Wrist level
    • Finger level
  • Non-wearable

By Energy:

  • Active Dosimeters
  • Passive Dosimeters
    • Optically Stimulated Luminescence Dosimeter (OSLD)
    • Thermoluminescence Dosimeters (TLD)
    • Radiophotoluminescence (RPL)

By Different End Users of Dosimetry:

  • Industrial
  • Medical
  • Oil and Gas
  • Defense, Homeland Security
  • Mining
  • Environmental
  • Others

By Region:

  • North America
  • Europe
  • Asia Pacific
  • Middle East and Africa
  • Latin America

Table of Content

  1. Executive Summary
  2. Market Overview
  3. Market Background
  4. Global Market Analysis 2020 to 2024 and Forecast 2025 to 2035
  5. Global Market Analysis 2020 to 2024 and Forecast 2025 to 2035, By Product Type
    • Personal Electronic Dosimeter
    • Self-reading Dosimeters
    • Processed Dosimeters
  6. Global Market Analysis 2020 to 2024 and Forecast 2025 to 2035, By Modality
    • Wearable
    • Non-Wearable
  7. Global Market Analysis 2020 to 2024 and Forecast 2025 to 2035, By Energy
    • Active Dosimeters
    • Passive Dosimeters
  8. Global Market Analysis 2020 to 2024 and Forecast 2025 to 2035, By End User
    • Industrial
    • Medical
    • Oil and Gas
    • Defence, Homeland Security
    • Mining
    • Environmental
    • Others
  9. Global Market Analysis 2020 to 2024 and Forecast 2025 to 2035, By Region
    • North America
    • Latin America
    • Western Europe
    • Eastern Europe
    • South Asia and Pacific
    • East Asia
    • Middle East and Africa
  10. North America Market Analysis 2020 to 2024 and Forecast 2025 to 2035, By Country
  11. Latin America Market Analysis 2020 to 2024 and Forecast 2025 to 2035, By Country
  12. Western Europe Market Analysis 2020 to 2024 and Forecast 2025 to 2035, By Country
  13. Eastern Europe Market Analysis 2020 to 2024 and Forecast 2025 to 2035, By Country
  14. South Asia and Pacific Market Analysis 2020 to 2024 and Forecast 2025 to 2035, By Country
  15. East Asia Market Analysis 2020 to 2024 and Forecast 2025 to 2035, By Country
  16. Middle East and Africa Market Analysis 2020 to 2024 and Forecast 2025 to 2035, By Country
  17. Key Countries Market Analysis
  18. Market Structure Analysis
  19. Competition Analysis
    • Honeywell
    • Fisher Scientific Inc.
    • Landauer, Inc. (Fortive)
    • Mirion Technologies Inc.
    • Fuji Electric Corporation of America
    • Polimaster Inc.
    • JP Laboratories Inc.
    • Ludlum Measurements Inc
    • Laurus Systems Inc.
    • Far West Technology Inc.
  20. Assumptions & Acronyms Used
  21. Research Methodology

List of Tables

  • Table 1: Global Market Value (US$ Million) Forecast by Region, 2020 to 2035
  • Table 2: Global Market Volume (Units) Forecast by Region, 2020 to 2035
  • Table 3: Global Market Value (US$ Million) Forecast by Product Type, 2020 to 2035
  • Table 4: Global Market Volume (Units) Forecast by Product Type, 2020 to 2035
  • Table 5: Global Market Value (US$ Million) Forecast by Modality, 2020 to 2035
  • Table 6: Global Market Volume (Units) Forecast by Modality, 2020 to 2035
  • Table 7: Global Market Value (US$ Million) Forecast by Energy, 2020 to 2035
  • Table 8: Global Market Volume (Units) Forecast by Energy, 2020 to 2035
  • Table 9: Global Market Value (US$ Million) Forecast by End User, 2020 to 2035
  • Table 10: Global Market Volume (Units) Forecast by End User, 2020 to 2035
  • Table 11: North America Market Value (US$ Million) Forecast by Country, 2020 to 2035
  • Table 12: North America Market Volume (Units) Forecast by Country, 2020 to 2035
  • Table 13: North America Market Value (US$ Million) Forecast by Product Type, 2020 to 2035
  • Table 14: North America Market Volume (Units) Forecast by Product Type, 2020 to 2035
  • Table 15: North America Market Value (US$ Million) Forecast by Modality, 2020 to 2035
  • Table 16: North America Market Volume (Units) Forecast by Modality, 2020 to 2035
  • Table 17: North America Market Value (US$ Million) Forecast by Energy, 2020 to 2035
  • Table 18: North America Market Volume (Units) Forecast by Energy, 2020 to 2035
  • Table 19: North America Market Value (US$ Million) Forecast by End User, 2020 to 2035
  • Table 20: North America Market Volume (Units) Forecast by End User, 2020 to 2035
  • Table 21: Latin America Market Value (US$ Million) Forecast by Country, 2020 to 2035
  • Table 22: Latin America Market Volume (Units) Forecast by Country, 2020 to 2035
  • Table 23: Latin America Market Value (US$ Million) Forecast by Product Type, 2020 to 2035
  • Table 24: Latin America Market Volume (Units) Forecast by Product Type, 2020 to 2035
  • Table 25: Latin America Market Value (US$ Million) Forecast by Modality, 2020 to 2035
  • Table 26: Latin America Market Volume (Units) Forecast by Modality, 2020 to 2035
  • Table 27: Latin America Market Value (US$ Million) Forecast by Energy, 2020 to 2035
  • Table 28: Latin America Market Volume (Units) Forecast by Energy, 2020 to 2035
  • Table 29: Latin America Market Value (US$ Million) Forecast by End User, 2020 to 2035
  • Table 30: Latin America Market Volume (Units) Forecast by End User, 2020 to 2035
  • Table 31: Western Europe Market Value (US$ Million) Forecast by Country, 2020 to 2035
  • Table 32: Western Europe Market Volume (Units) Forecast by Country, 2020 to 2035
  • Table 33: Western Europe Market Value (US$ Million) Forecast by Product Type, 2020 to 2035
  • Table 34: Western Europe Market Volume (Units) Forecast by Product Type, 2020 to 2035
  • Table 35: Western Europe Market Value (US$ Million) Forecast by Modality, 2020 to 2035
  • Table 36: Western Europe Market Volume (Units) Forecast by Modality, 2020 to 2035
  • Table 37: Western Europe Market Value (US$ Million) Forecast by Energy, 2020 to 2035
  • Table 38: Western Europe Market Volume (Units) Forecast by Energy, 2020 to 2035
  • Table 39: Western Europe Market Value (US$ Million) Forecast by End User, 2020 to 2035
  • Table 40: Western Europe Market Volume (Units) Forecast by End User, 2020 to 2035
  • Table 41: Eastern Europe Market Value (US$ Million) Forecast by Country, 2020 to 2035
  • Table 42: Eastern Europe Market Volume (Units) Forecast by Country, 2020 to 2035
  • Table 43: Eastern Europe Market Value (US$ Million) Forecast by Product Type, 2020 to 2035
  • Table 44: Eastern Europe Market Volume (Units) Forecast by Product Type, 2020 to 2035
  • Table 45: Eastern Europe Market Value (US$ Million) Forecast by Modality, 2020 to 2035
  • Table 46: Eastern Europe Market Volume (Units) Forecast by Modality, 2020 to 2035
  • Table 47: Eastern Europe Market Value (US$ Million) Forecast by Energy, 2020 to 2035
  • Table 48: Eastern Europe Market Volume (Units) Forecast by Energy, 2020 to 2035
  • Table 49: Eastern Europe Market Value (US$ Million) Forecast by End User, 2020 to 2035
  • Table 50: Eastern Europe Market Volume (Units) Forecast by End User, 2020 to 2035
  • Table 51: South Asia and Pacific Market Value (US$ Million) Forecast by Country, 2020 to 2035
  • Table 52: South Asia and Pacific Market Volume (Units) Forecast by Country, 2020 to 2035
  • Table 53: South Asia and Pacific Market Value (US$ Million) Forecast by Product Type, 2020 to 2035
  • Table 54: South Asia and Pacific Market Volume (Units) Forecast by Product Type, 2020 to 2035
  • Table 55: South Asia and Pacific Market Value (US$ Million) Forecast by Modality, 2020 to 2035
  • Table 56: South Asia and Pacific Market Volume (Units) Forecast by Modality, 2020 to 2035
  • Table 57: South Asia and Pacific Market Value (US$ Million) Forecast by Energy, 2020 to 2035
  • Table 58: South Asia and Pacific Market Volume (Units) Forecast by Energy, 2020 to 2035
  • Table 59: South Asia and Pacific Market Value (US$ Million) Forecast by End User, 2020 to 2035
  • Table 60: South Asia and Pacific Market Volume (Units) Forecast by End User, 2020 to 2035
  • Table 61: East Asia Market Value (US$ Million) Forecast by Country, 2020 to 2035
  • Table 62: East Asia Market Volume (Units) Forecast by Country, 2020 to 2035
  • Table 63: East Asia Market Value (US$ Million) Forecast by Product Type, 2020 to 2035
  • Table 64: East Asia Market Volume (Units) Forecast by Product Type, 2020 to 2035
  • Table 65: East Asia Market Value (US$ Million) Forecast by Modality, 2020 to 2035
  • Table 66: East Asia Market Volume (Units) Forecast by Modality, 2020 to 2035
  • Table 67: East Asia Market Value (US$ Million) Forecast by Energy, 2020 to 2035
  • Table 68: East Asia Market Volume (Units) Forecast by Energy, 2020 to 2035
  • Table 69: East Asia Market Value (US$ Million) Forecast by End User, 2020 to 2035
  • Table 70: East Asia Market Volume (Units) Forecast by End User, 2020 to 2035
  • Table 71: Middle East and Africa Market Value (US$ Million) Forecast by Country, 2020 to 2035
  • Table 72: Middle East and Africa Market Volume (Units) Forecast by Country, 2020 to 2035
  • Table 73: Middle East and Africa Market Value (US$ Million) Forecast by Product Type, 2020 to 2035
  • Table 74: Middle East and Africa Market Volume (Units) Forecast by Product Type, 2020 to 2035
  • Table 75: Middle East and Africa Market Value (US$ Million) Forecast by Modality, 2020 to 2035
  • Table 76: Middle East and Africa Market Volume (Units) Forecast by Modality, 2020 to 2035
  • Table 77: Middle East and Africa Market Value (US$ Million) Forecast by Energy, 2020 to 2035
  • Table 78: Middle East and Africa Market Volume (Units) Forecast by Energy, 2020 to 2035
  • Table 79: Middle East and Africa Market Value (US$ Million) Forecast by End User, 2020 to 2035
  • Table 80: Middle East and Africa Market Volume (Units) Forecast by End User, 2020 to 2035

List of Figures

  • Figure 1: Global Market Value (US$ Million) by Product Type, 2025 to 2035
  • Figure 2: Global Market Value (US$ Million) by Modality, 2025 to 2035
  • Figure 3: Global Market Value (US$ Million) by Energy, 2025 to 2035
  • Figure 4: Global Market Value (US$ Million) by End User, 2025 to 2035
  • Figure 5: Global Market Value (US$ Million) by Region, 2025 to 2035
  • Figure 6: Global Market Value (US$ Million) Analysis by Region, 2020 to 2035
  • Figure 7: Global Market Volume (Units) Analysis by Region, 2020 to 2035
  • Figure 8: Global Market Value Share (%) and BPS Analysis by Region, 2025 to 2035
  • Figure 9: Global Market Y-o-Y Growth (%) Projections by Region, 2025 to 2035
  • Figure 10: Global Market Value (US$ Million) Analysis by Product Type, 2020 to 2035
  • Figure 11: Global Market Volume (Units) Analysis by Product Type, 2020 to 2035
  • Figure 12: Global Market Value Share (%) and BPS Analysis by Product Type, 2025 to 2035
  • Figure 13: Global Market Y-o-Y Growth (%) Projections by Product Type, 2025 to 2035
  • Figure 14: Global Market Value (US$ Million) Analysis by Modality, 2020 to 2035
  • Figure 15: Global Market Volume (Units) Analysis by Modality, 2020 to 2035
  • Figure 16: Global Market Value Share (%) and BPS Analysis by Modality, 2025 to 2035
  • Figure 17: Global Market Y-o-Y Growth (%) Projections by Modality, 2025 to 2035
  • Figure 18: Global Market Value (US$ Million) Analysis by Energy, 2020 to 2035
  • Figure 19: Global Market Volume (Units) Analysis by Energy, 2020 to 2035
  • Figure 20: Global Market Value Share (%) and BPS Analysis by Energy, 2025 to 2035
  • Figure 21: Global Market Y-o-Y Growth (%) Projections by Energy, 2025 to 2035
  • Figure 22: Global Market Value (US$ Million) Analysis by End User, 2020 to 2035
  • Figure 23: Global Market Volume (Units) Analysis by End User, 2020 to 2035
  • Figure 24: Global Market Value Share (%) and BPS Analysis by End User, 2025 to 2035
  • Figure 25: Global Market Y-o-Y Growth (%) Projections by End User, 2025 to 2035
  • Figure 26: Global Market Attractiveness by Product Type, 2025 to 2035
  • Figure 27: Global Market Attractiveness by Modality, 2025 to 2035
  • Figure 28: Global Market Attractiveness by Energy, 2025 to 2035
  • Figure 29: Global Market Attractiveness by End User, 2025 to 2035
  • Figure 30: Global Market Attractiveness by Region, 2025 to 2035
  • Figure 31: North America Market Value (US$ Million) by Product Type, 2025 to 2035
  • Figure 32: North America Market Value (US$ Million) by Modality, 2025 to 2035
  • Figure 33: North America Market Value (US$ Million) by Energy, 2025 to 2035
  • Figure 34: North America Market Value (US$ Million) by End User, 2025 to 2035
  • Figure 35: North America Market Value (US$ Million) by Country, 2025 to 2035
  • Figure 36: North America Market Value (US$ Million) Analysis by Country, 2020 to 2035
  • Figure 37: North America Market Volume (Units) Analysis by Country, 2020 to 2035
  • Figure 38: North America Market Value Share (%) and BPS Analysis by Country, 2025 to 2035
  • Figure 39: North America Market Y-o-Y Growth (%) Projections by Country, 2025 to 2035
  • Figure 40: North America Market Value (US$ Million) Analysis by Product Type, 2020 to 2035
  • Figure 41: North America Market Volume (Units) Analysis by Product Type, 2020 to 2035
  • Figure 42: North America Market Value Share (%) and BPS Analysis by Product Type, 2025 to 2035
  • Figure 43: North America Market Y-o-Y Growth (%) Projections by Product Type, 2025 to 2035
  • Figure 44: North America Market Value (US$ Million) Analysis by Modality, 2020 to 2035
  • Figure 45: North America Market Volume (Units) Analysis by Modality, 2020 to 2035
  • Figure 46: North America Market Value Share (%) and BPS Analysis by Modality, 2025 to 2035
  • Figure 47: North America Market Y-o-Y Growth (%) Projections by Modality, 2025 to 2035
  • Figure 48: North America Market Value (US$ Million) Analysis by Energy, 2020 to 2035
  • Figure 49: North America Market Volume (Units) Analysis by Energy, 2020 to 2035
  • Figure 50: North America Market Value Share (%) and BPS Analysis by Energy, 2025 to 2035
  • Figure 51: North America Market Y-o-Y Growth (%) Projections by Energy, 2025 to 2035
  • Figure 52: North America Market Value (US$ Million) Analysis by End User, 2020 to 2035
  • Figure 53: North America Market Volume (Units) Analysis by End User, 2020 to 2035
  • Figure 54: North America Market Value Share (%) and BPS Analysis by End User, 2025 to 2035
  • Figure 55: North America Market Y-o-Y Growth (%) Projections by End User, 2025 to 2035
  • Figure 56: North America Market Attractiveness by Product Type, 2025 to 2035
  • Figure 57: North America Market Attractiveness by Modality, 2025 to 2035
  • Figure 58: North America Market Attractiveness by Energy, 2025 to 2035
  • Figure 59: North America Market Attractiveness by End User, 2025 to 2035
  • Figure 60: North America Market Attractiveness by Country, 2025 to 2035
  • Figure 61: Latin America Market Value (US$ Million) by Product Type, 2025 to 2035
  • Figure 62: Latin America Market Value (US$ Million) by Modality, 2025 to 2035
  • Figure 63: Latin America Market Value (US$ Million) by Energy, 2025 to 2035
  • Figure 64: Latin America Market Value (US$ Million) by End User, 2025 to 2035
  • Figure 65: Latin America Market Value (US$ Million) by Country, 2025 to 2035
  • Figure 66: Latin America Market Value (US$ Million) Analysis by Country, 2020 to 2035
  • Figure 67: Latin America Market Volume (Units) Analysis by Country, 2020 to 2035
  • Figure 68: Latin America Market Value Share (%) and BPS Analysis by Country, 2025 to 2035
  • Figure 69: Latin America Market Y-o-Y Growth (%) Projections by Country, 2025 to 2035
  • Figure 70: Latin America Market Value (US$ Million) Analysis by Product Type, 2020 to 2035
  • Figure 71: Latin America Market Volume (Units) Analysis by Product Type, 2020 to 2035
  • Figure 72: Latin America Market Value Share (%) and BPS Analysis by Product Type, 2025 to 2035
  • Figure 73: Latin America Market Y-o-Y Growth (%) Projections by Product Type, 2025 to 2035
  • Figure 74: Latin America Market Value (US$ Million) Analysis by Modality, 2020 to 2035
  • Figure 75: Latin America Market Volume (Units) Analysis by Modality, 2020 to 2035
  • Figure 76: Latin America Market Value Share (%) and BPS Analysis by Modality, 2025 to 2035
  • Figure 77: Latin America Market Y-o-Y Growth (%) Projections by Modality, 2025 to 2035
  • Figure 78: Latin America Market Value (US$ Million) Analysis by Energy, 2020 to 2035
  • Figure 79: Latin America Market Volume (Units) Analysis by Energy, 2020 to 2035
  • Figure 80: Latin America Market Value Share (%) and BPS Analysis by Energy, 2025 to 2035
  • Figure 81: Latin America Market Y-o-Y Growth (%) Projections by Energy, 2025 to 2035
  • Figure 82: Latin America Market Value (US$ Million) Analysis by End User, 2020 to 2035
  • Figure 83: Latin America Market Volume (Units) Analysis by End User, 2020 to 2035
  • Figure 84: Latin America Market Value Share (%) and BPS Analysis by End User, 2025 to 2035
  • Figure 85: Latin America Market Y-o-Y Growth (%) Projections by End User, 2025 to 2035
  • Figure 86: Latin America Market Attractiveness by Product Type, 2025 to 2035
  • Figure 87: Latin America Market Attractiveness by Modality, 2025 to 2035
  • Figure 88: Latin America Market Attractiveness by Energy, 2025 to 2035
  • Figure 89: Latin America Market Attractiveness by End User, 2025 to 2035
  • Figure 90: Latin America Market Attractiveness by Country, 2025 to 2035
  • Figure 91: Western Europe Market Value (US$ Million) by Product Type, 2025 to 2035
  • Figure 92: Western Europe Market Value (US$ Million) by Modality, 2025 to 2035
  • Figure 93: Western Europe Market Value (US$ Million) by Energy, 2025 to 2035
  • Figure 94: Western Europe Market Value (US$ Million) by End User, 2025 to 2035
  • Figure 95: Western Europe Market Value (US$ Million) by Country, 2025 to 2035
  • Figure 96: Western Europe Market Value (US$ Million) Analysis by Country, 2020 to 2035
  • Figure 97: Western Europe Market Volume (Units) Analysis by Country, 2020 to 2035
  • Figure 98: Western Europe Market Value Share (%) and BPS Analysis by Country, 2025 to 2035
  • Figure 99: Western Europe Market Y-o-Y Growth (%) Projections by Country, 2025 to 2035
  • Figure 100: Western Europe Market Value (US$ Million) Analysis by Product Type, 2020 to 2035
  • Figure 101: Western Europe Market Volume (Units) Analysis by Product Type, 2020 to 2035
  • Figure 102: Western Europe Market Value Share (%) and BPS Analysis by Product Type, 2025 to 2035
  • Figure 103: Western Europe Market Y-o-Y Growth (%) Projections by Product Type, 2025 to 2035
  • Figure 104: Western Europe Market Value (US$ Million) Analysis by Modality, 2020 to 2035
  • Figure 105: Western Europe Market Volume (Units) Analysis by Modality, 2020 to 2035
  • Figure 106: Western Europe Market Value Share (%) and BPS Analysis by Modality, 2025 to 2035
  • Figure 107: Western Europe Market Y-o-Y Growth (%) Projections by Modality, 2025 to 2035
  • Figure 108: Western Europe Market Value (US$ Million) Analysis by Energy, 2020 to 2035
  • Figure 109: Western Europe Market Volume (Units) Analysis by Energy, 2020 to 2035
  • Figure 110: Western Europe Market Value Share (%) and BPS Analysis by Energy, 2025 to 2035
  • Figure 111: Western Europe Market Y-o-Y Growth (%) Projections by Energy, 2025 to 2035
  • Figure 112: Western Europe Market Value (US$ Million) Analysis by End User, 2020 to 2035
  • Figure 113: Western Europe Market Volume (Units) Analysis by End User, 2020 to 2035
  • Figure 114: Western Europe Market Value Share (%) and BPS Analysis by End User, 2025 to 2035
  • Figure 115: Western Europe Market Y-o-Y Growth (%) Projections by End User, 2025 to 2035
  • Figure 116: Western Europe Market Attractiveness by Product Type, 2025 to 2035
  • Figure 117: Western Europe Market Attractiveness by Modality, 2025 to 2035
  • Figure 118: Western Europe Market Attractiveness by Energy, 2025 to 2035
  • Figure 119: Western Europe Market Attractiveness by End User, 2025 to 2035
  • Figure 120: Western Europe Market Attractiveness by Country, 2025 to 2035
  • Figure 121: Eastern Europe Market Value (US$ Million) by Product Type, 2025 to 2035
  • Figure 122: Eastern Europe Market Value (US$ Million) by Modality, 2025 to 2035
  • Figure 123: Eastern Europe Market Value (US$ Million) by Energy, 2025 to 2035
  • Figure 124: Eastern Europe Market Value (US$ Million) by End User, 2025 to 2035
  • Figure 125: Eastern Europe Market Value (US$ Million) by Country, 2025 to 2035
  • Figure 126: Eastern Europe Market Value (US$ Million) Analysis by Country, 2020 to 2035
  • Figure 127: Eastern Europe Market Volume (Units) Analysis by Country, 2020 to 2035
  • Figure 128: Eastern Europe Market Value Share (%) and BPS Analysis by Country, 2025 to 2035
  • Figure 129: Eastern Europe Market Y-o-Y Growth (%) Projections by Country, 2025 to 2035
  • Figure 130: Eastern Europe Market Value (US$ Million) Analysis by Product Type, 2020 to 2035
  • Figure 131: Eastern Europe Market Volume (Units) Analysis by Product Type, 2020 to 2035
  • Figure 132: Eastern Europe Market Value Share (%) and BPS Analysis by Product Type, 2025 to 2035
  • Figure 133: Eastern Europe Market Y-o-Y Growth (%) Projections by Product Type, 2025 to 2035
  • Figure 134: Eastern Europe Market Value (US$ Million) Analysis by Modality, 2020 to 2035
  • Figure 135: Eastern Europe Market Volume (Units) Analysis by Modality, 2020 to 2035
  • Figure 136: Eastern Europe Market Value Share (%) and BPS Analysis by Modality, 2025 to 2035
  • Figure 137: Eastern Europe Market Y-o-Y Growth (%) Projections by Modality, 2025 to 2035
  • Figure 138: Eastern Europe Market Value (US$ Million) Analysis by Energy, 2020 to 2035
  • Figure 139: Eastern Europe Market Volume (Units) Analysis by Energy, 2020 to 2035
  • Figure 140: Eastern Europe Market Value Share (%) and BPS Analysis by Energy, 2025 to 2035
  • Figure 141: Eastern Europe Market Y-o-Y Growth (%) Projections by Energy, 2025 to 2035
  • Figure 142: Eastern Europe Market Value (US$ Million) Analysis by End User, 2020 to 2035
  • Figure 143: Eastern Europe Market Volume (Units) Analysis by End User, 2020 to 2035
  • Figure 144: Eastern Europe Market Value Share (%) and BPS Analysis by End User, 2025 to 2035
  • Figure 145: Eastern Europe Market Y-o-Y Growth (%) Projections by End User, 2025 to 2035
  • Figure 146: Eastern Europe Market Attractiveness by Product Type, 2025 to 2035
  • Figure 147: Eastern Europe Market Attractiveness by Modality, 2025 to 2035
  • Figure 148: Eastern Europe Market Attractiveness by Energy, 2025 to 2035
  • Figure 149: Eastern Europe Market Attractiveness by End User, 2025 to 2035
  • Figure 150: Eastern Europe Market Attractiveness by Country, 2025 to 2035
  • Figure 151: South Asia and Pacific Market Value (US$ Million) by Product Type, 2025 to 2035
  • Figure 152: South Asia and Pacific Market Value (US$ Million) by Modality, 2025 to 2035
  • Figure 153: South Asia and Pacific Market Value (US$ Million) by Energy, 2025 to 2035
  • Figure 154: South Asia and Pacific Market Value (US$ Million) by End User, 2025 to 2035
  • Figure 155: South Asia and Pacific Market Value (US$ Million) by Country, 2025 to 2035
  • Figure 156: South Asia and Pacific Market Value (US$ Million) Analysis by Country, 2020 to 2035
  • Figure 157: South Asia and Pacific Market Volume (Units) Analysis by Country, 2020 to 2035
  • Figure 158: South Asia and Pacific Market Value Share (%) and BPS Analysis by Country, 2025 to 2035
  • Figure 159: South Asia and Pacific Market Y-o-Y Growth (%) Projections by Country, 2025 to 2035
  • Figure 160: South Asia and Pacific Market Value (US$ Million) Analysis by Product Type, 2020 to 2035
  • Figure 161: South Asia and Pacific Market Volume (Units) Analysis by Product Type, 2020 to 2035
  • Figure 162: South Asia and Pacific Market Value Share (%) and BPS Analysis by Product Type, 2025 to 2035
  • Figure 163: South Asia and Pacific Market Y-o-Y Growth (%) Projections by Product Type, 2025 to 2035
  • Figure 164: South Asia and Pacific Market Value (US$ Million) Analysis by Modality, 2020 to 2035
  • Figure 165: South Asia and Pacific Market Volume (Units) Analysis by Modality, 2020 to 2035
  • Figure 166: South Asia and Pacific Market Value Share (%) and BPS Analysis by Modality, 2025 to 2035
  • Figure 167: South Asia and Pacific Market Y-o-Y Growth (%) Projections by Modality, 2025 to 2035
  • Figure 168: South Asia and Pacific Market Value (US$ Million) Analysis by Energy, 2020 to 2035
  • Figure 169: South Asia and Pacific Market Volume (Units) Analysis by Energy, 2020 to 2035
  • Figure 170: South Asia and Pacific Market Value Share (%) and BPS Analysis by Energy, 2025 to 2035
  • Figure 171: South Asia and Pacific Market Y-o-Y Growth (%) Projections by Energy, 2025 to 2035
  • Figure 172: South Asia and Pacific Market Value (US$ Million) Analysis by End User, 2020 to 2035
  • Figure 173: South Asia and Pacific Market Volume (Units) Analysis by End User, 2020 to 2035
  • Figure 174: South Asia and Pacific Market Value Share (%) and BPS Analysis by End User, 2025 to 2035
  • Figure 175: South Asia and Pacific Market Y-o-Y Growth (%) Projections by End User, 2025 to 2035
  • Figure 176: South Asia and Pacific Market Attractiveness by Product Type, 2025 to 2035
  • Figure 177: South Asia and Pacific Market Attractiveness by Modality, 2025 to 2035
  • Figure 178: South Asia and Pacific Market Attractiveness by Energy, 2025 to 2035
  • Figure 179: South Asia and Pacific Market Attractiveness by End User, 2025 to 2035
  • Figure 180: South Asia and Pacific Market Attractiveness by Country, 2025 to 2035
  • Figure 181: East Asia Market Value (US$ Million) by Product Type, 2025 to 2035
  • Figure 182: East Asia Market Value (US$ Million) by Modality, 2025 to 2035
  • Figure 183: East Asia Market Value (US$ Million) by Energy, 2025 to 2035
  • Figure 184: East Asia Market Value (US$ Million) by End User, 2025 to 2035
  • Figure 185: East Asia Market Value (US$ Million) by Country, 2025 to 2035
  • Figure 186: East Asia Market Value (US$ Million) Analysis by Country, 2020 to 2035
  • Figure 187: East Asia Market Volume (Units) Analysis by Country, 2020 to 2035
  • Figure 188: East Asia Market Value Share (%) and BPS Analysis by Country, 2025 to 2035
  • Figure 189: East Asia Market Y-o-Y Growth (%) Projections by Country, 2025 to 2035
  • Figure 190: East Asia Market Value (US$ Million) Analysis by Product Type, 2020 to 2035
  • Figure 191: East Asia Market Volume (Units) Analysis by Product Type, 2020 to 2035
  • Figure 192: East Asia Market Value Share (%) and BPS Analysis by Product Type, 2025 to 2035
  • Figure 193: East Asia Market Y-o-Y Growth (%) Projections by Product Type, 2025 to 2035
  • Figure 194: East Asia Market Value (US$ Million) Analysis by Modality, 2020 to 2035
  • Figure 195: East Asia Market Volume (Units) Analysis by Modality, 2020 to 2035
  • Figure 196: East Asia Market Value Share (%) and BPS Analysis by Modality, 2025 to 2035
  • Figure 197: East Asia Market Y-o-Y Growth (%) Projections by Modality, 2025 to 2035
  • Figure 198: East Asia Market Value (US$ Million) Analysis by Energy, 2020 to 2035
  • Figure 199: East Asia Market Volume (Units) Analysis by Energy, 2020 to 2035
  • Figure 200: East Asia Market Value Share (%) and BPS Analysis by Energy, 2025 to 2035
  • Figure 201: East Asia Market Y-o-Y Growth (%) Projections by Energy, 2025 to 2035
  • Figure 202: East Asia Market Value (US$ Million) Analysis by End User, 2020 to 2035
  • Figure 203: East Asia Market Volume (Units) Analysis by End User, 2020 to 2035
  • Figure 204: East Asia Market Value Share (%) and BPS Analysis by End User, 2025 to 2035
  • Figure 205: East Asia Market Y-o-Y Growth (%) Projections by End User, 2025 to 2035
  • Figure 206: East Asia Market Attractiveness by Product Type, 2025 to 2035
  • Figure 207: East Asia Market Attractiveness by Modality, 2025 to 2035
  • Figure 208: East Asia Market Attractiveness by Energy, 2025 to 2035
  • Figure 209: East Asia Market Attractiveness by End User, 2025 to 2035
  • Figure 210: East Asia Market Attractiveness by Country, 2025 to 2035
  • Figure 211: Middle East and Africa Market Value (US$ Million) by Product Type, 2025 to 2035
  • Figure 212: Middle East and Africa Market Value (US$ Million) by Modality, 2025 to 2035
  • Figure 213: Middle East and Africa Market Value (US$ Million) by Energy, 2025 to 2035
  • Figure 214: Middle East and Africa Market Value (US$ Million) by End User, 2025 to 2035
  • Figure 215: Middle East and Africa Market Value (US$ Million) by Country, 2025 to 2035
  • Figure 216: Middle East and Africa Market Value (US$ Million) Analysis by Country, 2020 to 2035
  • Figure 217: Middle East and Africa Market Volume (Units) Analysis by Country, 2020 to 2035
  • Figure 218: Middle East and Africa Market Value Share (%) and BPS Analysis by Country, 2025 to 2035
  • Figure 219: Middle East and Africa Market Y-o-Y Growth (%) Projections by Country, 2025 to 2035
  • Figure 220: Middle East and Africa Market Value (US$ Million) Analysis by Product Type, 2020 to 2035
  • Figure 221: Middle East and Africa Market Volume (Units) Analysis by Product Type, 2020 to 2035
  • Figure 222: Middle East and Africa Market Value Share (%) and BPS Analysis by Product Type, 2025 to 2035
  • Figure 223: Middle East and Africa Market Y-o-Y Growth (%) Projections by Product Type, 2025 to 2035
  • Figure 224: Middle East and Africa Market Value (US$ Million) Analysis by Modality, 2020 to 2035
  • Figure 225: Middle East and Africa Market Volume (Units) Analysis by Modality, 2020 to 2035
  • Figure 226: Middle East and Africa Market Value Share (%) and BPS Analysis by Modality, 2025 to 2035
  • Figure 227: Middle East and Africa Market Y-o-Y Growth (%) Projections by Modality, 2025 to 2035
  • Figure 228: Middle East and Africa Market Value (US$ Million) Analysis by Energy, 2020 to 2035
  • Figure 229: Middle East and Africa Market Volume (Units) Analysis by Energy, 2020 to 2035
  • Figure 230: Middle East and Africa Market Value Share (%) and BPS Analysis by Energy, 2025 to 2035
  • Figure 231: Middle East and Africa Market Y-o-Y Growth (%) Projections by Energy, 2025 to 2035
  • Figure 232: Middle East and Africa Market Value (US$ Million) Analysis by End User, 2020 to 2035
  • Figure 233: Middle East and Africa Market Volume (Units) Analysis by End User, 2020 to 2035
  • Figure 234: Middle East and Africa Market Value Share (%) and BPS Analysis by End User, 2025 to 2035
  • Figure 235: Middle East and Africa Market Y-o-Y Growth (%) Projections by End User, 2025 to 2035
  • Figure 236: Middle East and Africa Market Attractiveness by Product Type, 2025 to 2035
  • Figure 237: Middle East and Africa Market Attractiveness by Modality, 2025 to 2035
  • Figure 238: Middle East and Africa Market Attractiveness by Energy, 2025 to 2035
  • Figure 239: Middle East and Africa Market Attractiveness by End User, 2025 to 2035
  • Figure 240: Middle East and Africa Market Attractiveness by Country, 2025 to 2035

Frequently Asked Questions

What is the projected size of the dosimetry market by 2035?

The dosimetry market is expected to grow from USD 3.28 billion in 2025 to USD 5.1 billion by 2035, with a CAGR of 4.5%.

Which product segment is leading the dosimetry market in 2025?

The personal electronic dosimeter segment is projected to dominate the market with 61.3% market share in 2025.

What is the fastest-growing modality segment in the dosimetry market?

The wearable dosimeter segment is expected to hold 67.2% market share in 2025 and continue growing.

Which energy type in the dosimetry market is expected to grow the fastest?

The active dosimeters segment is projected to register a CAGR of 5.4% from 2025 to 2035.

Which end-user sector is witnessing the fastest growth in the dosimetry market?

The medical sector is projected to grow at a CAGR of 5.8% between 2025 and 2035.

Future Market Insights

Dosimetry Market