E-Scooter Financing Market Size and Share Forecast Outlook (2023 to 2033)

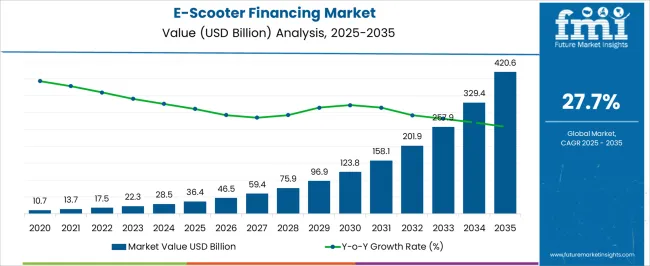
The global e-scooter financing market revenue totaled USD 17 billion in 2022. The E-scooter financing market is expected to reach USD 279.8 billion by 2033, with demand growing at a CAGR of 29% over the forecast period.

Attributes Details
E-Scooter Financing Market Estimated Size (2023) USD 21.9 billion
Projected Market Valuation (2033) USD 279.8 billion
Value-based CAGR (2023 to 2033) 29%

E-scooter financing currently accounts for around 22.6% of the total e-vehicle financing market. In recent years, electric scooters have gained traction because they are convenient, easy to use, and relatively eco-friendly. They are quite simple to drive and hence can be a viable substitute for traditional modes of transportation, particularly in large cities for short distances.

As there is an increase in demand for e-scooters, various financing alternatives are available for electric scooter buyers to purchase or lease an e-scooter. Electric scooter manufacturers partner with banks and non-banking financial companies to provide e-scooter loans. Customers are able to acquire electric scooters using these e-scooter financing platforms, which is likely to provide them with reasonable and transparent credit using various e-scooter finance schemes.

Individuals who want to buy or lease an electric scooter can use electric two-wheeler finance plans. The most common technologies utilized by financial institutions nowadays to serve consumers are blockchain, mobile banking and digital payment systems.

Comparison of Historical vs Forecast Outlook (2018 to 2033)

The e-scooter financing demand is estimated to grow at a CAGR of 29% between 2023 and 2033 in comparison with a CAGR of around 26% registered between 2018 to 2022. Earlier, traditional procedures in the vehicle financing sector were extremely complicated and time-consuming. Manually processing the application used to take many days. Thanks to digitization, the identical procedure now just takes a few minutes. As a result, customers can simply take advantage of rapid and painless transactions.

Electric scooters are more popular than traditional scooters since they are more environmentally friendly. They have LED lights that power the light and use a little amount of energy. These scooters have additional benefits such as agility, versatility, eco-friendliness, and ease of maneuvering in congested places, all of which have increased the sales of electric scooters.

From investments and portfolios to salaries and purchases, cryptocurrency is already a part of many regular financial discussions. Investing in cryptocurrencies has grown in popularity as a result of the possibility of big financial returns and the growing number of virtual currencies to choose from. Bitcoin, Bitcoin Cash and Ethereum are starting to be accepted in an increasing number of stores.

Purchasing an e-scooter using cryptocurrency is becoming possible in 2023. While there aren't as many alternatives for buying an e-scooter with crypto as there are for buying an e-scooter with cash, it is feasible to buy an e-scooter with crypto. Blockchain with related technologies is set to redefine the automotive industry and how consumers purchase, insure, and use vehicles. Through these technologies, the adoption of e-scooters is on the rise, benefiting the original equipment manufacturers, suppliers, government institutions/ non-banking financials.

Impact of AI Adoption on E-Scooter Financing Growth

The fintech industry is currently undergoing a significant shift. Customers now have easier access to credit, making purchases and transactions easier than ever. Because of digitization, open API, and machine learning integration, the fintech sector has experienced a revolution.

The e-scooter loan sector is being transformed by machine learning. E-scooter finance lenders who are able to implement artificial intelligence are able to attract more consumers while taking less risk. When it comes to streamlining finance and loan processes like credit scoring, risk management, and compliance reporting, banks see machine learning as a natural fit.

E-scooter finance companies are focusing on providing better-quality services to their end users, and strengthening existing products and services by implementing technologies such as artificial intelligence, business analytics, and blockchain. Thus, technological advancements are driving growth in the e-scooter financing market.
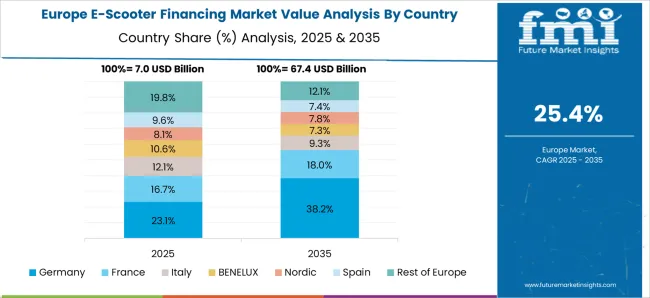
Analysis of Top Countries Using E-Scooter Financing Services

How is the Germany E-Scooter Financing Market Faring?

Rising Awareness Regarding E-scooter Payment Plans in Germany is expected to Boost Sales

Germany is predicted to offer an absolute $ opportunity of USD 7.8 billion by the end of 2033. Many cities in Germany are adopting electric scooters to reduce their carbon footprint and increase mobility options. The German government has implemented rigorous rules and restrictions on carbon emissions caused by vehicles.

These laws are compelling e-scooter manufacturers to develop low-emission vehicles, resulting in the widespread adoption of electric vehicles and a rise in the number of charging stations. In addition, various e-scooter financing companies are present in Germany that provide integrated e-scooter financing services by leveraging digital technologies and advanced analytics.
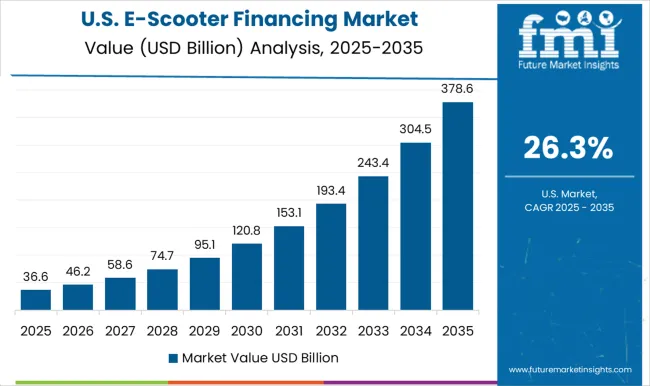
Why is the United States E-Scooter Financing Market Witnessing High Demand?

High Demand for Smart E-scooters in the United States is projected to Augment Growth

The demand for e-scooter financing in the United States is expected to account for nearly 69% of the North American market share by 2033. Electronic scooters are gaining popularity in the country and are quickly becoming preferable modes of transportation.

There is rapid adoption of shared e-scooters in the United States to cut carbon emissions. Electric scooters are becoming more common on university campuses, parks, and other public spaces as a result of stricter emission laws in the country.

Smart charging stations' accessibility and growing use of micro-mobility in logistics applications have resulted in high demand for smart e-scooters. Consumers in the United States are availing of e-scooter financing solutions from banks and non-banking financial companies, which is expected to drive the market in the forthcoming years.

Why is the India E-scooter Financing Market Considered Attractive?

Rising Preference for Smart Mobility Solutions in India is poised to Spur Sales of E-scooter Financing

Sales in India are estimated to grow at an impressive rate of around 37% CAGR between 2023 and 2033. The government of India has adopted a number of steps to reduce vehicle pollution, including tax exemptions, purchase rebates, and financial incentives by providing subsidies for electric vehicle customers.

Non-banking financial companies are gaining popularity in the vehicle financing sector in semi-urban and rural India. They are also tying up with scooter manufacturers to provide affordable electric scooter finance options for buyers.

Category-wise Insights in the E-Scooter Financing Market

Why is the Demand for Electric Mopeds Increasing?

E-scooter Payment Plans for Electric Mopeds are Anticipated to Gain Traction

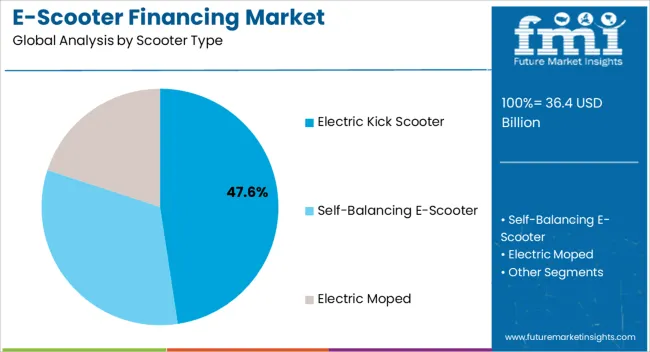
Based on the scooter type, the electric moped segment is expected to offer an absolute $ opportunity of USD 128 billion by the end of 2033. These scooters are convenient and accessible modes of transportation and use electricity, which is typically less polluting than gasoline or other fossil fuels.

Rising petroleum cost is the most critical factor responsible for the adoption of high-speed electric scooters. Electric two-wheelers have cheap running costs and more efficiency compared to traditional vehicles. Electronic systems are more efficient and long-lasting than mechanical systems since there is less friction between them.

Why are Non-Banking Finance Corporations More Preferred?

Sales of E-scooter Financing Plans Across Non-Banking Finance Corporation are assumed to Increase

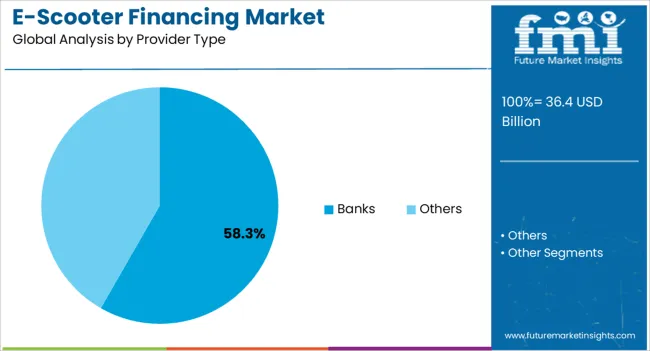
In terms of provider type, demand in non-banking finance corporations and credit unions is likely to increase by 13.4X between 2023 to 2033. Electric scooter manufacturers are partnering with non-banking financial corporations to deliver e-scooter loans by providing various e-scooter payment plans.

Non-banking finance corporations are improving their services by providing consumers with low-interest rates, flexible tenure options, and extended EMI alternatives with minimal documentation. With easy financing options available for customers, the adoption of electric scooters is rapidly increasing. NBFCs are also focusing on developing innovative products and services powered by advanced technologies.

How is Lease Financing Contributing to Growth in the E-Scooter Financing Market?

Consumers are Preferring Lease for E-scooter Financing

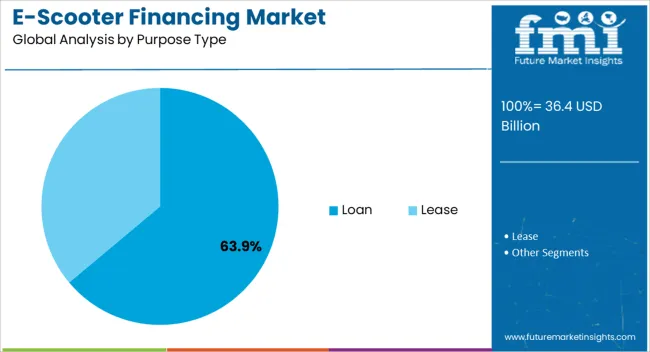
By purpose type, demand in the lease segment is anticipated to grow at a CAGR of 31% during the forecast period. Leasing services are available for both new and used scooters.

E-scooter leasing entails borrowing a scooter from a dealership for a set period of time. Customers can also receive a better scooter at a reduced cost through leasing, and they can change or upgrade their vehicles without any hassle.

In the e-scooter leasing sector, the growing trend of upgradation facilities and personalized services offered by auto financers are poised to boost sales. Auto leasing companies are investing in digitization technologies such as blockchain to improve the customer experience and increase profit.
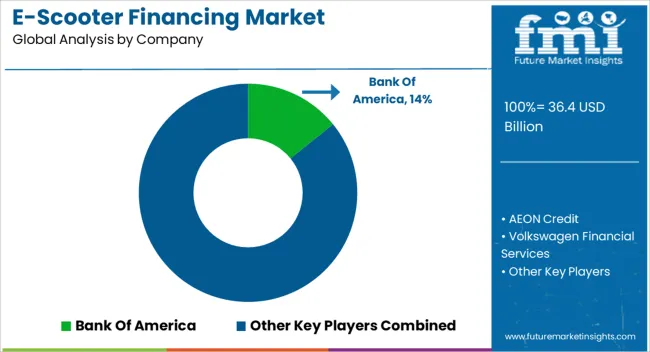
Competitive Landscape of the E-Scooter Financing Market

E-scooter financing providers are building strategies such as product innovation to improve their services to meet the growing demand. Players are collaborating with technology professionals to gain a competitive edge.

  • In March 2022, IDFC First Bank announced a partnership with Ather Energy to provide electric scooter financing options to customers. This partnership is projected to allow the customers to make use of instant loans from IDFC First Bank at low-interest rates.
  • In March 2022, L&T Finance joined hands with Hero Electrics to provide consumers with simple financing options, hassle-free loan approvals in under three minutes, and reasonable interest rates starting at 7.99%.
  • Enigma established a strategic alliance with EZFinance, a financial institution, in July 2023, to boost Enigma's ability to provide end-to-end e-scooter financing support to its loyal dealers and assure an efficient buying experience for clients countrywide.
  • Quantum Energy, a well-known electric vehicle (EV) startup specializing in the design, creation, manufacturing, and selling of electric scooters, revealed a strategic partnership with Bike Bazaar in July 2023. This collaboration intends to expedite the implementation of environmentally friendly mobility solutions by making Quantum Energy's Bziness Pro e-scooters more widely available, especially for last-mile delivery.

Scope of the E-Scooter Financing Market Report

Attributes Details
Estimated Market Size (2023) USD 21.9 billion
Projected Market Valuation (2033) USD 279.8 billion
Value-based CAGR (2023 to 2033) 29%
Forecast Period 2023 to 2033
Historical Data Available for 2018 to 2022
Market Analysis USD billion for Value
Key Regions Covered North America; Latin America; Western Europe; Eastern Europe; South Asia & Pacific; East Asia; Middle East & Africa
Key Countries Covered United States, Canada, Brazil, Mexico, Germany, United Kingdom, France, Spain, Italy, Poland, Russia, Czech Republic, Romania, India, Bangladesh, Australia, New Zealand, China, Japan, South Korea, GCC Countries, South Africa, Israel
Key Segments Covered Scooter Type, Provider Type, Purpose Type, Region
Key Companies Profiled Bank of America; AEON Credit; Volkswagen financial services; HDB Financial Services; IDFC First Bank; Klarna; Katapult; greaves finance; L&T Finance; Hyundai Capital; Affirm
Customization & Pricing Available upon Request

Top Segments Studied in the E-Scooter Financing Outlook by Category

By Scooter Type:

  • Electric Kick Scooter
  • Self-Balancing E-scooter
  • Electric Moped

By Provider Type:

  • Banks
  • Others

By Purpose Type:

  • Loan
  • Lease

By Region:

  • North America
  • Latin America
  • Western Europe
  • Eastern Europe
  • South Asia & Pacific
  • East Asia
  • Middle East & Africa

Table of Content

  • 1. Executive Summary
  • 2. Market Overview
  • 3. Market Background
  • 4. Global Market Analysis 2018 to 2022 and Forecast, 2023 to 2033
  • 5. Global Market Analysis 2018 to 2022 and Forecast 2023 to 2033, By Scooter Type
    • 5.1. Electric Kick Scooter
    • 5.2. Self-Balancing E-scooter
    • 5.3. Electric Moped
  • 6. Global Market Analysis 2018 to 2022 and Forecast 2023 to 2033, By Provider Type
    • 6.1. Banks
    • 6.2. Others
  • 7. Global Market Analysis 2018 to 2022 and Forecast 2023 to 2033, By Purpose Type
    • 7.1. Loan
    • 7.2. Lease
  • 8. Global Market Analysis 2018 to 2022 and Forecast 2023 to 2033, By Region
    • 8.1. North America
    • 8.2. Latin America
    • 8.3. Western Europe
    • 8.4. Eastern Europe
    • 8.5. South Asia and Pacific
    • 8.6. East Asia
    • 8.7. Middle East and Africa
  • 9. North America Market Analysis 2018 to 2022 and Forecast 2023 to 2033, By Country
  • 10. Latin America Market Analysis 2018 to 2022 and Forecast 2023 to 2033, By Country
  • 11. Western Europe Market Analysis 2018 to 2022 and Forecast 2023 to 2033, By Country
  • 12. Eastern Europe Market Analysis 2018 to 2022 and Forecast 2023 to 2033, By Country
  • 13. South Asia and Pacific Market Analysis 2018 to 2022 and Forecast 2023 to 2033, By Country
  • 14. East Asia Market Analysis 2018 to 2022 and Forecast 2023 to 2033, By Country
  • 15. Middle East and Africa Market Analysis 2018 to 2022 and Forecast 2023 to 2033, By Country
  • 16. Key Countries Market Analysis
  • 17. Market Structure Analysis
  • 18. Competition Analysis
    • 18.1. Bank of America
    • 18.2. AEON Credit
    • 18.3. Volkswagen Financial Services
    • 18.4. HDB Financial Services
    • 18.5. IDFC First Bank
    • 18.6. Klarna
    • 18.7. Katapult
    • 18.8. Greaves Finance
    • 18.9. L&T Finance
    • 18.10. Hyundai Capital
    • 18.11. Affirm
  • 19. Assumptions & Acronyms Used
  • 20. Research Methodology

List of Tables

Table 1: Global Market Value (US$ Million) Forecast by Region, 2018 to 2033

Table 2: Global Market Value (US$ Million) Forecast by Scooter Type, 2018 to 2033

Table 3: Global Market Value (US$ Million) Forecast by Provider Type, 2018 to 2033

Table 4: Global Market Value (US$ Million) Forecast by Purpose Type, 2018 to 2033

Table 5: North America Market Value (US$ Million) Forecast by Country, 2018 to 2033

Table 6: North America Market Value (US$ Million) Forecast by Scooter Type, 2018 to 2033

Table 7: North America Market Value (US$ Million) Forecast by Provider Type, 2018 to 2033

Table 8: North America Market Value (US$ Million) Forecast by Purpose Type, 2018 to 2033

Table 9: Latin America Market Value (US$ Million) Forecast by Country, 2018 to 2033

Table 10: Latin America Market Value (US$ Million) Forecast by Scooter Type, 2018 to 2033

Table 11: Latin America Market Value (US$ Million) Forecast by Provider Type, 2018 to 2033

Table 12: Latin America Market Value (US$ Million) Forecast by Purpose Type, 2018 to 2033

Table 13: Western Europe Market Value (US$ Million) Forecast by Country, 2018 to 2033

Table 14: Western Europe Market Value (US$ Million) Forecast by Scooter Type, 2018 to 2033

Table 15: Western Europe Market Value (US$ Million) Forecast by Provider Type, 2018 to 2033

Table 16: Western Europe Market Value (US$ Million) Forecast by Purpose Type, 2018 to 2033

Table 17: Eastern Europe Market Value (US$ Million) Forecast by Country, 2018 to 2033

Table 18: Eastern Europe Market Value (US$ Million) Forecast by Scooter Type, 2018 to 2033

Table 19: Eastern Europe Market Value (US$ Million) Forecast by Provider Type, 2018 to 2033

Table 20: Eastern Europe Market Value (US$ Million) Forecast by Purpose Type, 2018 to 2033

Table 21: South Asia and Pacific Market Value (US$ Million) Forecast by Country, 2018 to 2033

Table 22: South Asia and Pacific Market Value (US$ Million) Forecast by Scooter Type, 2018 to 2033

Table 23: South Asia and Pacific Market Value (US$ Million) Forecast by Provider Type, 2018 to 2033

Table 24: South Asia and Pacific Market Value (US$ Million) Forecast by Purpose Type, 2018 to 2033

Table 25: East Asia Market Value (US$ Million) Forecast by Country, 2018 to 2033

Table 26: East Asia Market Value (US$ Million) Forecast by Scooter Type, 2018 to 2033

Table 27: East Asia Market Value (US$ Million) Forecast by Provider Type, 2018 to 2033

Table 28: East Asia Market Value (US$ Million) Forecast by Purpose Type, 2018 to 2033

Table 29: Middle East and Africa Market Value (US$ Million) Forecast by Country, 2018 to 2033

Table 30: Middle East and Africa Market Value (US$ Million) Forecast by Scooter Type, 2018 to 2033

Table 31: Middle East and Africa Market Value (US$ Million) Forecast by Provider Type, 2018 to 2033

Table 32: Middle East and Africa Market Value (US$ Million) Forecast by Purpose Type, 2018 to 2033

List of Figures

Figure 1: Global Market Value (US$ Million) by Scooter Type, 2023 to 2033

Figure 2: Global Market Value (US$ Million) by Provider Type, 2023 to 2033

Figure 3: Global Market Value (US$ Million) by Purpose Type, 2023 to 2033

Figure 4: Global Market Value (US$ Million) by Region, 2023 to 2033

Figure 5: Global Market Value (US$ Million) Analysis by Region, 2018 to 2033

Figure 6: Global Market Value Share (%) and BPS Analysis by Region, 2023 to 2033

Figure 7: Global Market Y-o-Y Growth (%) Projections by Region, 2023 to 2033

Figure 8: Global Market Value (US$ Million) Analysis by Scooter Type, 2018 to 2033

Figure 9: Global Market Value Share (%) and BPS Analysis by Scooter Type, 2023 to 2033

Figure 10: Global Market Y-o-Y Growth (%) Projections by Scooter Type, 2023 to 2033

Figure 11: Global Market Value (US$ Million) Analysis by Provider Type, 2018 to 2033

Figure 12: Global Market Value Share (%) and BPS Analysis by Provider Type, 2023 to 2033

Figure 13: Global Market Y-o-Y Growth (%) Projections by Provider Type, 2023 to 2033

Figure 14: Global Market Value (US$ Million) Analysis by Purpose Type, 2018 to 2033

Figure 15: Global Market Value Share (%) and BPS Analysis by Purpose Type, 2023 to 2033

Figure 16: Global Market Y-o-Y Growth (%) Projections by Purpose Type, 2023 to 2033

Figure 17: Global Market Attractiveness by Scooter Type, 2023 to 2033

Figure 18: Global Market Attractiveness by Provider Type, 2023 to 2033

Figure 19: Global Market Attractiveness by Purpose Type, 2023 to 2033

Figure 20: Global Market Attractiveness by Region, 2023 to 2033

Figure 21: North America Market Value (US$ Million) by Scooter Type, 2023 to 2033

Figure 22: North America Market Value (US$ Million) by Provider Type, 2023 to 2033

Figure 23: North America Market Value (US$ Million) by Purpose Type, 2023 to 2033

Figure 24: North America Market Value (US$ Million) by Country, 2023 to 2033

Figure 25: North America Market Value (US$ Million) Analysis by Country, 2018 to 2033

Figure 26: North America Market Value Share (%) and BPS Analysis by Country, 2023 to 2033

Figure 27: North America Market Y-o-Y Growth (%) Projections by Country, 2023 to 2033

Figure 28: North America Market Value (US$ Million) Analysis by Scooter Type, 2018 to 2033

Figure 29: North America Market Value Share (%) and BPS Analysis by Scooter Type, 2023 to 2033

Figure 30: North America Market Y-o-Y Growth (%) Projections by Scooter Type, 2023 to 2033

Figure 31: North America Market Value (US$ Million) Analysis by Provider Type, 2018 to 2033

Figure 32: North America Market Value Share (%) and BPS Analysis by Provider Type, 2023 to 2033

Figure 33: North America Market Y-o-Y Growth (%) Projections by Provider Type, 2023 to 2033

Figure 34: North America Market Value (US$ Million) Analysis by Purpose Type, 2018 to 2033

Figure 35: North America Market Value Share (%) and BPS Analysis by Purpose Type, 2023 to 2033

Figure 36: North America Market Y-o-Y Growth (%) Projections by Purpose Type, 2023 to 2033

Figure 37: North America Market Attractiveness by Scooter Type, 2023 to 2033

Figure 38: North America Market Attractiveness by Provider Type, 2023 to 2033

Figure 39: North America Market Attractiveness by Purpose Type, 2023 to 2033

Figure 40: North America Market Attractiveness by Country, 2023 to 2033

Figure 41: Latin America Market Value (US$ Million) by Scooter Type, 2023 to 2033

Figure 42: Latin America Market Value (US$ Million) by Provider Type, 2023 to 2033

Figure 43: Latin America Market Value (US$ Million) by Purpose Type, 2023 to 2033

Figure 44: Latin America Market Value (US$ Million) by Country, 2023 to 2033

Figure 45: Latin America Market Value (US$ Million) Analysis by Country, 2018 to 2033

Figure 46: Latin America Market Value Share (%) and BPS Analysis by Country, 2023 to 2033

Figure 47: Latin America Market Y-o-Y Growth (%) Projections by Country, 2023 to 2033

Figure 48: Latin America Market Value (US$ Million) Analysis by Scooter Type, 2018 to 2033

Figure 49: Latin America Market Value Share (%) and BPS Analysis by Scooter Type, 2023 to 2033

Figure 50: Latin America Market Y-o-Y Growth (%) Projections by Scooter Type, 2023 to 2033

Figure 51: Latin America Market Value (US$ Million) Analysis by Provider Type, 2018 to 2033

Figure 52: Latin America Market Value Share (%) and BPS Analysis by Provider Type, 2023 to 2033

Figure 53: Latin America Market Y-o-Y Growth (%) Projections by Provider Type, 2023 to 2033

Figure 54: Latin America Market Value (US$ Million) Analysis by Purpose Type, 2018 to 2033

Figure 55: Latin America Market Value Share (%) and BPS Analysis by Purpose Type, 2023 to 2033

Figure 56: Latin America Market Y-o-Y Growth (%) Projections by Purpose Type, 2023 to 2033

Figure 57: Latin America Market Attractiveness by Scooter Type, 2023 to 2033

Figure 58: Latin America Market Attractiveness by Provider Type, 2023 to 2033

Figure 59: Latin America Market Attractiveness by Purpose Type, 2023 to 2033

Figure 60: Latin America Market Attractiveness by Country, 2023 to 2033

Figure 61: Western Europe Market Value (US$ Million) by Scooter Type, 2023 to 2033

Figure 62: Western Europe Market Value (US$ Million) by Provider Type, 2023 to 2033

Figure 63: Western Europe Market Value (US$ Million) by Purpose Type, 2023 to 2033

Figure 64: Western Europe Market Value (US$ Million) by Country, 2023 to 2033

Figure 65: Western Europe Market Value (US$ Million) Analysis by Country, 2018 to 2033

Figure 66: Western Europe Market Value Share (%) and BPS Analysis by Country, 2023 to 2033

Figure 67: Western Europe Market Y-o-Y Growth (%) Projections by Country, 2023 to 2033

Figure 68: Western Europe Market Value (US$ Million) Analysis by Scooter Type, 2018 to 2033

Figure 69: Western Europe Market Value Share (%) and BPS Analysis by Scooter Type, 2023 to 2033

Figure 70: Western Europe Market Y-o-Y Growth (%) Projections by Scooter Type, 2023 to 2033

Figure 71: Western Europe Market Value (US$ Million) Analysis by Provider Type, 2018 to 2033

Figure 72: Western Europe Market Value Share (%) and BPS Analysis by Provider Type, 2023 to 2033

Figure 73: Western Europe Market Y-o-Y Growth (%) Projections by Provider Type, 2023 to 2033

Figure 74: Western Europe Market Value (US$ Million) Analysis by Purpose Type, 2018 to 2033

Figure 75: Western Europe Market Value Share (%) and BPS Analysis by Purpose Type, 2023 to 2033

Figure 76: Western Europe Market Y-o-Y Growth (%) Projections by Purpose Type, 2023 to 2033

Figure 77: Western Europe Market Attractiveness by Scooter Type, 2023 to 2033

Figure 78: Western Europe Market Attractiveness by Provider Type, 2023 to 2033

Figure 79: Western Europe Market Attractiveness by Purpose Type, 2023 to 2033

Figure 80: Western Europe Market Attractiveness by Country, 2023 to 2033

Figure 81: Eastern Europe Market Value (US$ Million) by Scooter Type, 2023 to 2033

Figure 82: Eastern Europe Market Value (US$ Million) by Provider Type, 2023 to 2033

Figure 83: Eastern Europe Market Value (US$ Million) by Purpose Type, 2023 to 2033

Figure 84: Eastern Europe Market Value (US$ Million) by Country, 2023 to 2033

Figure 85: Eastern Europe Market Value (US$ Million) Analysis by Country, 2018 to 2033

Figure 86: Eastern Europe Market Value Share (%) and BPS Analysis by Country, 2023 to 2033

Figure 87: Eastern Europe Market Y-o-Y Growth (%) Projections by Country, 2023 to 2033

Figure 88: Eastern Europe Market Value (US$ Million) Analysis by Scooter Type, 2018 to 2033

Figure 89: Eastern Europe Market Value Share (%) and BPS Analysis by Scooter Type, 2023 to 2033

Figure 90: Eastern Europe Market Y-o-Y Growth (%) Projections by Scooter Type, 2023 to 2033

Figure 91: Eastern Europe Market Value (US$ Million) Analysis by Provider Type, 2018 to 2033

Figure 92: Eastern Europe Market Value Share (%) and BPS Analysis by Provider Type, 2023 to 2033

Figure 93: Eastern Europe Market Y-o-Y Growth (%) Projections by Provider Type, 2023 to 2033

Figure 94: Eastern Europe Market Value (US$ Million) Analysis by Purpose Type, 2018 to 2033

Figure 95: Eastern Europe Market Value Share (%) and BPS Analysis by Purpose Type, 2023 to 2033

Figure 96: Eastern Europe Market Y-o-Y Growth (%) Projections by Purpose Type, 2023 to 2033

Figure 97: Eastern Europe Market Attractiveness by Scooter Type, 2023 to 2033

Figure 98: Eastern Europe Market Attractiveness by Provider Type, 2023 to 2033

Figure 99: Eastern Europe Market Attractiveness by Purpose Type, 2023 to 2033

Figure 100: Eastern Europe Market Attractiveness by Country, 2023 to 2033

Figure 101: South Asia and Pacific Market Value (US$ Million) by Scooter Type, 2023 to 2033

Figure 102: South Asia and Pacific Market Value (US$ Million) by Provider Type, 2023 to 2033

Figure 103: South Asia and Pacific Market Value (US$ Million) by Purpose Type, 2023 to 2033

Figure 104: South Asia and Pacific Market Value (US$ Million) by Country, 2023 to 2033

Figure 105: South Asia and Pacific Market Value (US$ Million) Analysis by Country, 2018 to 2033

Figure 106: South Asia and Pacific Market Value Share (%) and BPS Analysis by Country, 2023 to 2033

Figure 107: South Asia and Pacific Market Y-o-Y Growth (%) Projections by Country, 2023 to 2033

Figure 108: South Asia and Pacific Market Value (US$ Million) Analysis by Scooter Type, 2018 to 2033

Figure 109: South Asia and Pacific Market Value Share (%) and BPS Analysis by Scooter Type, 2023 to 2033

Figure 110: South Asia and Pacific Market Y-o-Y Growth (%) Projections by Scooter Type, 2023 to 2033

Figure 111: South Asia and Pacific Market Value (US$ Million) Analysis by Provider Type, 2018 to 2033

Figure 112: South Asia and Pacific Market Value Share (%) and BPS Analysis by Provider Type, 2023 to 2033

Figure 113: South Asia and Pacific Market Y-o-Y Growth (%) Projections by Provider Type, 2023 to 2033

Figure 114: South Asia and Pacific Market Value (US$ Million) Analysis by Purpose Type, 2018 to 2033

Figure 115: South Asia and Pacific Market Value Share (%) and BPS Analysis by Purpose Type, 2023 to 2033

Figure 116: South Asia and Pacific Market Y-o-Y Growth (%) Projections by Purpose Type, 2023 to 2033

Figure 117: South Asia and Pacific Market Attractiveness by Scooter Type, 2023 to 2033

Figure 118: South Asia and Pacific Market Attractiveness by Provider Type, 2023 to 2033

Figure 119: South Asia and Pacific Market Attractiveness by Purpose Type, 2023 to 2033

Figure 120: South Asia and Pacific Market Attractiveness by Country, 2023 to 2033

Figure 121: East Asia Market Value (US$ Million) by Scooter Type, 2023 to 2033

Figure 122: East Asia Market Value (US$ Million) by Provider Type, 2023 to 2033

Figure 123: East Asia Market Value (US$ Million) by Purpose Type, 2023 to 2033

Figure 124: East Asia Market Value (US$ Million) by Country, 2023 to 2033

Figure 125: East Asia Market Value (US$ Million) Analysis by Country, 2018 to 2033

Figure 126: East Asia Market Value Share (%) and BPS Analysis by Country, 2023 to 2033

Figure 127: East Asia Market Y-o-Y Growth (%) Projections by Country, 2023 to 2033

Figure 128: East Asia Market Value (US$ Million) Analysis by Scooter Type, 2018 to 2033

Figure 129: East Asia Market Value Share (%) and BPS Analysis by Scooter Type, 2023 to 2033

Figure 130: East Asia Market Y-o-Y Growth (%) Projections by Scooter Type, 2023 to 2033

Figure 131: East Asia Market Value (US$ Million) Analysis by Provider Type, 2018 to 2033

Figure 132: East Asia Market Value Share (%) and BPS Analysis by Provider Type, 2023 to 2033

Figure 133: East Asia Market Y-o-Y Growth (%) Projections by Provider Type, 2023 to 2033

Figure 134: East Asia Market Value (US$ Million) Analysis by Purpose Type, 2018 to 2033

Figure 135: East Asia Market Value Share (%) and BPS Analysis by Purpose Type, 2023 to 2033

Figure 136: East Asia Market Y-o-Y Growth (%) Projections by Purpose Type, 2023 to 2033

Figure 137: East Asia Market Attractiveness by Scooter Type, 2023 to 2033

Figure 138: East Asia Market Attractiveness by Provider Type, 2023 to 2033

Figure 139: East Asia Market Attractiveness by Purpose Type, 2023 to 2033

Figure 140: East Asia Market Attractiveness by Country, 2023 to 2033

Figure 141: Middle East and Africa Market Value (US$ Million) by Scooter Type, 2023 to 2033

Figure 142: Middle East and Africa Market Value (US$ Million) by Provider Type, 2023 to 2033

Figure 143: Middle East and Africa Market Value (US$ Million) by Purpose Type, 2023 to 2033

Figure 144: Middle East and Africa Market Value (US$ Million) by Country, 2023 to 2033

Figure 145: Middle East and Africa Market Value (US$ Million) Analysis by Country, 2018 to 2033

Figure 146: Middle East and Africa Market Value Share (%) and BPS Analysis by Country, 2023 to 2033

Figure 147: Middle East and Africa Market Y-o-Y Growth (%) Projections by Country, 2023 to 2033

Figure 148: Middle East and Africa Market Value (US$ Million) Analysis by Scooter Type, 2018 to 2033

Figure 149: Middle East and Africa Market Value Share (%) and BPS Analysis by Scooter Type, 2023 to 2033

Figure 150: Middle East and Africa Market Y-o-Y Growth (%) Projections by Scooter Type, 2023 to 2033

Figure 151: Middle East and Africa Market Value (US$ Million) Analysis by Provider Type, 2018 to 2033

Figure 152: Middle East and Africa Market Value Share (%) and BPS Analysis by Provider Type, 2023 to 2033

Figure 153: Middle East and Africa Market Y-o-Y Growth (%) Projections by Provider Type, 2023 to 2033

Figure 154: Middle East and Africa Market Value (US$ Million) Analysis by Purpose Type, 2018 to 2033

Figure 155: Middle East and Africa Market Value Share (%) and BPS Analysis by Purpose Type, 2023 to 2033

Figure 156: Middle East and Africa Market Y-o-Y Growth (%) Projections by Purpose Type, 2023 to 2033

Figure 157: Middle East and Africa Market Attractiveness by Scooter Type, 2023 to 2033

Figure 158: Middle East and Africa Market Attractiveness by Provider Type, 2023 to 2033

Figure 159: Middle East and Africa Market Attractiveness by Purpose Type, 2023 to 2033

Figure 160: Middle East and Africa Market Attractiveness by Country, 2023 to 2033

Frequently Asked Questions

How Big is the E-Scooter Financing Market? 

The market is valued at USD 21.9 billion in 2023. 

Who are the Leading Industry Players? 

Bank of America and AEON Credit are the leading industry players. 

What is the Growth Forecast for the E-Scooter Financing Market? 

The market is forecast to register a CAGR of 29.0% through 2033.

What is the Key Market Trend? 

Integration of artificial intelligence (AI) is expected to fuel the market prospects.

How was the Historical Performance of the Market? 

From 2018 to 2022, the market registered a CAGR of 26.0%. 

Explore Similar Insights

Future Market Insights

E-Scooter Financing Market