Encoder Market
Market Insights on Encoder covering sales outlook, demand forecast & up-to-date key trends
Encoder Market By Type (Linear Encoders, Rotary Encoders), Position Signal (Absolute, Incremental), Sensing Technology (Optical Sensing, Magnetic Sensing, Capacitive Encoders, Inductive Encoders), Application (Automotive, Consumer Electronics, Aerospace & Defense, Healthcare & Medical Devices, Industrial) & Region - Forecast 2022 - 2030
Encoder Market Outlook (2022-2030)
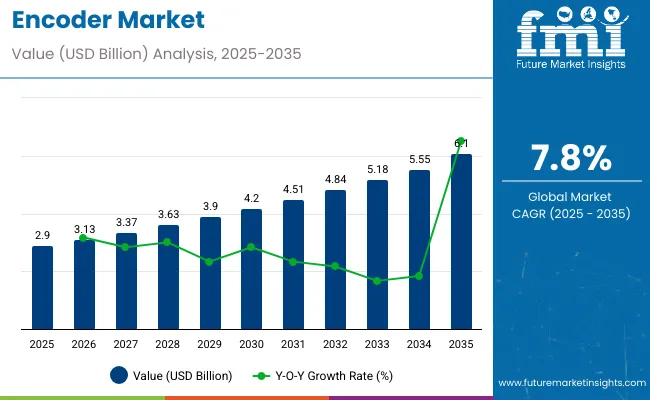
[370 Pages Report] The global encoder market is expected to register a CAGR of 7.7% over the forecasted period (2022 - 2030). Sales of encoders are predicted to be valued at US$ 2.17 Bn in 2022 and climb to US$ 3.95 Bn by 2030.
Encoder Market Size (2022) |
US$ 2.17 Bn |
Sales Forecast (2030) |
US$ 3.95 Bn |
Global Market Growth Rate (2022 to 2030) |
7.7% |
Share of Top 5 Market Players |
20% |
Linear encoders and rotary encoders use sensing technology including optical sensing encoders, magnetic sensing encoders, capacitive encoders, and inductive encoders in different applications such as automotive, consumer electronics, industrial, and others.
Continuous developments and implementation of new technologies such as optical technology-based encoders and Surface Mount Technology (SMT) processes in encoder devices and the emerging Internet of Things (IoT) technology.
Let us know your requirement to get
100% FREE customization
Sales Analysis of Encoders (2015-2021) Vs Market Outlook (2022 to 2030)
“Increasing Use of Embedded Microprocessors & Advanced Signal Processing Algorithms Spur Demand for Encoders”
Encoder market demand is estimated to rise at 7.7% CAGR between 2022 and 2030 in comparison with the 6.2% CAGR registered from 2015 to 2021.
Technological advancements and the increasing popularity of signal on-demand in hybrid absolute/incremental rotational encoders are expected to create an opportunity for the encoder market over the coming years.
To improve reliability in operations, manufacturers are incorporating embedded microprocessors and advanced signal-processing algorithms in encoders. This is mainly due to the mechanical complexity and vulnerability of conventional absolute optical encoders when used in harsh conditions. Additionally, microprocessor-based instruments enable engineers to alter measurement characteristics through software such as update resolution, zero-point location and measurement direction, without making any mechanical or physical alterations.
The global encoder market is anticipated to witness an increase in revenue from US$ 2.17 Bn in 2022 to US$ 3.95 Bn by 2030.
Which Emerging Trends are Set to Propel Sales of Encoders?
“Rising Adoption of Encoders for Communication between Controls & Monitoring of Machines”
Encoders provide solutions for motion control in various industrial automated systems applications which helps in driving the growth of the encoder market. Encoder offers various features such as speed, endurance, and reliability for factory automation. The reliability of such features helps to drive the encoder market during the forecast period.
There is rising demand for improved automated controls that helps to improve performance, reduce costs, improve productivity etc. for many industrial applications. Thus the demand for encoders is fueling automotive applications.
CNC machines maintain the position in the face of heavy spindles and workpieces, multi-axis movement, and high speed. Encoders used in CNC machining components help to work together to mill, drill and bore correct parts. It also helps to touch probes used to program CNC machines and develops a full line of control systems.
Find your sweet spots for generating winning opportunities in this market.
Talk to AnalystCountry-wise Insights
How is the U.S. Encoder Market Expected to Fare?
“Presence of Key Encoder Manufacturers to Sway Market Demand”
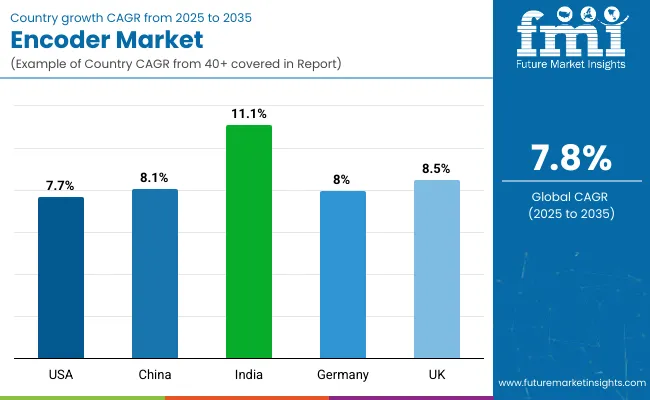
The market in the U.S. is anticipated to be valued at around US$ 849.1 Mn by 2030. The country will account for 85.5% market share of North America region in 2022.
The U.S. is one of the prominent countries in encoder solutions sales. The U.S. has the presence of key encoder manufacturers including Honeywell International Inc., Rockwell Automation, Inc., Heidenhain Corporation, and others.
- In January 2019, Rockwell Automation acquired Emulate3D, an innovative engineering software developer, to expand its digital design portfolio for industrial applications.
Such development in the country ultimately spur demand for encoders.
Why is Demand for Encoders Increasing in China?
“Increasing Usage of Encoders in Automotive Industry”
The encoder market in China has a value of around US$ 225.8 Mn in 2022. The market is anticipated to show a higher CAGR of 7.7% from 2022 to 2030.
China is a prominent country in terms of the consumption of encoders. This attributes to a high increase in demand for encoders from automotive, and other manufacturing sectors coupled with the growing number of end-use industries in the country.
Due to the intense presence of market participants coupled with increasing industrial revolution 4.0 in the country, demand for encoders has increased over the years.
Wat are the Sales Prospects for Encoder Suppliers in Japan?
“Government Initiatives in Automation Sector to Fuel Market Value”
As per FMI, overall encoder spending in Japan is likely to increase at a rate of almost 9.4% from 2022 to 2030, with a market value of US$ 376.2 Mn in 2022.
Japan witnessed the presence of developed infrastructure for industrial revolution 4.0.
- In January 2019, Panasonic launched the new PT-VMZ50 series for flexible installation and consistent brightness. It offers reliable and long-lasting whisper-quiet operation that is designed for use in conference rooms, classrooms, executive boardrooms and many applications in corporate environments and education.
Such development in the country ultimately boost demand for encoders. Growing industrialization, initiatives by the government in the automation industry and rising need for better tracking and monitoring capabilities are driving market expansion in Japan.
Category-wise Insights
Which Encoder Type is Expected to Showcase Highest Demand Growth?
“Growing Industrial Automation across Industries Driving Demand for Rotary Encoders”
The rotary encoders segment is expected to grow 1.6X by 2030. Moreover, the linear encoders segment is expected to register the highest CAGR of 9.2% over the forecast period.
By type, rotary encoders are majorly used in applications such as assembly machines, packaging, x and y indication systems, printers, testing machines, CNC machines, robotics, labeling machines, medical equipment, and others.
It provides advantages such as highly reliable and accurate, low-cost feedback, high resolution, integrated electronics, fuses optical and digital technology and others. Due to such advantages, demand for rotary encoders has been increasing over the years.
Why is Demand for Optical Sensing Encoders Increasing?
“Optical Sensing Encoders Continue to Witness Extensive Usage Attributed to Greater Resolution & Higher Accuracy”
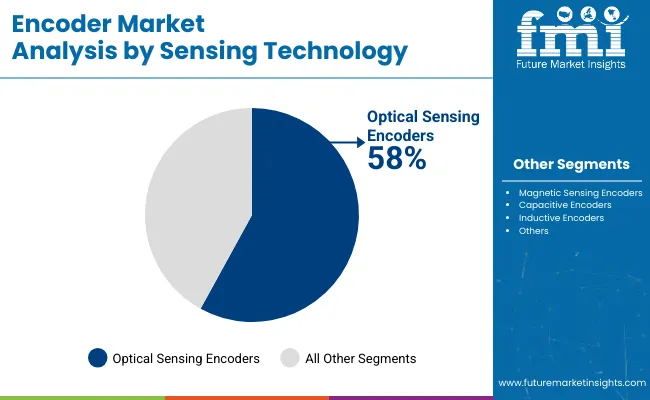
AS per FMI, by sensing technology, the optical sensing encoders segment is expected to showcase the highest market share of 48.5% in 2022 and it is set to grow at the highest CAGR of 9.5% from 2022 to 2030
Optical sensing encoders use light shone through a coded disk that helps to track the movement of a shaft. It offers various advantages such as high resolution, better angular accuracy, operating in extreme environments, better reliability, large hollow shaft encoders, lightweight, and others.
Therefore, growing adoption of optical sensing encoders across various applications is set to drive market growth.
Which Encoder Application is Expected to Gain Momentum?
“Resurgence in Automotive Industry Driving Market Growth”
By application, the automotive segment accounted for an impressive market share of 29% in 2021. Due to the rapid deployment of IoT, which uses encoders for a variety of reasons, the automotive sector is expected to hold a significant share in the global market.
An optical encoder helps to convert the angular motion or position of the encoder blade to digital code. Rotary encoders are majorly used across various applications which need precise shaft unlimited rotation including robotics, industrial controls, climate control units, computer input devices (such as trackballs and optomechanical mice), and many user interfaces.
Owing to such advantages, demand for encoders is surging in automotive applications.

An unified Market Research Subscription Platform, built for today’s disparate research needs.
COVID-19 Impact on Encoders Consumption
The COVID-19 pandemic impacted the encoder market negatively due to a halt in manufacturing activities. Supply chains, the interchange and transit of necessary supplies, and the distribution of diverse commodities were all harmed due to the COVID-19 pandemic.
Now, to achieve a competitive advantage, market participants are likely to rely on production momentum. Manufacturers are incorporating advanced signal-processing algorithms and encoders to improve operational reliability. Increasing demand for production capabilities driven by the force of consumerism will sustain a steady growth rate over the coming years.
Competitive Landscape
Encoder providers are continuously focused on cost reduction of the product and improved service for the consumer by implementing different strategies. Companies try to improve the quality of logistics operations and responsiveness in order to personalize customer service and increase the efficiency of their logistics and warehousing operations.
For instance,
- In November 2019, Schneider Electric successfully digitized the entire supply chain of its Evreux international distribution center in Normandy, France, in order to address challenges brought about by new technologies.
- In April 2019, OMRON Corporation introduced factory automation (FA) control devices, which are built on a common design platform for unified product specifications, for further innovation in control panel building.
Encoder Industry Report Scope
Attribute |
Details |
Forecast Period |
2022-2030 |
Historical Data Available for |
2015-2021 |
Market Analysis |
Value in US$ Mn, Volume in Units |
Key Regions Covered |
|
Key Countries Covered |
|
Key Segments Covered |
|
Key Companies Profiled |
|
Report Coverage |
Market Forecast, Company Share Analysis, Competition Intelligence, DROT Analysis, Market Dynamics and Challenges, and Strategic Growth Initiatives |
Customization & Pricing |
Available upon Request |
Encoder Industry Survey Segmentation
Encoder Market by Type:
- Linear Encoders
- Rotary Encoders
Encoder Market by Position Signal:
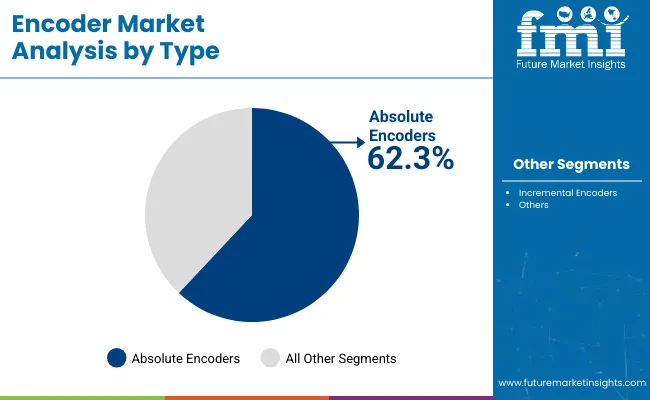
- Absolute Encoders
- Incremental Encoders
Encoder Market by Sensing Technology:
- Optical Sensing Encoders
- Magnetic Sensing Encoders
- Capacitive Encoders
- Inductive Encoders
Encoder Market by Application:
- Automotive
- Consumer Electronics
- Aerospace & Defense
- Healthcare & Medical Devices
- Industrial
- Others
Encoder Market by Region:
- North America Encoder Market
- Latin America Encoder Market
- Europe Encoder Market
- East Asia Encoder Market
- South Asia and Pacific Encoder Market
- Middle East and Africa Encoder Market
Frequently Asked Questions
The global encoder market is currently valued at US$ 2.17 Bn.
North America accounts for 29.2% share of the global encoder market.
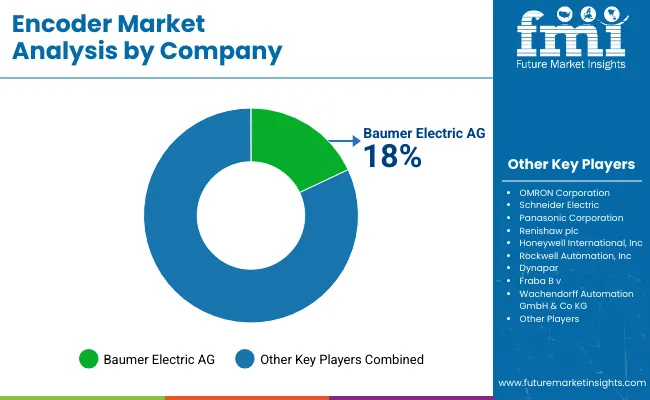
OMRON Corporation, Baumer Electric AG, Schneider Electric, Panasonic Corporation, and Renishaw plc are leading manufacturers of encoders.
Increased demand for encoders in the automation industry and the need for encoders in CNC machining are key factors driving market growth.
Germany, the U.S., Canada, U.K, and France are the top 5 countries driving most of the demand for encoders.
Table of Content
1. Executive Summary
1.1. Global Market Outlook
1.2. Demand Side Trends
1.3. Supply Side Trends
1.4. Analysis and Recommendations
2. Market Overview
2.1. Market Coverage / Taxonomy
2.2. Market Definition / Scope / Limitations
3. Key Market Trends
3.1. Key Trends Impacting the Market
3.2. Innovation / Development Trends
3.3. Key Success Factors
4. Global Encoder Market - Pricing Analysis
4.1. Pricing Analysis, By Type
4.1.1. Manufacturer-level Pricing
4.1.2. Distributor-level Pricing
4.2. Global Average Pricing Analysis Benchmark
5. COVID-19 Impact Analysis
5.1. Impact of COVID-19 on Encoder Sales
5.2. Pre-COVID-19 Market Growth Analysis
5.3. Post-COVID-19 Market Impact Analysis
5.4. Expected Recovery Scenario (Short term/Long term)
5.5. Key Action Points for Encoder Manufactures
6. Market Structure Analysis
6.1. Market Analysis by Tier of Companies
6.2. Market Concentration
6.3. Market Share Analysis of Top Players
6.4. Market Presence Analysis
6.4.1. Regional footprint by Players
6.4.2. Product footprint by Players
6.4.3. Channel footprint by Players
7. Global Encoder Market Demand (in Volume in ‘000 Units) Analysis 2015-2021 and Forecast, 2022-2030
7.1. Historical Market Volume (‘000 Units) Analysis, 2015-2021
7.2. Current and Future Market Volume (‘000 Units) Projections, 2022-2030
7.2.1. Y-o-Y Growth Trend Analysis
8. Global Encoder Market Demand (in Value in US$ Mn) Analysis 2015-2021 and Forecast, 2022-2030
8.1. Historical Market Value (US$ Mn) Analysis, 2015-2021
8.2. Current and Future Market Value (US$ Mn) Projections, 2022-2030
8.2.1. Y-o-Y Growth Trend Analysis
8.2.2. Absolute $ Opportunity Analysis
9. Market Background
9.1. Macro-Economic Factors
9.1.1. Global GDP Growth Outlook
9.1.2. Global Semiconductor & Electronics Market Outlook
9.1.3. Regulations & Policies for Electronic Devices Manufacturing
9.2. Forecast Factors - Relevance & Impact
9.2.1. Historic Growth Rate of Encoder Manufacturers
9.2.2. Business Impact of COVID-19 on Encoder Sales
9.2.3. Demand for Optical Encoders
9.2.4. Product Innovation & R&D Trends
9.3. Value Chain
9.4. Market Dynamics
9.4.1. Drivers
9.4.2. Restraints
9.4.3. Opportunities
10. Global Encoder Market Analysis 2015-2021 and Forecast 2022-2030, by Type
10.1. Introduction / Key Findings
10.2. Historical Market Size (US$ Mn) and Volume (‘000 Units) Analysis By Type, 2015 - 2021
10.3. Current and Future Market Size (US$ Mn) and Volume (‘000 Units) Analysis and Forecast By Type, 2022 - 2030
10.3.1. Linear Encoders
10.3.2. Rotary Encoders
10.4. Market Attractiveness Analysis By Type
11. Global Encoder Market Analysis 2015-2021 and Forecast 2022-2030, by Position Signals
11.1. Introduction / Key Findings
11.2. Historical Market Size (US$ Mn) Analysis By Position Signals, 2015 - 2021
11.3. Current and Future Market Size (US$ Mn) Analysis and Forecast By Position Signals, 2022 – 2030
11.3.1. Absolute
11.3.2. Incremental
11.4. Market Attractiveness Analysis By Position Signals
12. Global Encoder Market Analysis 2015-2021 and Forecast 2022-2030, by Sensing Technology
12.1. Introduction / Key Findings
12.2. Historical Market Size (US$ Mn) Analysis By Sensing Technology, 2015 - 2021
12.3. Current and Future Market Size (US$ Mn) Analysis and Forecast By Sensing Technology, 2022 - 2030
12.3.1. Optical Sensing Encoders
12.3.2. Magnetic Sensing Encoders
12.3.3. Capacitive Encoders
12.3.4. Inductive Encoders
12.4. Market Attractiveness Analysis By Sensing Technology
13. Global Encoder Market Analysis 2015-2021 and Forecast 2022-2030, by Application
13.1. Introduction / Key Findings
13.2. Historical Market Size (US$ Mn) Analysis By Application, 2015 - 2021
13.3. Current and Future Market Size (US$ Mn) Analysis and Forecast By Application, 2022 - 2030
13.3.1. Automotive
13.3.2. Consumer Electronics
13.3.3. Aerospace & Defense
13.3.4. Healthcare & Medical Devices
13.3.5. Industrial
13.3.6. Others
13.4. Market Attractiveness Analysis By Application
14. Global Encoder Market Analysis 2015-2021 and Forecast 2022-2030, by Region
14.1. Introduction / Key Findings
14.2. Historical Market Size (US$ Mn) and Volume (‘000 Units) Analysis By Region, 2015 - 2021
14.3. Current Market Size (US$ Mn) and Volume (‘000 Units) Analysis and Forecast By Region, 2022 - 2030
14.3.1. North America
14.3.2. Latin America
14.3.3. Europe
14.3.4. East Asia
14.3.5. South Asia & Pacific
14.3.6. Middle East & Africa
14.4. Market Attractiveness Analysis By Region
15. North America Encoder Market Analysis 2015-2021 and Forecast 2022-2030
15.1. Introduction
15.2. Historical Market Size (US$ Mn) and Volume (‘000 Units) Trend Analysis By Market Taxonomy, 2015 - 2021
15.3. Market Size (US$ Mn) Forecast By Market Taxonomy, 2022 - 2030
15.3.1. By Type
15.3.2. By Position Signals
15.3.3. By Sensing Technology
15.3.4. By Application
15.3.5. By Country
15.3.5.1. U.S.
15.3.5.2. Canada
15.4. Market Attractiveness Analysis
15.4.1. By Type
15.4.2. By Position Signals
15.4.3. By Sensing Technology
15.4.4. By Application
15.4.5. By Country
15.5. Market Trends
15.6. Key Market Participants - Intensity Mapping
16. Latin America Encoder Market Analysis 2015-2021 and Forecast 2022-2030
16.1. Introduction
16.2. Historical Market Size (US$ Mn) and Volume (‘000 Units) Trend Analysis By Market Taxonomy, 2015 - 2021
16.3. Market Size (US$ Mn) and Volume (‘000 Units) Forecast By Market Taxonomy, 2022 - 2030
16.3.1. By Type
16.3.2. By Position Signals
16.3.3. By Sensing Technology
16.3.4. By Application
16.3.5. By Country
16.3.5.1. Brazil
16.3.5.2. Mexico
16.3.5.3. Rest of Latin America
16.4. Market Attractiveness Analysis
16.4.1. By Type
16.4.2. By Position Signals
16.4.3. By Sensing Technology
16.4.4. By Application
16.4.5. By Country
16.5. Market Trends
16.6. Key Market Participants - Intensity Mapping
17. Europe Encoder Market Analysis 2015-2021 and Forecast 2022-2030
17.1. Introduction
17.2. Historical Market Size (US$ Mn) and Volume (‘000 Units) Trend Analysis By Market Taxonomy, 2015 - 2021
17.3. Market Size (US$ Mn) and Volume (‘000 Units) Forecast By Market Taxonomy, 2022 - 2030
17.3.1. By Type
17.3.2. By Position Signals
17.3.3. By Sensing Technology
17.3.4. By Application
17.3.5. By Country
17.3.5.1. Germany
17.3.5.2. Italy
17.3.5.3. France
17.3.5.4. U.K.
17.3.5.5. Spain
17.3.5.6. BENELUX
17.3.5.7. Russia
17.3.5.8. Rest of Europe
17.4. Market Attractiveness Analysis
17.4.1. By Type
17.4.2. By Position Signals
17.4.3. By Sensing Technology
17.4.4. By Application
17.4.5. By Country
17.5. Market Trends
17.6. Key Market Participants - Intensity Mapping
18. South Asia & Pacific Encoder Market Analysis 2015-2021 and Forecast 2022-2030
18.1. Introduction
18.2. Historical Market Size (US$ Mn) and Volume (‘000 Units) Trend Analysis By Market Taxonomy, 2015 - 2021
18.3. Market Size (US$ Mn) and Volume (‘000 Units) Forecast By Market Taxonomy, 2022 - 2030
18.3.1. By Type
18.3.2. By Position Signals
18.3.3. By Sensing Technology
18.3.4. By Application
18.3.5. By Country
18.3.5.1. India
18.3.5.2. Thailand
18.3.5.3. Indonesia
18.3.5.4. Malaysia
18.3.5.5. Oceania
18.3.5.6. Rest of South Asia & Pacific
18.4. Market Attractiveness Analysis
18.4.1. By Type
18.4.2. By Position Signals
18.4.3. By Sensing Technology
18.4.4. By Application
18.4.5. By Country
18.5. Market Trends
18.6. Key Market Participants - Intensity Mapping
19. East Asia Encoder Market Analysis 2015-2021 and Forecast 2022-2030
19.1. Introduction
19.2. Historical Market Size (US$ Mn) and Volume (‘000 Units) Trend Analysis By Market Taxonomy, 2015 - 2021
19.3. Market Size (US$ Mn) and Volume (‘000 Units) Forecast By Market Taxonomy, 2022 - 2030
19.3.1. By Type
19.3.2. By Position Signals
19.3.3. By Sensing Technology
19.3.4. By Application
19.3.5. By Country
19.3.5.1. China
19.3.5.2. Japan
19.3.5.3. South Korea
19.4. Market Attractiveness Analysis
19.4.1. By Type
19.4.2. By Position Signals
19.4.3. By Sensing Technology
19.4.4. By Application
19.4.5. By Country
19.5. Market Trends
19.6. Key Market Participants - Intensity Mapping
20. Middle East and Africa Encoder Market Analysis 2015-2021 and Forecast 2022-2030
20.1. Introduction
20.2. Historical Market Size (US$ Mn) and Volume (‘000 Units) Trend Analysis By Market Taxonomy, 2015 - 2021
20.3. Market Size (US$ Mn) and Volume (‘000 Units) Forecast By Market Taxonomy, 2022 - 2030
20.3.1. By Type
20.3.2. By Position Signals
20.3.3. By Sensing Technology
20.3.4. By Application
20.3.5. By Country
20.3.5.1. GCC Countries
20.3.5.2. Turkey
20.3.5.3. Northern Africa
20.3.5.4. South Africa
20.3.5.5. Rest of Middle East and Africa
20.4. Market Attractiveness Analysis
20.4.1. By Type
20.4.2. By Position Signals
20.4.3. By Sensing Technology
20.4.4. By Application
20.4.5. By Country
20.5. Market Trends
20.6. Key Market Participants - Intensity Mapping
21. Key and Emerging Countries Analysis- Encoder Market
21.1. U.S. Encoder Market Analysis
21.1.1. By Type
21.1.2. By Position Signals
21.1.3. By Sensing Technology
21.1.4. By Application
21.2. Canada Encoder Market Analysis
21.2.1. By Type
21.2.2. By Position Signals
21.2.3. By Sensing Technology
21.2.4. By Application
21.3. Mexico Encoder Market Analysis
21.3.1. By Type
21.3.2. By Position Signals
21.3.3. By Sensing Technology
21.3.4. By Application
21.4. Brazil Encoder Market Analysis
21.4.1. By Type
21.4.2. By Position Signals
21.4.3. By Sensing Technology
21.4.4. By Application
21.5. Germany Encoder Market Analysis
21.5.1. By Type
21.5.2. By Position Signals
21.5.3. By Sensing Technology
21.5.4. By Application
21.6. Italy Encoder Market Analysis
21.6.1. By Type
21.6.2. By Position Signals
21.6.3. By Sensing Technology
21.6.4. By Application
21.7. France Encoder Market Analysis
21.7.1. By Type
21.7.2. By Position Signals
21.7.3. By Sensing Technology
21.7.4. By Application
21.8. U.K. Encoder Market Analysis
21.8.1. By Type
21.8.2. By Position Signals
21.8.3. By Sensing Technology
21.8.4. By Application
21.9. Spain Encoder Market Analysis
21.9.1. By Type
21.9.2. By Position Signals
21.9.3. By Sensing Technology
21.9.4. By Application
21.10. BENELUX Encoder Market Analysis
21.10.1. By Type
21.10.2. By Position Signals
21.10.3. By Sensing Technology
21.10.4. By Application
21.11. Russia Encoder Market Analysis
21.11.1. By Type
21.11.2. By Position Signals
21.11.3. By Sensing Technology
21.11.4. By Application
21.12. China Encoder Market Analysis
21.12.1. By Type
21.12.2. By Position Signals
21.12.3. By Sensing Technology
21.12.4. By Application
21.13. Japan Encoder Market Analysis
21.13.1. By Type
21.13.2. By Position Signals
21.13.3. By Sensing Technology
21.13.4. By Application
21.14. South Korea Encoder Market Analysis
21.14.1. By Type
21.14.2. By Position Signals
21.14.3. By Sensing Technology
21.14.4. By Application
21.15. India Encoder Market Analysis
21.15.1. By Type
21.15.2. By Position Signals
21.15.3. By Sensing Technology
21.15.4. By Application
21.16. ASEAN Encoder Market Analysis
21.16.1. By Type
21.16.2. By Position Signals
21.16.3. By Sensing Technology
21.16.4. By Application
21.17. Australia and New Zealand Encoder Market Analysis
21.17.1. By Type
21.17.2. By Position Signals
21.17.3. By Sensing Technology
21.17.4. By Application
21.18. GCC Countries Encoder Market Analysis
21.18.1. By Type
21.18.2. By Position Signals
21.18.3. By Sensing Technology
21.18.4. By Application
21.19. Turkey Encoder Market Analysis
21.19.1. By Type
21.19.2. By Position Signals
21.19.3. By Sensing Technology
21.19.4. By Application
21.20. South Africa Encoder Market Analysis
21.20.1. By Type
21.20.2. By Position Signals
21.20.3. By Sensing Technology
21.20.4. By Application
22. Competition Analysis
22.1. Competition Dashboard
22.2. Pricing Analysis by Competitors
22.3. Strategy Analysis, by Competitors
22.4. Competition Deep Dive
22.4.1. OMRON Corporation
22.4.1.1. Business Overview
22.4.1.2. Product Portfolio
22.4.1.3. Profitability by Market Segments (Business Segment/Region)
22.4.1.4. Sales Footprint
22.4.1.5. Strategy Overview
22.4.1.5.1. Marketing Strategy
22.4.1.5.2. Product Strategy
22.4.1.5.3. Channel Strategy
22.4.2. Baumer Electric AG
22.4.2.1. Business Overview
22.4.2.2. Product Portfolio
22.4.2.3. Profitability by Market Segments (Business Segment/Region)
22.4.2.4. Sales Footprint
22.4.2.5. Strategy Overview
22.4.2.5.1. Marketing Strategy
22.4.2.5.2. Product Strategy
22.4.2.5.3. Channel Strategy
22.4.3. Schneider Electric
22.4.3.1. Business Overview
22.4.3.2. Product Portfolio
22.4.3.3. Profitability by Market Segments (Business Segment/Region)
22.4.3.4. Sales Footprint
22.4.3.5. Strategy Overview
22.4.3.5.1. Marketing Strategy
22.4.3.5.2. Product Strategy
22.4.3.5.3. Channel Strategy
22.4.4. Panasonic Corporation
22.4.4.1. Business Overview
22.4.4.2. Product Portfolio
22.4.4.3. Profitability by Market Segments (Business Segment/Region)
22.4.4.4. Sales Footprint
22.4.4.5. Strategy Overview
22.4.4.5.1. Marketing Strategy
22.4.4.5.2. Product Strategy
22.4.4.5.3. Channel Strategy
22.4.5. Renishaw plc
22.4.5.1. Business Overview
22.4.5.2. Product Portfolio
22.4.5.3. Profitability by Market Segments (Business Segment/Region)
22.4.5.4. Sales Footprint
22.4.5.5. Strategy Overview
22.4.5.5.1. Marketing Strategy
22.4.5.5.2. Product Strategy
22.4.5.5.3. Channel Strategy
22.4.6. Honeywell International, Inc.
22.4.6.1. Business Overview
22.4.6.2. Product Portfolio
22.4.6.3. Profitability by Market Segments (Business Segment/Region)
22.4.6.4. Sales Footprint
22.4.6.5. Strategy Overview
22.4.6.5.1. Marketing Strategy
22.4.6.5.2. Product Strategy
22.4.6.5.3. Channel Strategy
22.4.7. Rockwell Automation, Inc.
22.4.7.1. Business Overview
22.4.7.2. Product Portfolio
22.4.7.3. Profitability by Market Segments (Business Segment/Region)
22.4.7.4. Sales Footprint
22.4.7.5. Strategy Overview
22.4.7.5.1. Marketing Strategy
22.4.7.5.2. Product Strategy
22.4.7.5.3. Channel Strategy
22.4.8. Dynapar
22.4.8.1. Business Overview
22.4.8.2. Product Portfolio
22.4.8.3. Profitability by Market Segments (Business Segment/Region)
22.4.8.4. Sales Footprint
22.4.8.5. Strategy Overview
22.4.8.5.1. Marketing Strategy
22.4.8.5.2. Product Strategy
22.4.8.5.3. Channel Strategy
22.4.9. The FRABA Group
22.4.9.1. Business Overview
22.4.9.2. Product Portfolio
22.4.9.3. Profitability by Market Segments (Business Segment/Region)
22.4.9.4. Sales Footprint
22.4.9.5. Strategy Overview
22.4.9.5.1. Marketing Strategy
22.4.9.5.2. Product Strategy
22.4.9.5.3. Channel Strategy
22.4.10. Wachendorff Automation GmbH & Co. KG
22.4.10.1. Business Overview
22.4.10.2. Product Portfolio
22.4.10.3. Profitability by Market Segments (Business Segment/Region)
22.4.10.4. Sales Footprint
22.4.10.5. Strategy Overview
22.4.10.5.1. Marketing Strategy
22.4.10.5.2. Product Strategy
22.4.10.5.3. Channel Strategy
22.4.11. Fenac Engineering
22.4.11.1. Business Overview
22.4.11.2. Product Portfolio
22.4.11.3. Profitability by Market Segments (Business Segment/Region)
22.4.11.4. Sales Footprint
22.4.11.5. Strategy Overview
22.4.11.5.1. Marketing Strategy
22.4.11.5.2. Product Strategy
22.4.11.5.3. Channel Strategy
22.4.12. Heidenhain Corporation
22.4.12.1. Business Overview
22.4.12.2. Product Portfolio
22.4.12.3. Profitability by Market Segments (Business Segment/Region)
22.4.12.4. Sales Footprint
22.4.12.5. Strategy Overview
22.4.12.5.1. Marketing Strategy
22.4.12.5.2. Product Strategy
22.4.12.5.3. Channel Strategy
22.4.13. Mitutoyo Corporation
22.4.13.1. Business Overview
22.4.13.2. Product Portfolio
22.4.13.3. Profitability by Market Segments (Business Segment/Region)
22.4.13.4. Sales Footprint
22.4.13.5. Strategy Overview
22.4.13.5.1. Marketing Strategy
22.4.13.5.2. Product Strategy
22.4.13.5.3. Channel Strategy
22.4.14. TE Connectivity
22.4.14.1. Business Overview
22.4.14.2. Product Portfolio
22.4.14.3. Profitability by Market Segments (Business Segment/Region)
22.4.14.4. Sales Footprint
22.4.14.5. Strategy Overview
22.4.14.5.1. Marketing Strategy
22.4.14.5.2. Product Strategy
22.4.14.5.3. Channel Strategy
22.4.15. BEI Sensors
22.4.15.1. Business Overview
22.4.15.2. Product Portfolio
22.4.15.3. Profitability by Market Segments (Business Segment/Region)
22.4.15.4. Sales Footprint
22.4.15.5. Strategy Overview
22.4.15.5.1. Marketing Strategy
22.4.15.5.2. Product Strategy
22.4.15.5.3. Channel Strategy
23. Assumptions and Acronyms Used
24. Research Methodology
Let us know your requirement to get
100% FREE customization
List of Tables
Table 01: Global Encoder Market Size (US$ Mn) Forecast by Type, 2015–2030
Table 02: Global Encoder Market Volume (‘000 Units) Forecast by Type, 2015–2030
Table 03: Global Encoder Market Size (US$ Mn) Forecast by Position Signals, 2015–2030
Table 04: Global Encoder Market Volume (‘000 Units) Forecast by Position Signals, 2015–2030
Table 05: Global Encoder Market Size (US$ Mn) Forecast by Sensing Technology, 2015–2030
Table 06: Global Encoder Market Volume (‘000 Units) Forecast by Sensing Technology, 2015–2030
Table 07: Global Encoder Market Size (US$ Mn) Forecast by Application, 2015–2030
Table 08: Global Encoder Market Volume (‘000 Units) Forecast by Application, 2015–2030
Table 09: Global Encoder Market Size (US$ Mn) Forecast by Region, 2015–2030
Table 10: Global Encoder Market Volume (‘000 Units) Forecast by Region, 2015–2030
Table 11: North America Encoder Market Size (US$ Mn) Forecast by Type, 2015–2030
Table 12: North America Encoder Market Volume (‘000 Units) Forecast by Type, 2015–2030
Table 13: North America Encoder Market Size (US$ Mn) Forecast by Position Signals, 2015–2030
Table 14: North America Encoder Market Volume (‘000 Units) Forecast by Position Signals, 2015–2030
Table 15: North America Encoder Market Size (US$ Mn) Forecast by Sensing Technology, 2015–2030
Table 16: North America Encoder Market Volume (‘000 Units) Forecast by Sensing Technology, 2015–2030
Table 17: North America Encoder Market Size (US$ Mn) Forecast by Application, 2015–2030
Table 18: North America Encoder Market Volume (‘000 Units) Forecast by Application, 2015–2030
Table 19: North America Encoder Market Size (US$ Mn) Forecast by Country, 2015–2030
Table 20: North America Encoder Market Volume (‘000 Units) Forecast by Country, 2015–2030
Table 21: Latin America Encoder Market Size (US$ Mn) Forecast by Type, 2015–2030
Table 22: Latin America Encoder Market Volume (‘000 Units) Forecast by Type, 2015–2030
Table 23: Latin America Encoder Market Size (US$ Mn) Forecast by Position Signals, 2015–2030
Table 24: Latin America Encoder Market Volume (‘000 Units) Forecast by Position Signals, 2015–2030
Table 25: Latin America Encoder Market Size (US$ Mn) Forecast by Sensing Technology, 2015–2030
Table 26: Latin America Encoder Market Volume (‘000 Units) Forecast by Sensing Technology, 2015–2030
Table 27: Latin America Encoder Market Size (US$ Mn) Forecast by Application, 2015–2030
Table 28: Latin America Encoder Market Volume (‘000 Units) Forecast by Application, 2015–2030
Table 29: Latin America Encoder Market Size (US$ Mn) Forecast by Country, 2015–2030
Table 30: Latin America Encoder Market Volume (‘000 Units) Forecast by Country, 2015–2030
Table 31: Europe Encoder Market Size (US$ Mn) Forecast by Type, 2015–2030
Table 32: Europe Encoder Market Volume (‘000 Units) Forecast by Type, 2015–2030
Table 33: Europe Encoder Market Size (US$ Mn) Forecast by Position Signals, 2015–2030
Table 34: Europe Encoder Market Volume (‘000 Units) Forecast by Position Signals, 2015–2030
Table 35: Europe Encoder Market Size (US$ Mn) Forecast by Sensing Technology, 2015–2030
Table 36: Europe Encoder Market Volume (‘000 Units) Forecast by Sensing Technology, 2015–2030
Table 37: Europe Encoder Market Size (US$ Mn) Forecast by Application, 2015–2030
Table 38: Europe Encoder Market Volume (‘000 Units) Forecast by Application, 2015–2030
Table 39: Europe Encoder Market Size (US$ Mn) Forecast by Country, 2015–2030
Table 40: Europe Encoder Market Volume (‘000 Units) Forecast by Country, 2015–2030
Table 41: South Asia & Pacific Encoder Market Size (US$ Mn) Forecast by Type, 2015–2030
Table 42: South Asia & Pacific Encoder Market Volume (‘000 Units) Forecast by Type, 2015–2030
Table 43: South Asia & Pacific Encoder Market Size (US$ Mn) Forecast by Position Signals, 2015–2030
Table 44: South Asia & Pacific Encoder Market Volume (‘000 Units) Forecast by Position Signals, 2015–2030
Table 45: South Asia & Pacific Encoder Market Size (US$ Mn) Forecast by Sensing Technology, 2015–2030
Table 46: South Asia & Pacific Encoder Market Volume (‘000 Units) Forecast by Sensing Technology, 2015–2030
Table 47: South Asia & Pacific Encoder Market Size (US$ Mn) Forecast by Application, 2015–2030
Table 48: South Asia & Pacific Encoder Market Volume (‘000 Units) Forecast by Application, 2015–2030
Table 49: South Asia & Pacific Encoder Market Size (US$ Mn) Forecast by Country, 2015–2030
Table 50: South Asia & Pacific Encoder Market Volume (‘000 Units) Forecast by Country, 2015–2030
Table 51: East Asia Encoder Market Size (US$ Mn) Forecast by Type, 2015–2030
Table 52: East Asia Encoder Market Volume (‘000 Units) Forecast by Type, 2015–2030
Table 53: East Asia Encoder Market Size (US$ Mn) Forecast by Position Signals, 2015–2030
Table 54: East Asia Encoder Market Volume (‘000 Units) Forecast by Position Signals, 2015–2030
Table 55: East Asia Encoder Market Size (US$ Mn) Forecast by Sensing Technology, 2015–2030
Table 56: East Asia Encoder Market Volume (‘000 Units) Forecast by Sensing Technology, 2015–2030
Table 57: East Asia Encoder Market Size (US$ Mn) Forecast by Application, 2015–2030
Table 58: East Asia Encoder Market Volume (‘000 Units) Forecast by Application, 2015–2030
Table 59: East Asia Encoder Market Size (US$ Mn) Forecast by Country, 2015–2030
Table 60: East Asia Encoder Market Volume (‘000 Units) Forecast by Country, 2015–2030
Table 61: Middle East and Africa Encoder Market Size (US$ Mn) Forecast by Type, 2015–2030
Table 62: Middle East and Africa Encoder Market Volume (‘000 Units) Forecast by Type, 2015–2030
Table 63: Middle East and Africa Encoder Market Size (US$ Mn) Forecast by Position Signals, 2015–2030
Table 64: Middle East and Africa Encoder Market Volume (‘000 Units) Forecast by Position Signals, 2015–2030
Table 65: Middle East and Africa Encoder Market Size (US$ Mn) Forecast by Sensing Technology, 2015–2030
Table 66: Middle East and Africa Encoder Market Volume (‘000 Units) Forecast by Sensing Technology, 2015–2030
Table 67: Middle East and Africa Encoder Market Size (US$ Mn) Forecast by Application, 2015–2030
Table 68: Middle East and Africa Encoder Market Volume (‘000 Units) Forecast by Application, 2015–2030
Table 69: Middle East and Africa Encoder Market Size (US$ Mn) Forecast by Country, 2015–2030
Table 70: Middle East and Africa Encoder Market Volume (‘000 Units) Forecast by Country, 2015–2030
Find your sweet spots for generating winning opportunities in this market.
Talk to AnalystList of Charts
Figure 01: Global Encoder Market Size and Y-o-Y Growth Rate from 2022-2030
Figure 02: Global Encoder Market Absolute $ Opportunity (US$ Mn), 2021 – 2030
Figure 03: Global Encoder Market Value (US$ Mn), 2015-2021
Figure 04: Global Encoder Market Value (US$ Mn) Forecast, 2022-2030
Figure 05: Global Encoder Market Share and BPS Analysis by Type- 2022 & 2030
Figure 06: Global Encoder Market Y-o-Y Growth by Type, 2022-2030
Figure 07: Global Encoder Market: Market Attractiveness by Type
Figure 08: Global Encoder Market Share and BPS Analysis by Position Signals- 2022 & 2030
Figure 09: Global Encoder Market Y-o-Y Growth by Position Signals, 2022-2030
Figure 10: Global Encoder Market: Market Attractiveness by Position Signals
Figure 11: Global Encoder Market Share and BPS Analysis by Sensing Technology- 2022 & 2030
Figure 12: Global Encoder Market Y-o-Y Growth by Sensing Technology, 2022-2030
Figure 13: Global Encoder Market: Market Attractiveness by Sensing Technology
Figure 14: Global Encoder Market Share and BPS Analysis by Application- 2022 & 2030
Figure 15: Global Encoder Market Y-o-Y Growth by Application, 2022-2030
Figure 16: Global Encoder Market: Market Attractiveness by Application
Figure 17: Global Encoder Market Share and BPS Analysis by Region- 2022 & 2030
Figure 18: Global Encoder Market Y-o-Y Growth by Region, 2022-2030
Figure 19: Global Encoder Market: Market Attractiveness by Region
Figure 20: North America Encoder Market Absolute $ Opportunity
Figure 21: Latin America Encoder Market Absolute $ Opportunity
Figure 22: Europe Encoder Market Absolute $ Opportunity
Figure 23: East Asia Encoder Market Absolute $ Opportunity
Figure 24: South Asia & Pacific Encoder Market Absolute $ Opportunity
Figure 25: Middle East & Africa Encoder Market Absolute $ Opportunity
Figure 26: North America Encoder Market Value (US$ Mn), 2015-2021
Figure 27: North America Encoder Market Value (US$ Mn) Forecast, 2022-2030
Figure 28: North America Encoder Market Share and BPS Analysis by Type- 2022 & 2030
Figure 29: North America Encoder Market Y-o-Y Growth by Type, 2022-2030
Figure 30: North America Encoder Market: Market Attractiveness by Type
Figure 31: North America Encoder Market Share and BPS Analysis by Position Signals- 2022 & 2030
Figure 32: North America Encoder Market Y-o-Y Growth by Position Signals, 2022-2030
Figure 33: North America Encoder Market: Market Attractiveness by Position Signals
Figure 34: North America Encoder Market Share and BPS Analysis by Sensing Technology- 2022 & 2030
Figure 35: North America Encoder Market Y-o-Y Growth by Sensing Technology, 2022-2030
Figure 36: North America Encoder Market: Market Attractiveness by Sensing Technology
Figure 37: North America Encoder Market Share and BPS Analysis by Application- 2022 & 2030
Figure 38: North America Encoder Market Y-o-Y Growth by Application, 2022-2030
Figure 39: North America Encoder Market: Market Attractiveness by Application
Figure 40: North America Encoder Market Share and BPS Analysis by Country- 2022 & 2030
Figure 41: North America Encoder Market Y-o-Y Growth by Country, 2022-2030
Figure 42: North America Encoder Market: Market Attractiveness by Country
Figure 43: U.S. Encoder Market Absolute $ Opportunity
Figure 44: Canada Encoder Market Absolute $ Opportunity
Figure 45: Latin America Encoder Market Value (US$ Mn), 2015-2021
Figure 46: Latin America Encoder Market Value (US$ Mn) Forecast, 2022-2030
Figure 47: Latin America Encoder Market Share and BPS Analysis by Type- 2022 & 2030
Figure 48: Latin America Encoder Market Y-o-Y Growth by Type, 2022-2030
Figure 49: Latin America Encoder Market: Market Attractiveness by Type
Figure 50: Latin America Encoder Market Share and BPS Analysis by Position Signals- 2022 & 2030
Figure 51: Latin America Encoder Market Y-o-Y Growth by Position Signals, 2022-2030
Figure 52: Latin America Encoder Market: Market Attractiveness by Position Signals
Figure 53: Latin America Encoder Market Share and BPS Analysis by Sensing Technology- 2022 & 2030
Figure 54: Latin America Encoder Market Y-o-Y Growth by Sensing Technology, 2022-2030
Figure 55: Latin America Encoder Market: Market Attractiveness by Sensing Technology
Figure 56: Latin America Encoder Market Share and BPS Analysis by Application- 2022 & 2030
Figure 57: Latin America Encoder Market Y-o-Y Growth by Application, 2022-2030
Figure 58: Latin America Encoder Market: Market Attractiveness by Application
Figure 59: Latin America Encoder Market Share and BPS Analysis by Country- 2022 & 2030
Figure 60: Latin America Encoder Market Y-o-Y Growth by Country, 2022-2030
Figure 61: Latin America Encoder Market: Market Attractiveness by Country
Figure 62: Brazil Encoder Market Absolute $ Opportunity
Figure 63: Mexico Encoder Market Absolute $ Opportunity
Figure 64: Rest of Latin America Europe Encoder Market Absolute $ Opportunity
Figure 65: Europe Encoder Market Value (US$ Mn), 2015-2021
Figure 66: Europe Encoder Market Value (US$ Mn) Forecast, 2022-2030
Figure 67: Europe Encoder Market Share and BPS Analysis by Type- 2022 & 2030
Figure 68: Europe Encoder Market Y-o-Y Growth by Type, 2022-2030
Figure 69: Europe Encoder Market: Market Attractiveness by Type
Figure 70: Europe Encoder Market Share and BPS Analysis by Position Signals- 2022 & 2030
Figure 71: Europe Encoder Market Y-o-Y Growth by Position Signals, 2022-2030
Figure 72: Europe Encoder Market: Market Attractiveness by Position Signals
Figure 73: Europe Encoder Market Share and BPS Analysis by Sensing Technology- 2022 & 2030
Figure 74: Europe Encoder Market Y-o-Y Growth by Sensing Technology, 2022-2030
Figure 75: Europe Encoder Market: Market Attractiveness by Sensing Technology
Figure 76: Europe Encoder Market Share and BPS Analysis by Application- 2022 & 2030
Figure 77: Europe Encoder Market Y-o-Y Growth by Application, 2022-2030
Figure 78: Europe Encoder Market: Market Attractiveness by Application
Figure 79: Europe Encoder Market Share and BPS Analysis by Country- 2022 & 2030
Figure 80: Europe Encoder Market Y-o-Y Growth by Country, 2022-2030
Figure 81: Europe Encoder Market: Market Attractiveness by Country
Figure 82: Germany Encoder Market Absolute $ Opportunity
Figure 83: Italy Encoder Market Absolute $ Opportunity
Figure 84: France Encoder Market Absolute $ Opportunity
Figure 85: U.K. Encoder Market Absolute $ Opportunity
Figure 86: Spain Encoder Market Absolute $ Opportunity
Figure 87: BENELUX Encoder Market Absolute $ Opportunity
Figure 88: Russia Encoder Market Absolute $ Opportunity
Figure 89: Rest of Europe Encoder Market Absolute $ Opportunity
Figure 90: East Asia Encoder Market Value (US$ Mn), 2015-2021
Figure 91: East Asia Encoder Market Value (US$ Mn) Forecast, 2022-2030
Figure 92: East Asia Encoder Market Share and BPS Analysis by Type- 2022 & 2030
Figure 93: East Asia Encoder Market Y-o-Y Growth by Type, 2022-2030
Figure 94: East Asia Encoder Market: Market Attractiveness by Type
Figure 95: East Asia Encoder Market Share and BPS Analysis by Position Signals- 2022 & 2030
Figure 96: East Asia Encoder Market Y-o-Y Growth by Position Signals, 2022-2030
Figure 97: East Asia Encoder Market: Market Attractiveness by Position Signals
Figure 98: East Asia Encoder Market Share and BPS Analysis by Sensing Technology- 2022 & 2030
Figure 99: East Asia Encoder Market Y-o-Y Growth by Sensing Technology, 2022-2030
Figure 100: East Asia Encoder Market: Market Attractiveness by Sensing Technology
Figure 101: East Asia Encoder Market Share and BPS Analysis by Application- 2022 & 2030
Figure 102: East Asia Encoder Market Y-o-Y Growth by Application, 2022-2030
Figure 103: East Asia Encoder Market: Market Attractiveness by Application
Figure 104: East Asia Encoder Market Share and BPS Analysis by Country- 2022 & 2030
Figure 105: East Asia Encoder Market Y-o-Y Growth by Country, 2022-2030
Figure 106: East Asia Encoder Market: Market Attractiveness by Country
Figure 107: China Encoder Market Absolute $ Opportunity
Figure 108: Japan Encoder Market Absolute $ Opportunity
Figure 109: South Korea Encoder Market Absolute $ Opportunity
Figure 110: South Asia & Pacific Encoder Market Value (US$ Mn), 2015-2021
Figure 111: South Asia & Pacific Encoder Market Value (US$ Mn) Forecast, 2022-2030
Figure 112: South Asia & Pacific Encoder Market Share and BPS Analysis by Type- 2022 & 2030
Figure 113: South Asia & Pacific Encoder Market Y-o-Y Growth by Type, 2022-2030
Figure 114: South Asia & Pacific Encoder Market: Market Attractiveness by Type
Figure 115: South Asia & Pacific Encoder Market Share and BPS Analysis by Position Signals- 2022 & 2030
Figure 116: South Asia & Pacific Encoder Market Y-o-Y Growth by Position Signals, 2022-2030
Figure 117: South Asia & Pacific Encoder Market: Market Attractiveness by Position Signals
Figure 118: South Asia & Pacific Encoder Market Share and BPS Analysis by Sensing Technology- 2022 & 2030
Figure 119: South Asia & Pacific Encoder Market Y-o-Y Growth by Sensing Technology, 2022-2030
Figure 120: South Asia & Pacific Encoder Market: Market Attractiveness by Sensing Technology
Figure 121: South Asia & Pacific Encoder Market Share and BPS Analysis by Application- 2022 & 2030
Figure 122: South Asia & Pacific Encoder Market Y-o-Y Growth by Application, 2022-2030
Figure 123 South Asia & Pacific Encoder Market: Market Attractiveness by Application
Figure 124: South Asia & Pacific Encoder Market Share and BPS Analysis by Country- 2022 & 2030
Figure 125: South Asia & Pacific Encoder Market Y-o-Y Growth by Country, 2022-2030
Figure 126: South Asia & Pacific Encoder Market: Market Attractiveness by Country
Figure 127: India Encoder Market Absolute $ Opportunity
Figure 128: Thailand Encoder Market Absolute $ Opportunity
Figure 129: Indonesia Encoder Market Absolute $ Opportunity
Figure 130: Malaysia Encoder Market Absolute $ Opportunity
Figure 131: Oceania Encoder Market Absolute $ Opportunity
Figure 132: Rest of South Asia & Pacific Encoder Market Absolute $ Opportunity
Figure 133: Middle East & Africa Encoder Market Value (US$ Mn), 2015-2021
Figure 134: Middle East & Africa Encoder Market Value (US$ Mn) Forecast, 2022-2030
Figure 135: Middle East & Africa Encoder Market Share and BPS Analysis by Type- 2022 & 2030
Figure 136: Middle East & Africa Encoder Market Y-o-Y Growth by Type, 2022-2030
Figure 137: Middle East & Africa Encoder Market: Market Attractiveness by Type
Figure 138: Middle East & Africa Encoder Market Share and BPS Analysis by Position Signals- 2022 & 2030
Figure 139: Middle East & Africa Encoder Market Y-o-Y Growth by Position Signals, 2022-2030
Figure 140: Middle East & Africa Encoder Market: Market Attractiveness by Position Signals
Figure 141: Middle East & Africa Encoder Market Share and BPS Analysis by Sensing Technology- 2022 & 2030
Figure 142: Middle East & Africa Encoder Market Y-o-Y Growth by Sensing Technology, 2022-2030
Figure 143: Middle East & Africa Encoder Market: Market Attractiveness by Sensing Technology
Figure 144: Middle East & Africa Encoder Market Share and BPS Analysis by Application- 2022 & 2030
Figure 145: Middle East & Africa Encoder Market Y-o-Y Growth by Application, 2022-2030
Figure 146: Middle East & Africa Encoder Market: Market Attractiveness by Application
Figure 147: Middle East & Africa Encoder Market Share and BPS Analysis by Country- 2022 & 2030
Figure 148: Middle East & Africa Encoder Market Y-o-Y Growth by Country, 2022-2030
Figure 149: Middle East & Africa Encoder Market: Market Attractiveness by Country
Figure 150: GCC Countries Encoder Market Absolute $ Opportunity
Figure 151: Turkey Encoder Market Absolute $ Opportunity
Figure 152: Northern Africa Encoder Market Absolute $ Opportunity
Figure 153: South Africa Encoder Market Absolute $ Opportunity
Figure 154: Rest of Middle East and Africa Encoder Market Absolute $ Opportunity
Need specific information?
Request CustomizationExplore Technology Insights
View Reports