FPSO Market Size and Share Forecast Outlook 2025 to 2035

The global Floating Production Storage and Offloading (FPSO) market is estimated at USD 4.8 billion in 2025 and is projected to reach USD 15.7 billion by 2035, expanding at a strong CAGR of 12.5% over the forecast period. This growth reflects the increasing role of FPSOs as capital-efficient solutions for offshore oilfield development and flexible crude processing in volatile pricing environments.

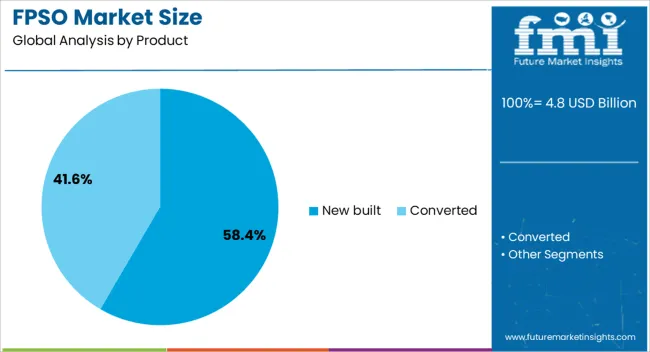
In 2025, new built FPSOs dominate the market with a 58.4% share, driven by large-scale investments in deepwater projects and the replacement of aging floating units. Over the next decade, operators are expected to prioritize redeployable assets and advanced hull designs that extend service lifespans while lowering operating costs.

Regional trends point to sustained demand across North America, Asia-Pacific, and Europe, where energy security policies and rising offshore exploration budgets are reinforcing deployment pipelines. North America is expected to maintain a strong position with continued investment in Gulf of Mexico fields, while Asia-Pacific benefits from offshore projects in Malaysia, China, and Australia. Europe, particularly the North Sea, will continue to see FPSO upgrades and redeployments to optimize marginal field economics.

The market is also shaped by the adoption of digital monitoring technologies, improved storage systems, and innovative leasing models that allow oil companies to mitigate risks and align costs with production cycles. These trends underscore FPSOs as a cornerstone of long-term offshore energy strategies.
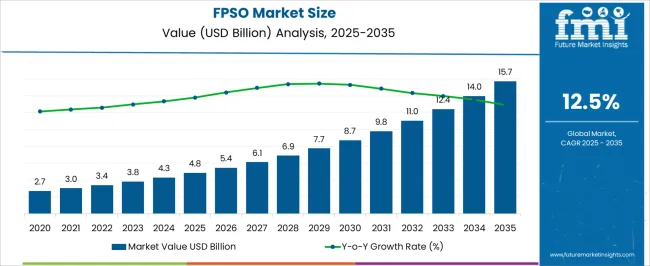
Quick Stats for FPSO Market

  • FPSO Market Value (2025): USD 4.8 billion
  • FPSO Market Forecast Value (2035): USD 15.7 billion
  • FPSO Market Forecast CAGR: 12.5%
  • Leading Segment in FPSO Market in 2025: New built (58.4%)
  • Key Growth Regions in FPSO Market: North America, Asia-Pacific, Europe
  • Top Key Players in FPSO Market: BM Offshore; Bumi Armada Berhad; BW Offshore Limited; CNOOC Limited; DNV; Hanwha Ocean Co., Ltd.; Hyundai Heavy Industries Co., Ltd.; KBR, Inc.; MODEC, Inc.; Petróleo Brasileiro S.A. (Petrobras); Saipem S.p.A.; Shell plc; Samsung Heavy Industries Co., Ltd. (SHI); TechnipFMC plc; Woodside Energy Group Ltd; Yinson Holdings Berhad

Fpso Market Size Market Value Analysis

FPSO Market Key Takeaways

Metric Value
FPSO Market Estimated Value in (2025 E) USD 4.8 billion
FPSO Market Forecast Value in (2035 F) USD 15.7 billion
Forecast CAGR (2025 to 2035) 12.5%

Why is the FPSO Market Growing?

The FPSO market is growing steadily as offshore oil and gas production expands into deeper and more complex water environments. Industry developments have highlighted increased investments in floating production storage and offloading units as they provide flexibility in remote offshore fields.

The demand for new built FPSOs has been stimulated by the need for modern, efficient vessels capable of handling higher processing capacities and complying with evolving environmental regulations. Technological advancements in hull design, processing equipment, and mooring systems have improved the operational reliability of these vessels.

Additionally, the push toward deepwater exploration and production has encouraged the adoption of FPSOs suited for harsher and deeper environments where fixed platforms are less feasible. The market outlook is supported by ongoing offshore developments and the replacement of aging fleets with new built units designed for optimal performance. Segmental growth is expected to be led by new built FPSOs in product category and deepwater applications.

Segmental Analysis

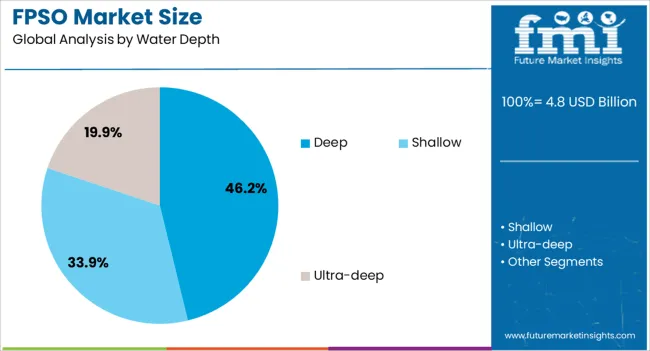
The FPSO market is segmented by product, water depth, and region. By product, it is divided into new-built and converted units, with new-built FPSOs holding a leading share due to rising investments in large-scale offshore projects. In terms of water depth, the market is classified into shallow, deep, and ultra-deep deployments, with deepwater fields currently dominating while ultra-deepwater assets are expected to record faster growth as exploration extends into more complex reserves. Regionally, the market is analyzed across North America, Latin America, Western and Eastern Europe, Balkan & Baltic Countries, Russia & Belarus, Central Asia, East Asia, South Asia & Pacific, and the Middle East & Africa, with Latin America and Asia-Pacific emerging as the most dynamic growth hubs.
Insights into the Product Segment

Fpso Market Size Analysis By Product

The New Built segment is projected to contribute 58.4% of the FPSO market revenue in 2025, maintaining its leadership in product type. Growth in this segment has been driven by the preference for modern vessels that incorporate the latest technology and design improvements.

New built FPSOs offer enhanced processing capabilities, improved safety features, and compliance with stricter environmental standards. Offshore operators favor new builds to optimize production efficiency and extend the operational lifespan of their assets.

The availability of advanced modular designs has also reduced construction timelines and costs, making new built units more attractive. As offshore projects target more challenging fields, the demand for state-of-the-art FPSOs is expected to remain strong.
Insights into the Water Depth Segment

Fpso Market Size Analysis By Water Depth

The Deepwater segment is expected to account for 46.2% of the FPSO market revenue in 2025, holding the largest share among water depth categories. This segment’s growth has been propelled by the exploration and development of oil and gas reserves in deepwater and ultra-deepwater locations.

FPSOs are preferred in these settings due to their flexibility in deployment and ability to operate in waters where traditional fixed platforms are not practical. Deepwater FPSOs are equipped to handle complex processing and storage needs under challenging environmental conditions.

As oil companies continue to shift focus toward deepwater reserves to meet global energy demand, the adoption of FPSOs designed for these depths is expected to increase. The need for reliable production solutions in deepwater fields ensures sustained growth in this segment.

What are the Drivers, Restraints, and Key Trends of the FPSO Market?

FPSO growth is driven by offshore exploration, cost efficiency, collaborative partnerships, and evolving regulations. Their adaptability, redeployable nature, and compliance with international standards make them a cornerstone of modern offshore production strategies.

Rising Offshore Exploration and Production Activity

The FPSO industry has gained traction as offshore exploration expands into deeper waters and remote basins. Oil majors and national companies are increasingly deploying FPSOs due to their ability to combine production, storage, and offloading in one platform. Unlike fixed platforms, FPSOs can be redeployed, offering flexibility in managing shifting exploration priorities. This adaptability makes them particularly valuable in marginal fields and frontier regions where permanent structures would be uneconomical. Growing investments in deepwater projects in Brazil, Guyana, and West Africa are driving demand. The ability to process large volumes of hydrocarbons while reducing shore-based infrastructure requirements highlights FPSOs as a preferred offshore development solution.

Influence of Cost Efficiency and Flexibility

Capital-intensive offshore projects require solutions that maximize returns and limit risk exposure, making FPSOs attractive. They allow producers to avoid laying extensive pipeline networks or constructing fixed installations, significantly lowering upfront costs. Their redeployable nature ensures operators can adjust to changing field economics without leaving assets stranded. This cost-efficient deployment supports field monetization where traditional setups are not feasible. Energy companies are leveraging FPSOs to optimize smaller or short-life reserves, thereby maintaining profitability even in fluctuating oil price environments. The competitive edge of FPSOs lies in striking a balance between investment flexibility and long-term production reliability, enabling widespread industry adoption.

Role of Partnerships and Strategic Collaboration

The FPSO landscape is shaped by alliances among shipbuilders, engineering firms, and oil companies. Collaboration reduces project execution risks, accelerates delivery schedules, and ensures access to specialized expertise in hull conversion and topside integration. Joint ventures often provide operators with shared financial and technical resources, mitigating high development costs. Recent years have seen growing interest in leasing models, where specialized contractors own and operate FPSOs on behalf of producers. This arrangement reduces capital exposure for oil companies and accelerates deployment. Such partnerships not only improve financial feasibility but also drive innovation in vessel design and operational safety standards, strengthening FPSO market resilience.

Impact of Regulations and Safety Standards

Regulatory frameworks play an essential role in FPSO adoption, shaping vessel design, operational processes, and safety features. Offshore projects are subject to strict guidelines to mitigate risks associated with oil spills, emissions, and worker safety. Compliance with evolving international standards has driven upgrades in hull integrity, flare management, and digital monitoring systems. Governments in regions like West Africa and South America have intensified requirements for local content, influencing project timelines and supply chains. While these standards increase initial project complexity, they also enhance long-term reliability and acceptance of FPSOs. Strong regulatory compliance is increasingly seen as a driver of industry reputation and project continuity.
Analysis of FPSO Market By Key Countries

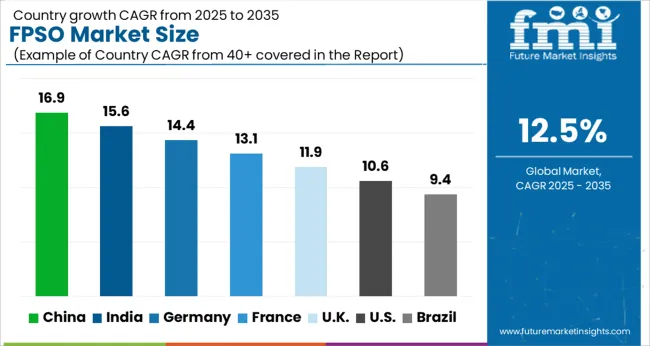
Fpso Market Size Cagr Analysis By Country

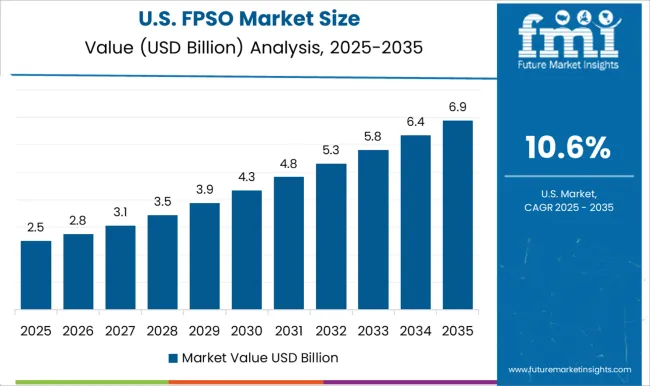
The FPSO market is projected to grow globally at a CAGR of 12.5% between 2025 and 2035, supported by deepwater project sanctions, flexible field development models, and preference for redeployable production assets. China leads with a CAGR of 16.9%, supported by strong hull-conversion capacity, integrated EPC execution, and financing depth that accelerates delivery schedules. India follows at 15.6%, underpinned by offshore redevelopment, east-coast gas projects, and charter-led procurement that favors lease-operate contracts. Germany records 14.4%, driven by topside process packages, compressor systems, and engineering services feeding global build programs. The United Kingdom stands at 11.9%, aided by North Sea life extensions, marginal field tiebacks, and redeployment of units. The United States posts 10.6%, shaped by Gulf of Mexico activity, brownfield debottlenecking, and steady contractor capacity. The analysis covers more than 40 countries, with these five serving as benchmarks for capacity planning, supplier partnerships, and long-horizon investment priorities in the global FPSO industry..

Accelerating Deployment of FPSOs in China

China is projected to achieve a CAGR of 16.9% for 2025–2035, up from about 12.8% during 2020–2024, clearly surpassing the global average of 12.5%. Earlier growth was fueled by hull conversion projects and steady demand from Asian offshore operators. The higher rate ahead is driven by large-scale EPC integration, competitive shipyard capacity, and financing models that attract foreign operators. China’s role as a hub for FPSO conversions and newbuilds continues to expand as Brazilian and West African projects increasingly source vessels from Chinese yards. Government-backed investments in marine engineering and stronger collaborations with oil majors also reinforce momentum.

  • Chinese shipyards expanding FPSO conversion pipelines by 40%.
  • Brazilian and West African contracts driving export share.
  • Government financing programs reducing operator CAPEX burden.

Expanding Role of FPSOs in India

India is forecast to post a CAGR of 15.6% during 2025–2035, up from nearly 11.7% in 2020–2024, signaling a strong acceleration. The earlier phase was supported by selective east-coast gas field developments and deepwater redeployments. The steeper trajectory ahead will be driven by redevelopment of mature offshore fields, leasing models that reduce upfront costs, and greater private participation in offshore exploration. Rising charter contracts from ONGC and partnerships with global FPSO operators are accelerating adoption. Domestic demand for floating LNG-linked units also provides opportunities. India’s positioning as both a consumer and service hub enhances its strategic importance in global FPSO dynamics.
  • ONGC contracts increasing FPSO lease-based operations.
  • Mature field redevelopment driving demand for redeployables.
  • Charter model adoption lowering investment barriers.

Strengthening Engineering Role of FPSOs in Germany

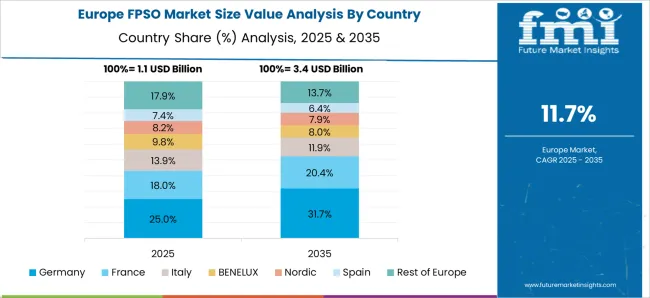
Fpso Market Size Europe Country Market Share Analysis, 2025 & 2035

Germany is projected to post a CAGR of 14.4% for 2025–2035, up from about 10.9% during 2020–2024, highlighting faster growth momentum. Earlier expansion was driven by demand for topside process packages, compressors, and engineering services for international projects. The stronger rate ahead is being fueled by German engineering firms supplying modular processing skids, gas treatment systems, and digital monitoring solutions. Their integration into global FPSO projects in Brazil, Guyana, and West Africa is driving service exports. Germany’s expertise in precision engineering, coupled with emphasis on reliability and quality assurance, continues to reinforce its competitive positioning.

  • Export of modular process skids rising steadily.
  • German compressor systems adopted in Brazil and Guyana.
  • Process automation demand boosting engineering exports.

Redeployment Opportunities for FPSOs in the United Kingdom

The United Kingdom is forecast to post a CAGR of 11.9% during 2025–2035, up from nearly 8.6% between 2020–2024, showing a stronger performance than in the prior phase. Earlier growth was supported by selective North Sea redeployments and marginal field projects. The rise in CAGR is attributed to accelerated life-extension of North Sea assets, redeployment of aging FPSOs to smaller tiebacks, and regulatory frameworks encouraging investment in late-life fields. The UK’s leasing model and expertise in offshore engineering also enhance market prospects. Contractors are increasingly targeting mid-life units for conversion, enabling cost-efficient redeployment across regional basins.
  • Redeployment of mid-life FPSOs expanding in North Sea.
  • Late-life asset investment incentives improving project viability.
  • Charter-led redeployment boosting utilization efficiency.

Growing Utilization of FPSOs in the United States

Fpso Market Size Country Value Analysis

The United States is expected to record a CAGR of 10.6% for 2025–2035, up from about 7.9% in 2020–2024, indicating steady acceleration. Earlier growth was largely driven by brownfield debottlenecking projects and Gulf of Mexico FPSO deployments. The sharper pace ahead is linked to new deepwater oilfield developments, hybrid FPSO solutions with storage flexibility, and extended service life for existing units. Leasing models are gaining traction, allowing operators to deploy FPSOs in smaller fields without long-term CAPEX exposure. USA contractors are also enhancing digital monitoring and subsea tieback integration, reinforcing efficiency in complex deepwater basins.
  • Hybrid FPSO solutions introduced in Gulf of Mexico fields.
  • Subsea tieback integration driving FPSO utilization.
  • Brownfield debottlenecking extending vessel service lives.

Competitive Landscape of FPSO Market

Fpso Market Size Analysis By Company

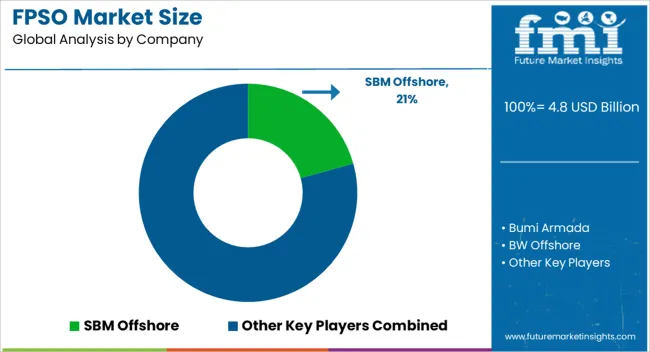
The FPSO market features leading global operators, shipbuilders, engineering contractors, and energy companies such as SBM Offshore, Bumi Armada, BW Offshore, CNOOC, DNV, Hanwha, Hyundai Heavy Industries, KBR, MODEC, Petrobras, Saipem, Shell, SHI-MCI, TechnipFMC, Woodside, and Yinson, each competing through project execution expertise, financial strength, and technological capabilities. SBM Offshore remains a leader with its extensive leased FPSO fleet and modular design strategies.

Bumi Armada focuses on cost-efficient redeployable FPSOs, targeting marginal and mid-sized fields. BW Offshore leverages a strong operational record and a mix of newbuild and redeployed units to maintain market presence. CNOOC is expanding domestic and overseas deepwater operations with state-backed support. DNV plays a critical role in classification, safety certification, and digital assurance for FPSOs. Hanwha and Hyundai Heavy Industries strengthen the supply chain through hull construction and integration capacity.

Scope of the Report

Item Value
Quantitative Units USD Billion
Product New built and Converted
Water Depth Deep, Shallow, and Ultra-deep
Regions Covered North America, Europe, Asia-Pacific, Latin America, Middle East & Africa
Country Covered United States, Canada, Germany, France, United Kingdom, China, Japan, India, Brazil, South Africa
Key Companies Profiled BM Offshore; Bumi Armada Berhad; BW Offshore Limited; CNOOC Limited; DNV; Hanwha Ocean Co., Ltd.; Hyundai Heavy Industries Co., Ltd.; KBR, Inc.; MODEC, Inc.; Petróleo Brasileiro S.A. (Petrobras); Saipem S.p.A.; Shell plc; Samsung Heavy Industries Co., Ltd. (SHI); TechnipFMC plc; Woodside Energy Group Ltd; Yinson Holdings Berhad
Additional Attributes Dollar sales, share, regional deployment trends, contract pipelines, leasing models, operator strategies, shipyard capacity, regulatory frameworks, technology upgrades, competitive positioning, and forecasted CAGR to guide long-term investment and fleet expansion.

FPSO Market by Segments

Product:

  • New built
  • Converted

Water Depth:

  • Deep
  • Shallow
  • Ultra-deep

Region:

  • North America
    • USA
    • Canada
    • Mexico
  • Latin America
    • Brazil
    • Chile
    • Rest of Latin America
  • Western Europe
    • Germany
    • UK
    • Italy
    • Spain
    • France
    • Nordic
    • BENELUX
    • Rest of Western Europe
  • Eastern Europe
    • Russia
    • Poland
    • Hungary
    • Balkan & Baltic
    • Rest of Eastern Europe
  • East Asia
    • China
    • Japan
    • South Korea
  • South Asia and Pacific
    • India
    • ASEAN
    • Australia & New Zealand
    • Rest of South Asia and Pacific
  • Middle East & Africa
    • Kingdom of Saudi Arabia
    • Other GCC Countries
    • Turkiye
    • South Africa
    • Other African Union
    • Rest of Middle East & Africa

Table of Content

  1. Executive Summary
    • Global Market Outlook
    • Demand-side Trends
    • Supply-side Trends
    • Technology Roadmap Analysis
    • Analysis and Recommendations
  2. Market Overview
    • Market Coverage / Taxonomy
    • Market Definition / Scope / Limitations
  3. Market Background
    • Market Dynamics
      • Drivers
      • Restraints
      • Opportunity
      • Trends
    • Scenario Forecast
      • Demand in Optimistic Scenario
      • Demand in Likely Scenario
      • Demand in Conservative Scenario
    • Opportunity Map Analysis
    • Product Life Cycle Analysis
    • Supply Chain Analysis
    • Investment Feasibility Matrix
    • Value Chain Analysis
    • PESTLE and Porter’s Analysis
    • Regulatory Landscape
    • Regional Parent Market Outlook
    • Production and Consumption Statistics
    • Import and Export Statistics
  4. Global FPSO Market Analysis 2020-2024 and Forecast, 2025-2035
    • Historical Market Size Value (USD Mn) Analysis, 2020-2024
    • Current and Future Market Size Value (USD Mn) Projections, 2025-2035
      • Y-o-Y Growth Trend Analysis
      • Absolute $ Opportunity Analysis
  5. Global FPSO Market Pricing Analysis 2020-2024 and Forecast 2025-2035
  6. Global FPSO Market Analysis 2020-2024 and Forecast 2025-2035, By Product
    • Introduction / Key Findings
    • Historical Market Size Value (USD Mn) Analysis By Product , 2020-2024
    • Current and Future Market Size Value (USD Mn) Analysis and Forecast By Product , 2025-2035
      • New built
      • Converted
    • Y-o-Y Growth Trend Analysis By Product , 2020-2024
    • Absolute $ Opportunity Analysis By Product , 2025-2035
  7. Global FPSO Market Analysis 2020-2024 and Forecast 2025-2035, By Water Depth
    • Introduction / Key Findings
    • Historical Market Size Value (USD Mn) Analysis By Water Depth, 2020-2024
    • Current and Future Market Size Value (USD Mn) Analysis and Forecast By Water Depth, 2025-2035
      • Deep
      • Shallow
      • Ultra-deep
    • Y-o-Y Growth Trend Analysis By Water Depth, 2020-2024
    • Absolute $ Opportunity Analysis By Water Depth, 2025-2035
  8. Global FPSO Market Analysis 2020-2024 and Forecast 2025-2035, By Region
    • Introduction
    • Historical Market Size Value (USD Mn) Analysis By Region, 2020-2024
    • Current Market Size Value (USD Mn) Analysis and Forecast By Region, 2025-2035
      • North America
      • Latin America
      • Western Europe
      • Eastern Europe
      • East Asia
      • South Asia and Pacific
      • Middle East & Africa
    • Market Attractiveness Analysis By Region
  9. North America FPSO Market Analysis 2020-2024 and Forecast 2025-2035, By Country
    • Historical Market Size Value (USD Mn) Trend Analysis By Market Taxonomy, 2020-2024
    • Market Size Value (USD Mn) Forecast By Market Taxonomy, 2025-2035
      • By Country
        • US
        • Canada
        • Mexico
      • By Product
      • By Water Depth
    • Market Attractiveness Analysis
      • By Country
      • By Product
      • By Water Depth
    • Key Takeaways
  10. Latin America FPSO Market Analysis 2020-2024 and Forecast 2025-2035, By Country
    • Historical Market Size Value (USD Mn) Trend Analysis By Market Taxonomy, 2020-2024
    • Market Size Value (USD Mn) Forecast By Market Taxonomy, 2025-2035
      • By Country
        • Brazil
        • Chile
        • Rest of Latin America
      • By Product
      • By Water Depth
    • Market Attractiveness Analysis
      • By Country
      • By Product
      • By Water Depth
    • Key Takeaways
  11. Western Europe FPSO Market Analysis 2020-2024 and Forecast 2025-2035, By Country
    • Historical Market Size Value (USD Mn) Trend Analysis By Market Taxonomy, 2020-2024
    • Market Size Value (USD Mn) Forecast By Market Taxonomy, 2025-2035
      • By Country
        • Germany
        • UK
        • Italy
        • Spain
        • France
        • Nordic
        • BENELUX
        • Rest of Western Europe
      • By Product
      • By Water Depth
    • Market Attractiveness Analysis
      • By Country
      • By Product
      • By Water Depth
    • Key Takeaways
  12. Eastern Europe FPSO Market Analysis 2020-2024 and Forecast 2025-2035, By Country
    • Historical Market Size Value (USD Mn) Trend Analysis By Market Taxonomy, 2020-2024
    • Market Size Value (USD Mn) Forecast By Market Taxonomy, 2025-2035
      • By Country
        • Russia
        • Poland
        • Hungary
        • Balkan & Baltic
        • Rest of Eastern Europe
      • By Product
      • By Water Depth
    • Market Attractiveness Analysis
      • By Country
      • By Product
      • By Water Depth
    • Key Takeaways
  13. East Asia FPSO Market Analysis 2020-2024 and Forecast 2025-2035, By Country
    • Historical Market Size Value (USD Mn) Trend Analysis By Market Taxonomy, 2020-2024
    • Market Size Value (USD Mn) Forecast By Market Taxonomy, 2025-2035
      • By Country
        • China
        • Japan
        • South Korea
      • By Product
      • By Water Depth
    • Market Attractiveness Analysis
      • By Country
      • By Product
      • By Water Depth
    • Key Takeaways
  14. South Asia and Pacific FPSO Market Analysis 2020-2024 and Forecast 2025-2035, By Country
    • Historical Market Size Value (USD Mn) Trend Analysis By Market Taxonomy, 2020-2024
    • Market Size Value (USD Mn) Forecast By Market Taxonomy, 2025-2035
      • By Country
        • India
        • ASEAN
        • Australia & New Zealand
        • Rest of South Asia and Pacific
      • By Product
      • By Water Depth
    • Market Attractiveness Analysis
      • By Country
      • By Product
      • By Water Depth
    • Key Takeaways
  15. Middle East & Africa FPSO Market Analysis 2020-2024 and Forecast 2025-2035, By Country
    • Historical Market Size Value (USD Mn) Trend Analysis By Market Taxonomy, 2020-2024
    • Market Size Value (USD Mn) Forecast By Market Taxonomy, 2025-2035
      • By Country
        • Kingdom of Saudi Arabia
        • Other GCC Countries
        • Turkiye
        • South Africa
        • Other African Union
        • Rest of Middle East & Africa
      • By Product
      • By Water Depth
    • Market Attractiveness Analysis
      • By Country
      • By Product
      • By Water Depth
    • Key Takeaways
  16. Key Countries FPSO Market Analysis
    • USA
      • Pricing Analysis
      • Market Share Analysis, 2024
        • By Product
        • By Water Depth
    • Canada
      • Pricing Analysis
      • Market Share Analysis, 2024
        • By Product
        • By Water Depth
    • Mexico
      • Pricing Analysis
      • Market Share Analysis, 2024
        • By Product
        • By Water Depth
    • Brazil
      • Pricing Analysis
      • Market Share Analysis, 2024
        • By Product
        • By Water Depth
    • Chile
      • Pricing Analysis
      • Market Share Analysis, 2024
        • By Product
        • By Water Depth
    • Germany
      • Pricing Analysis
      • Market Share Analysis, 2024
        • By Product
        • By Water Depth
    • UK
      • Pricing Analysis
      • Market Share Analysis, 2024
        • By Product
        • By Water Depth
    • Italy
      • Pricing Analysis
      • Market Share Analysis, 2024
        • By Product
        • By Water Depth
    • Spain
      • Pricing Analysis
      • Market Share Analysis, 2024
        • By Product
        • By Water Depth
    • France
      • Pricing Analysis
      • Market Share Analysis, 2024
        • By Product
        • By Water Depth
    • India
      • Pricing Analysis
      • Market Share Analysis, 2024
        • By Product
        • By Water Depth
    • ASEAN
      • Pricing Analysis
      • Market Share Analysis, 2024
        • By Product
        • By Water Depth
    • Australia & New Zealand
      • Pricing Analysis
      • Market Share Analysis, 2024
        • By Product
        • By Water Depth
    • China
      • Pricing Analysis
      • Market Share Analysis, 2024
        • By Product
        • By Water Depth
    • Japan
      • Pricing Analysis
      • Market Share Analysis, 2024
        • By Product
        • By Water Depth
    • South Korea
      • Pricing Analysis
      • Market Share Analysis, 2024
        • By Product
        • By Water Depth
    • Russia
      • Pricing Analysis
      • Market Share Analysis, 2024
        • By Product
        • By Water Depth
    • Poland
      • Pricing Analysis
      • Market Share Analysis, 2024
        • By Product
        • By Water Depth
    • Hungary
      • Pricing Analysis
      • Market Share Analysis, 2024
        • By Product
        • By Water Depth
    • Kingdom of Saudi Arabia
      • Pricing Analysis
      • Market Share Analysis, 2024
        • By Product
        • By Water Depth
    • Turkiye
      • Pricing Analysis
      • Market Share Analysis, 2024
        • By Product
        • By Water Depth
    • South Africa
      • Pricing Analysis
      • Market Share Analysis, 2024
        • By Product
        • By Water Depth
  17. Market Structure Analysis
    • Competition Dashboard
    • Competition Benchmarking
    • Market Share Analysis of Top Players
      • By Regional
      • By Product
      • By Water Depth
  18. Competition Analysis
    • Competition Deep Dive
      • SBM Offshore
        • Overview
        • Product Portfolio
        • Profitability by Market Segments (Product/Age /Sales Channel/Region)
        • Sales Footprint
        • Strategy Overview
          • Marketing Strategy
          • Product Strategy
          • Channel Strategy
      • Bumi Armada
      • BW Offshore
      • CNOOC
      • DNV
      • Hanwha
      • Hyundai Heavy Industries
      • KBR
      • MODEC
      • Petrobras
      • Saipem
      • Shell
      • SHI-MCI
      • TechnipFMC
      • Woodside
      • Yinson
  19. Assumptions & Acronyms Used
  20. Research Methodology

List of Tables

  • Table 1: Global FPSO Market Value (USD Mn) Forecast by Region, 2020-2035
  • Table 2: Global FPSO Market Value (USD Mn) Forecast by Product , 2020-2035
  • Table 3: Global FPSO Market Value (USD Mn) Forecast by Water Depth, 2020-2035
  • Table 4: North America FPSO Market Value (USD Mn) Forecast by Country, 2020-2035
  • Table 5: North America FPSO Market Value (USD Mn) Forecast by Product , 2020-2035
  • Table 6: North America FPSO Market Value (USD Mn) Forecast by Water Depth, 2020-2035
  • Table 7: Latin America FPSO Market Value (USD Mn) Forecast by Country, 2020-2035
  • Table 8: Latin America FPSO Market Value (USD Mn) Forecast by Product , 2020-2035
  • Table 9: Latin America FPSO Market Value (USD Mn) Forecast by Water Depth, 2020-2035
  • Table 10: Western Europe FPSO Market Value (USD Mn) Forecast by Country, 2020-2035
  • Table 11: Western Europe FPSO Market Value (USD Mn) Forecast by Product , 2020-2035
  • Table 12: Western Europe FPSO Market Value (USD Mn) Forecast by Water Depth, 2020-2035
  • Table 13: Eastern Europe FPSO Market Value (USD Mn) Forecast by Country, 2020-2035
  • Table 14: Eastern Europe FPSO Market Value (USD Mn) Forecast by Product , 2020-2035
  • Table 15: Eastern Europe FPSO Market Value (USD Mn) Forecast by Water Depth, 2020-2035
  • Table 16: East Asia FPSO Market Value (USD Mn) Forecast by Country, 2020-2035
  • Table 17: East Asia FPSO Market Value (USD Mn) Forecast by Product , 2020-2035
  • Table 18: East Asia FPSO Market Value (USD Mn) Forecast by Water Depth, 2020-2035
  • Table 19: South Asia and Pacific FPSO Market Value (USD Mn) Forecast by Country, 2020-2035
  • Table 20: South Asia and Pacific FPSO Market Value (USD Mn) Forecast by Product , 2020-2035
  • Table 21: South Asia and Pacific FPSO Market Value (USD Mn) Forecast by Water Depth, 2020-2035
  • Table 22: Middle East & Africa FPSO Market Value (USD Mn) Forecast by Country, 2020-2035
  • Table 23: Middle East & Africa FPSO Market Value (USD Mn) Forecast by Product , 2020-2035
  • Table 24: Middle East & Africa FPSO Market Value (USD Mn) Forecast by Water Depth, 2020-2035

List of Figures

  • Figure 1: Global FPSO Market Pricing Analysis
  • Figure 2: Global FPSO Market Value (USD Mn) Forecast 2020–2035
  • Figure 3: Global FPSO Market Value (USD Mn) Share and BPS Analysis by Region, 2025 and 2035
  • Figure 4: Global FPSO Market Y-o-Y Growth Comparison by Region, 2025–2035
  • Figure 5: Global FPSO Market Attractiveness Analysis by Region
  • Figure 6: North America FPSO Market Incremental Dollar Opportunity, 2025–2035
  • Figure 7: Latin America FPSO Market Incremental Dollar Opportunity, 2025–2035
  • Figure 8: Western Europe FPSO Market Incremental Dollar Opportunity, 2025–2035
  • Figure 9: Eastern Europe FPSO Market Incremental Dollar Opportunity, 2025–2035
  • Figure 10: East Asia FPSO Market Incremental Dollar Opportunity, 2025–2035
  • Figure 11: South Asia and Pacific FPSO Market Incremental Dollar Opportunity, 2025–2035
  • Figure 12: Middle East & Africa FPSO Market Incremental Dollar Opportunity, 2025–2035
  • Figure 13: North America FPSO Market Value Share and BPS Analysis by Country, 2025 and 2035
  • Figure 14: Latin America FPSO Market Value Share and BPS Analysis by Country, 2025 and 2035
  • Figure 15: Western Europe FPSO Market Value Share and BPS Analysis by Country, 2025 and 2035
  • Figure 16: Eastern Europe FPSO Market Value Share and BPS Analysis by Country, 2025 and 2035
  • Figure 17: East Asia FPSO Market Value Share and BPS Analysis by Country, 2025 and 2035
  • Figure 18: South Asia and Pacific FPSO Market Value Share and BPS Analysis by Country, 2025 and 2035
  • Figure 19: Middle East & Africa FPSO Market Value Share and BPS Analysis by Country, 2025 and 2035
  • Figure 20: Global FPSO Market – Tier Structure Analysis
  • Figure 21: Global FPSO Market – Company Share Analysis
Future Market Insights

FPSO Market