Fructose Market Forecast and Outlook 2025 to 2035

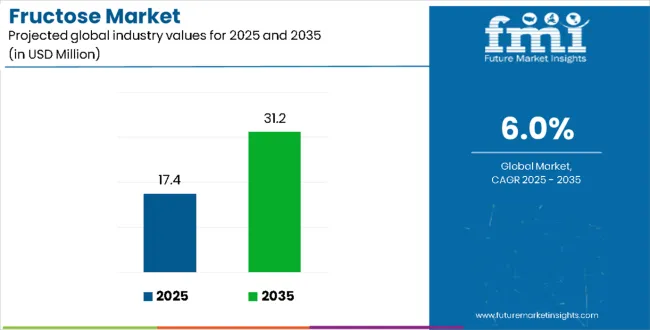
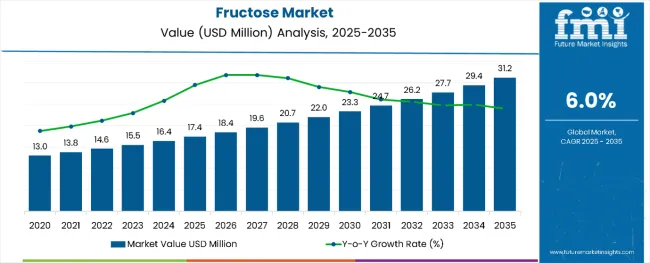
The global fructose market, valued at USD 17.4 billion in 2025, is expected to reach USD 31.2 billion by 2035, representing an absolute increase of USD 13.9 billion and a CAGR of about 6.0%.This translates into a total growth of 79.9%, with the market forecast to expand at a compound annual growth rate (CAGR) of 6.0% between 2025 and 2035. The overall market size is expected to grow by nearly 1.8X during the same period, supported by increasing demand for natural sweeteners and growing applications in food and beverage industries.
Fructose Market

Quick Stats for Fructose Market

  • Fructose Market Value (2025): USD 17.4 billion
  • Fructose Market Forecast Value (2035): USD 31.2 billion
  • Fructose Market Forecast CAGR: 6.0%
  • Leading Source in Fructose Market: Corn (60%)
  • Key Growth Regions in Fructose Market: Asia Pacific, North America, and Europe
  • Top Players in Fructose Market: Archer Daniels Midland Company (ADM), Cargill Incorporated, Tate & Lyle PLC, Ingredion Incorporated, DuPont de Nemours Inc.

Fructose Market 1

Fructose Market Key Takeaways

Metric Value
Fructose Market (2025) USD 17.4 Billion
Fructose Market (2035) USD 31.2 Billion
CAGR (2025 to 2035) 6.0%

Between 2025 and 2030, the fructose market is projected to expand from USD 17.4 billion to USD 23.2 billion, resulting in a value increase of USD 5.8 billion, which represents 41.7% of the total forecast growth for the decade. This phase of growth will be shaped by rising demand for natural sweetening alternatives in processed foods, increasing consumer preference for low-glycemic index sweeteners, and growing applications in pharmaceutical and nutraceutical formulations. Manufacturers are expanding their production capabilities to address the growing demand for high-quality fructose products across various industrial applications.

From 2030 to 2035, the market is forecast to grow from USD 23.2 billion to USD 31.2 billion, adding another USD 8.1 billion, which constitutes 58.3% of the overall ten-year expansion. This period is expected to be characterized by expansion of fructose applications in functional foods, integration of advanced processing technologies, and development of specialized fructose formulations for specific dietary requirements. The growing adoption of clean-label ingredients and natural sweetening solutions will drive demand for more sophisticated processing methods and specialized product variants.

Between 2020 and 2025, the fructose market experienced steady expansion, driven by increasing health consciousness among consumers and growing awareness of natural sweetening alternatives. The market developed as food and beverage manufacturers recognized the functional benefits of fructose in product formulations. Healthcare professionals and nutritionists began emphasizing the importance of alternative sweeteners for diabetic and health-conscious consumers seeking better sugar substitutes.

Why is the Fructose Market Growing?

Market expansion is being supported by the increasing consumer demand for natural sweetening alternatives and the corresponding need for low-glycemic index sweeteners in food formulation and beverage applications. Modern food processing systems rely on fructose for maintaining product quality while providing enhanced sweetness levels without compromising taste profiles. Even minor formulation changes require comprehensive testing and validation to maintain optimal product performance and consumer acceptance.

The growing awareness of health implications associated with traditional sugar consumption and increasing regulatory focus on sugar reduction are driving demand for high-quality fructose products from certified suppliers with appropriate processing methods and expertise. Food manufacturers are increasingly incorporating fructose into product formulations following clinical evidence demonstrating metabolic advantages. Quality standards and food safety regulations are establishing standardized processing procedures that require specialized equipment and trained technicians.

Segmental Analysis

The market segments include source, product type, application, and region. The source segment covers sugarcane, sugar beet, corn, and others such as (fruits, agave, tapioca & cassava, and sweet potatoes & Jerusalem artichoke). The product type segment includes high corn syrup, high corn syrup 42, high corn syrup 55, high corn syrup 65, high corn syrup 90, syrups, and solids. The application segment comprises sports applications, dairy-based products, ice cream, milkshake, frozen desserts, yoghurt, beverages, non-alcoholic drinks, alcoholic drinks, baked goods, biscuits & cookies, cake, muffins and pastries, bread, other baked goods, cosmetics & personal care, medicinal syrups and baby foods, and others such as (sauces & condiments, canned fruits & preserves, breakfast cereals & granola, nutritional supplements, and pet food & animal nutrition). The regional segment includes North America, Latin America, Europe, East Asia, South Asia, Oceania, and the Middle East & Africa.
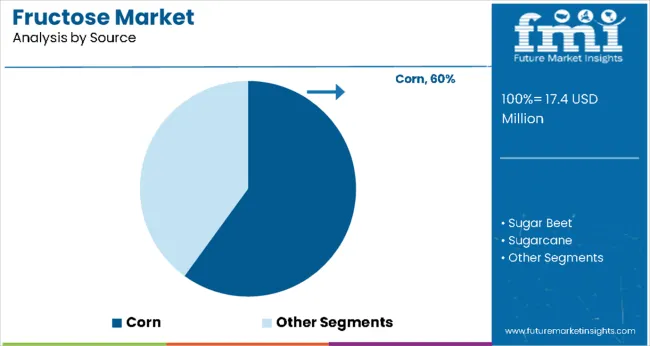
By Source, Corn Segment Accounts for 60% Market Share

Fructose Market By Source

The corn segment is projected to account for 60% of the fructose market in 2025. This leading share is supported by the widespread availability of corn as a raw material and established processing infrastructure for corn-based fructose production across major agricultural regions. Corn-derived fructose provides consistent quality and cost-effectiveness, making it the preferred source for most commercial applications in food manufacturing and beverage production. The segment benefits from established supply chains and comprehensive processing capabilities from multiple suppliers, ensuring reliable raw material procurement and consistent product specifications.

Agricultural advantages including high corn yield potential, advanced farming techniques, and favorable growing conditions contribute to stable pricing and supply security for fructose manufacturers. Processing facilities equipped with specialized enzymatic conversion systems enable efficient transformation of corn starch into high-quality fructose products. The corn segment also benefits from government agricultural policies supporting corn production and trade frameworks facilitating international corn commodity markets. Environmental sustainability initiatives and crop rotation practices further enhance the long-term viability of corn-based fructose production across global markets.
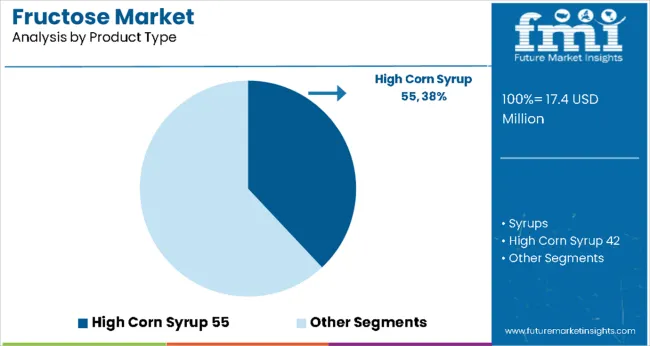
By Product Type, High Corn Syrup 55 Segment Accounts for 38% Market Share

Fructose Market By Product Type

High corn syrup 55 is expected to represent 38% of fructose market demand in 2025. This dominant share reflects the optimal sweetness profile and functional characteristics of this product variant in food and beverage applications across diverse commercial formulations. High corn syrup 55 provides ideal sweetness levels and processing stability for various applications including soft drinks, baked goods, processed foods, and confectionery products. The segment benefits from established manufacturing processes and growing adoption across multiple industry verticals requiring consistent sweetening performance and functional reliability.

The 55% fructose content delivers superior taste characteristics compared to traditional sucrose while maintaining cost advantages over pure fructose alternatives. Food manufacturers prefer this formulation for its excellent solubility properties, extended shelf stability, and compatibility with existing production systems. Processing advantages include reduced crystallization risk, enhanced moisture retention in baked products, and improved fermentation characteristics in beverage applications. The segment also benefits from regulatory approvals across major markets and established quality standards that ensure consistent performance in large-scale commercial food production operations.

What are the Drivers, Restraints, and Key Trends of the Fructose Market?

The fructose market is advancing steadily due to increasing health consciousness and growing recognition of natural sweetener importance. However, the market faces challenges including fluctuating raw material costs, regulatory concerns regarding high-fructose corn syrup consumption, and varying quality standards across different regions. Health awareness campaigns and nutritional labeling requirements continue to influence consumer preferences and market development patterns.

Expansion of Health-Conscious Food Formulations

The growing deployment of fructose in health-focused food formulations is enabling development of products targeting diabetic consumers, weight management applications, and functional food categories. Advanced formulations incorporating natural fructose provide controlled sweetness levels while reducing overall sugar content in processed foods. These applications are particularly valuable for food manufacturers seeking clean-label ingredients and consumers focusing on dietary restriction compliance.

Integration of Advanced Processing and Purification Technologies

Modern fructose producers are incorporating advanced processing technologies and automated purification systems that improve product purity and reduce processing costs. Integration of enzyme technology and continuous processing systems enables more efficient fructose extraction and comprehensive quality control. Advanced processing equipment also supports production of specialized fructose variants including crystalline fructose and high-purity liquid formulations for pharmaceutical applications.
Analysis of Fructose Market by Key Country

Country Wise Fructose Market

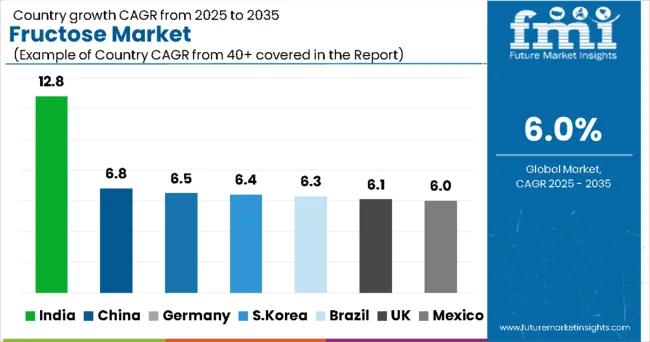
Countries CAGR (2025 to 2035)
India 12.8%
China 6.8%
Germany 6.5%
South Korea 6.4%
Brazil 6.3%
United Kingdom 6.1%
Mexico 6.0%

The fructose market is growing rapidly across key regions, with India leading at a 12.8% CAGR through 2035, driven by expanding food processing industry, growing consumer awareness of alternative sweeteners, and increasing demand for functional food ingredients. China follows at 6.8%, supported by massive food manufacturing sector and government initiatives promoting healthier food formulations. Germany records 6.5% growth, emphasizing quality standards, advanced processing technologies, and export market development. South Korea shows 6.4% expansion, focusing on innovative food applications and health-conscious consumer trends. Brazil demonstrates 6.3% growth through expanding beverage industry and increasing adoption of natural sweetening solutions, while the United Kingdom and Mexico both achieve 6.0% growth with emphasis on sugar reduction initiatives and processed food manufacturing expansion.

The report covers an in-depth analysis of 40+ countries; seven top-performing countries are highlighted below.

India Leads Global Market Growth with Food Industry Expansion

Revenue from fructose in India is projected to exhibit the highest growth rate with a CAGR of 12.8% through 2035, driven by rapid expansion of the food processing industry and increasing consumer awareness of alternative sweetening solutions. The country's growing middle-class population and rising disposable income are creating significant demand for processed foods and beverages containing natural sweeteners. Major food manufacturers and beverage companies are establishing comprehensive supply chains to support the growing population seeking healthier food alternatives across urban and rural markets.

  • Government food processing initiatives are promoting adoption of advanced sweetening technologies and natural ingredient applications, driving demand for certified fructose suppliers throughout major food manufacturing regions.
  • Food industry modernization programs are supporting establishment of quality-controlled processing facilities and research capabilities that enhance product development and application expertise across manufacturing networks.

China Demonstrates Strong Market Potential with Manufacturing Sector Growth

Revenue from fructose in China is expanding at a CAGR of 6.8%, supported by the country's massive food manufacturing sector and increasing integration of health-focused ingredients in processed food formulations. The expanding beverage industry and growing consumer preference for natural sweetening alternatives are driving demand for high-quality fructose products. Domestic manufacturers and international companies are gradually establishing production capabilities to serve the growing population seeking functional food and beverage options.

  • Food manufacturing sector expansion and health-conscious consumer trends are creating opportunities for specialized fructose suppliers that can support diverse application requirements and quality standards.
  • Professional research and development programs are advancing technical expertise among food manufacturers, enabling comprehensive fructose applications that meet international quality standards and consumer preference requirements nationwide.

Germany Maintains Strong Growth with Advanced Processing Capabilities

Revenue from fructose in Germany is growing at a CAGR of 6.5%, driven by the country's advanced food processing infrastructure and growing emphasis on natural ingredient applications in food manufacturing. German food companies are gradually integrating fructose into various product formulations while maintaining strict quality control standards. Food manufacturers and ingredient suppliers are investing in fructose processing technologies and product development to address growing market demand for alternative sweetening solutions.

  • Food processing industry investments are facilitating adoption of advanced fructose processing technologies that support comprehensive applications across major food manufacturing and export regions.
  • Professional quality assurance and certification programs are enhancing manufacturing capabilities among food companies, enabling specialized fructose applications that meet evolving consumer requirements and regulatory standards.

South Korea Focuses on Innovation and Health-Conscious Applications

Demand for fructose in South Korea is projected to grow at a CAGR of 6.4%, supported by the country's emphasis on food innovation and growing consumer focus on health-conscious dietary choices. Korean food manufacturers and beverage companies are implementing comprehensive fructose applications that meet consumer preferences for functional ingredients and natural sweetening alternatives. The market is characterized by focus on product innovation, advanced formulation technologies, and compliance with comprehensive food safety regulations.

  • Food industry innovation investments are prioritizing advanced fructose applications and processing technologies that demonstrate superior functionality and consumer acceptance while meeting Korean food quality standards.
  • Professional research programs are ensuring comprehensive technical validation among food manufacturers, enabling specialized fructose applications that support diverse consumer requirements and regulatory compliance.

Brazil Emphasizes Beverage Industry Growth and Natural Ingredients

Demand for fructose in Brazil is expanding at a CAGR of 6.3%, driven by the country's expanding beverage industry and growing consumer preference for natural sweetening alternatives in processed foods. Brazilian food manufacturers and beverage companies are establishing comprehensive fructose applications to serve diverse consumer needs. The market benefits from agricultural raw material availability and increasing regulatory support for natural ingredient applications in food formulations.

  • Beverage industry consolidation is enabling standardized fructose applications across multiple product categories, providing consistent quality and comprehensive coverage throughout regional markets.
  • Professional formulation and quality programs are developing specialized technical expertise among food manufacturers, enabling comprehensive fructose capabilities that support evolving consumer preferences.

United Kingdom Emphasizes Sugar Reduction and Health Initiatives

Demand for fructose in the United Kingdom is projected to grow at a CAGR of 6.1%, driven by government sugar reduction initiatives and increasing consumer awareness of alternative sweetening solutions. British food manufacturers are implementing comprehensive fructose applications that support sugar reduction targets while maintaining product quality and consumer acceptance. The market benefits from regulatory clarity and consumer preference for natural ingredient alternatives following health awareness campaigns.

  • Food industry compliance investments are prioritizing fructose applications that support sugar reduction mandates while maintaining product functionality and consumer satisfaction throughout retail markets.
  • Professional formulation programs are ensuring comprehensive technical expertise among food manufacturers, enabling specialized fructose applications that support evolving regulatory requirements and health-conscious consumer trends.

Mexico Demonstrates Steady Growth with Processed Food Manufacturing

Revenue from fructose in Mexico is expanding at a CAGR of 6.0%, supported by the country's growing processed food manufacturing sector and increasing adoption of alternative sweetening solutions in beverage applications. Mexican food companies and beverage manufacturers are establishing comprehensive fructose processing capabilities to serve domestic and export markets. The market is characterized by focus on cost-effective formulations, quality consistency, and compliance with international food safety standards.
  • Food manufacturing industry development programs are supporting establishment of fructose processing facilities that demonstrate consistent quality control and production efficiency standards.
  • Professional technical training programs are enhancing manufacturing capabilities among food companies, enabling specialized fructose applications that meet international quality requirements and consumer preferences.

Europe Market Split by Country

Europe Fructose Market By Country

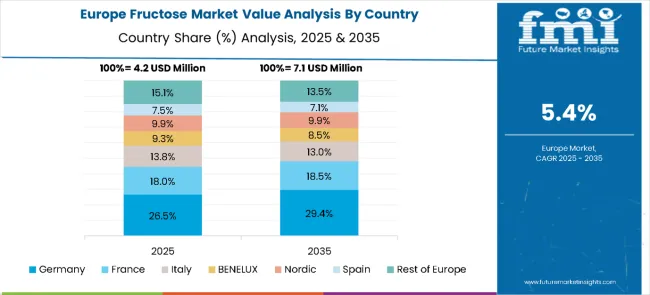
The fructose market in Europe is projected to grow from USD 4.2 million in 2025 to USD 7.1 million by 2035, registering a CAGR of 5.4% over the forecast period. Germany is expected to lead with a 26.5% share in 2025, followed by France at 18.0%, supported by strong demand in food and beverage applications. Italy accounts for 13.8% of the market, while BENELUX represents 9.3% and the Nordic countries hold 9.9%. Spain contributes 7.5%, and the Rest of Europe collectively makes up 15.1%. By 2035, Germany will further expand its leadership to 29.4%, France will reach 18.5%, and Italy will hold 13.0%. BENELUX and the Nordic region are projected at 8.5% and 9.9%, respectively, while Spain will decline slightly to 7.1%, and the Rest of Europe will adjust to 13.5%, signaling a stronger consolidation of demand in Europe’s largest food and beverage processing hubs.
Competitive Landscape of Fructose Market

Fructose Market By Company

The fructose market is defined by competition among major agricultural processing companies, specialized sweetener manufacturers, and integrated food ingredient suppliers. Companies are investing in advanced processing equipment, quality control systems, standardized procedures, and research capabilities to deliver pure, consistent, and cost-effective fructose solutions. Strategic partnerships, technological innovation, and geographic expansion are central to strengthening product portfolios and market presence.

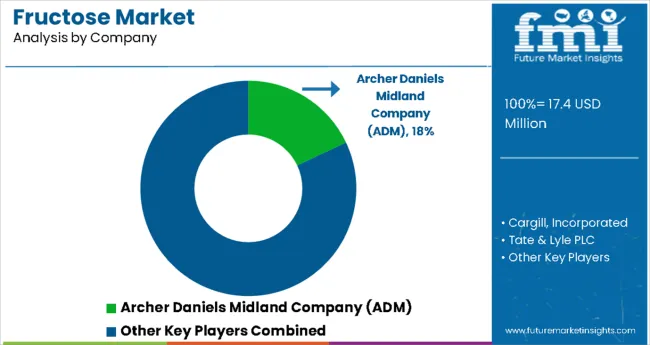
Archer Daniels Midland Company (ADM), United States-based, holds an 18% market position and offers comprehensive fructose products with a focus on quality consistency and application versatility. Cargill Incorporated provides integrated fructose solutions across agricultural processing and food ingredient manufacturing operations. Tate & Lyle PLC, United Kingdom, delivers technologically advanced fructose products with standardized quality and global distribution capabilities. Ingredion Incorporated emphasizes specialized formulations and customer-specific applications for diverse food industry requirements.

DuPont de Nemours Inc. offers fructose solutions integrated into comprehensive food ingredient portfolios. These companies provide specialized processing expertise, standardized quality procedures, and reliable supply capabilities across global and regional networks, focusing on food and beverage applications, pharmaceutical formulations, and industrial processing requirements.

Global Fructose Market - Stakeholder Contribution Framework

Fructose sits at the crossroads of sweetener formulation, calorie-management debates, and ingredient sourcing shifts. Its uses span high-fructose syrups for beverages and confectionery, crystalline fructose for specialty formulations, and niche roles in pharmaceuticals and fermentation feedstocks. The market’s trajectory will be shaped not only by demand-side trends (health, label claims, and reformulation) but by how policy, standards bodies, equipment makers, ingredient suppliers, and capital providers act together to balance cost, sustainability and consumer trust.

How Governments Could Spur Local Production and Adoption?

  • Regulatory Clarity: Provide unambiguous definitions and labeling rules that distinguish different fructose forms (HFCS, crystalline, fruit-derived) so manufacturers and consumers can make informed choices.
  • Trade & Tariff Policy: Use targeted tariff schedules or preferential trade terms for sustainably produced sweeteners to support local refining and reduce exposure to feedstock shocks.
  • Sustainability Incentives: Offer credits or tax breaks for producers that reduce energy intensity, water use, or shift to low-emission feedstocks (e.g., inulin-derived or enzymatically produced fructose).
  • Public Health Alignment: Coordinate with health agencies to create guidance that balances sugar-reduction targets with the technological roles fructose plays in texture, shelf life, and flavor; fund reformulation pilots that test lower-calorie systems.
  • R&D Support: Fund research into alternative production routes (bioconversion, enzymatic processes) and into lifecycle assessments that accurately capture fructose’s environmental footprint.

How Industry Bodies Could Support Market Development?

  • Standards & Nomenclature: Create harmonized specifications for purity, moisture, and impurity limits across grades used in beverages, bakery, and pharma to simplify global sourcing.
  • Evidence & Communication: Coordinate scientific reviews and transparent messaging on metabolic, functional, and safety aspects to reduce consumer confusion and regulatory friction.
  • Export Facilitation: Help smaller producers meet importer testing regimes and certifications, packaging regional producers into export-ready consortia.
  • Skills & Best Practices: Provide technical training on storage, handling (hygroscopicity management), and blending protocols so processors preserve functional performance in finished goods.

How OEMs and Processing / Food-Tech Players Could Strengthen the Ecosystem?

  • Process Efficiency: Develop energy- and water-efficient reactors and crystallizers tailored for medium-scale fructose production or conversion from alternative feedstocks.
  • Formulation Tools: Build digital formulation libraries and predictive models that show how fructose interacts with other sweeteners and stabilizers, enabling faster low-sugar reformulations without sensory compromise.
  • Flexible Lines: Offer modular syrup-handling, blending and sterile dosing equipment that lets co-packers switch between fructose grades and alternative sweeteners rapidly.
  • Analytics & QA: Integrate inline analytics (Brix, impurity profiling) to improve yield, reduce rework, and ensure consistent batch quality required by food and pharma customers.

How Suppliers Could Navigate the Shift?

  • Feedstock Strategy: Diversify feedstock sources - from traditional starch-derived glucose isomerization to agri-residues or inulin streams - to hedge price and sustainability risks.
  • Product Range: Offer tiered fructose products (industrial syrup, pharma-grade crystalline, specialty granular) with clear technical dossiers for each use-case.
  • Traceability & Claims: Build traceability systems to support sustainability claims (water use, GHG intensity) and to enable customers’ clean-label narratives.
  • Technical Partnership: Provide hands-on reformulation support to buyers, demonstrating equivalency or advantages in sweetness, humectancy, and browning control versus alternate sweeteners.

How Investors and Financial Enablers Could Unlock Value?

  • Capex for Modernization: Finance retrofits that cut energy and water intensity in existing conversion plants and build modular plants closer to feedstock basins.
  • Support for Alternative Pathways: Back biotech and enzyme-platform companies commercializing low-footprint fructose production routes.
  • Risk Mitigation Instruments: Create hedging and insurance products that shield producers from feedstock price spikes and trade disruptions.
  • Consolidation & Scale: Enable roll-ups of regional syrup producers to create operators with the scale and technical depth to serve global beverage and ingredient customers.

Key Players in the Fructose Market

  • Archer Daniels Midland Company (ADM)
  • Cargill Incorporated
  • Tate & Lyle PLC
  • Ingredion Incorporated
  • DuPont de Nemours Inc.

Scope of the Report

Items Values
Quantitative Units (2025) USD 17.4 Billion
Source Corn, Sugar Beet, Sugarcane, Others (Fruits, Agave, Tapioca & Cassava, and Sweet Potatoes & Jerusalem Artichoke)
Product Type High Corn Syrup (High Corn Syrup 55, High Corn Syrup 42, High Corn Syrup 65, High Corn Syrup 90), Syrups, Solids
Application Sports Applications, Dairy-based Products, Ice Cream, Milkshake, Frozen Desserts, Yoghurt, Beverages, Non-Alcoholic Drinks, Alcoholic Drinks, Baked Goods, Biscuits & Cookies, Cake, Muffins and Pastries, Bread, Other Baked Goods, Cosmetics & Personal Care, Medicinal Syrups and Baby Foods, and Others (Sauces & Condiments, Canned Fruits & Preserves, Breakfast Cereals & Granola, Nutritional Supplements, and Pet Food & Animal Nutrition).
Regions Covered North America, Europe, Asia Pacific, Latin America, Middle East & Africa
Countr ies Covered India, China, Germany, South Korea, Brazil, United Kingdom, Mexico
Key Companies Profiled Archer Daniels Midland Company (ADM); Cargill Incorporated; Tate & Lyle PLC; Ingredion Incorporated; DuPont de Nemours Inc.
Additional Attributes Dollar sales by source and product type, regional demand trends across Asia Pacific, North America, and Europe, competitive landscape with established agricultural processing companies, buyer preferences for corn-based versus alternative source formulations, integration with food manufacturing and beverage applications, innovations in processing technologies and purification systems, and adoption of specialized fructose variants with enhanced functionality and quality consistency for pharmaceutical and food industry applications.

Fructose Market by Segments

Source:

  • Corn
  • Sugar Beet
  • Sugarcane
  • Others

Product Type:

  • High Corn Syrup 55
  • High Corn Syrup 42
  • High Corn Syrup 65
  • High Corn Syrup 90
  • Syrups
  • Solids

Region:

  • North America
  • United States
  • Canada
  • Mexico
  • Europe
  • Germany
  • United Kingdom
  • France
  • Italy
  • Spain
  • Netherlands
  • Rest of Europe
  • Asia Pacific
  • China
  • India
  • Japan
  • South Korea
  • ASEAN
  • Australia & New Zealand
  • Rest of Asia Pacific
  • Latin America
  • Brazil
  • Argentina
  • Rest of Latin America
  • Middle East & Africa
  • GCC Countries
  • South Africa
  • Rest of Middle East & Africa

Frequently Asked Questions

What is the projected size of the global fructose market by 2035?

The industry is expected to reach USD 31.3 million by 2035.

What is the estimated CAGR for the fructose industry from 2025 to 2035?

The industry is projected to grow at a CAGR of 6% during 2025–2035.

Which form of fructose is most widely used in food and beverage applications?

High-fructose corn syrup (HFCS), especially HFCS 42 and 55, remains the dominant form used in processed foods and drinks.

Who are the key contributors to global fructose production and demand?

The United States, China, and India are among the top regions driving global fructose consumption and supply.

Which segments are seeing increased fructose adoption?

Functional beverages, infant nutrition, and clean-label bakery products are witnessing rising fructose integration.

Table of Content

  1. Executive Summary
  2. Market Overview
  3. Market Background
  4. Global Market Analysis 2020 to 2024 and Forecast, 2025 to 2035
  5. Global Market Analysis 2020 to 2024 and Forecast 2025 to 2035, By Source
    • Sugarcane
    • Sugar Beet
    • Corn
    • Others (Fruits, Agave, Tapioca & Cassava, and Sweet Potatoes & Jerusalem Artichoke)
  6. Global Market Analysis 2020 to 2024 and Forecast 2025 to 2035, By Product Type
    • High Corn Syrup
      • High Corn Syrup 42
      • High Corn Syrup 55
      • High Corn Syrup 65
      • High Corn Syrup 90
    • Syrups
    • Solids
  7. Global Market Analysis 2020 to 2024 and Forecast 2025 to 2035, By Application
    • Sports Applications
    • Dairy-based Products
      • Ice Cream
      • Milkshake
      • Frozen Desserts
      • Yoghurt
    • Beverages
      • Non-Alcoholic Drinks
      • Alcoholic Drinks
    • Baked Goods
      • Biscuits & Cookies
      • Cake, Muffins and Pastries
      • Bread
      • Other Baked Goods
    • Cosmetics & Personal Care
    • Medicinal Syrups and Baby Foods
    • Others (Sauces & Condiments, Canned Fruits & Preserves, Breakfast Cereals & Granola, Nutritional Supplements, and Pet Food & Animal Nutrition)
  8. Global Market Analysis 2020 to 2024 and Forecast 2025 to 2035, By Region
    • North America
    • Latin America
    • Europe
    • East Asia
    • South Asia
    • Oceania
    • Middle East and Africa
  9. North America Market Analysis 2020 to 2024 and Forecast 2025 to 2035, By Country
  10. Latin America Market Analysis 2020 to 2024 and Forecast 2025 to 2035, By Country
  11. Europe Market Analysis 2020 to 2024 and Forecast 2025 to 2035, By Country
  12. East Asia Market Analysis 2020 to 2024 and Forecast 2025 to 2035, By Country
  13. South Asia Market Analysis 2020 to 2024 and Forecast 2025 to 2035, By Country
  14. Oceania Market Analysis 2020 to 2024 and Forecast 2025 to 2035, By Country
  15. Middle East and Africa Market Analysis 2020 to 2024 and Forecast 2025 to 2035, By Country
  16. Key Countries Market Analysis
  17. Market Structure Analysis
  18. Competition Analysis
    • Archer Daniels Midland Company (ADM)
    • Cargill, Incorporated
    • Tate & Lyle PLC
    • Ingredion Incorporated
    • DuPont de Nemours, Inc.
    • Galam
    • Shijiazhuang Huaxu Pharmaceutical Co., Ltd.
    • Gadot Biochemical Industries Ltd.
    • KASYAP
    • NAVAREST
  19. Assumptions & Acronyms Used
  20. Research Methodology

List of Tables

  • Table 1: Global Market Value (USD Billion) Forecast by Region, 2020-2035
  • Table 2: Global Market Volume (Units) Forecast by Region, 2020-2035
  • Table 3: Global Market Value (USD Billion) Forecast by Source, 2020-2035
  • Table 4: Global Market Volume (Units) Forecast by Source, 2020-2035
  • Table 5: Global Market Value (USD Billion) Forecast by Product Type, 2020-2035
  • Table 6: Global Market Volume (Units) Forecast by Product Type, 2020-2035
  • Table 7: Global Market Value (USD Billion) Forecast by Application, 2020-2035
  • Table 8: Global Market Volume (Units) Forecast by Application, 2020-2035
  • Table 9: Global Market Value Share (%) Analysis by Source, 2025-2035
  • Table 10: Global Market Value Share (%) Analysis by Product Type, 2025-2035
  • Table 11: Global Market Value Share (%) Analysis by Application, 2025-2035
  • Table 12: Global Market Value Share (%) Analysis by Region, 2025-2035
  • Table 13: Global Market Basis Point Share Analysis by Source, 2025-2035
  • Table 14: Global Market Basis Point Share Analysis by Product Type, 2025-2035
  • Table 15: Global Market Basis Point Share Analysis by Application, 2025-2035
  • Table 16: Global Market Basis Point Share Analysis by Region, 2025-2035
  • Table 17: North America Market Value (USD Billion) Forecast by Country, 2020-2035
  • Table 18: North America Market Volume (Units) Forecast by Country, 2020-2035
  • Table 19: North America Market Value (USD Billion) Forecast by Source, 2020-2035
  • Table 20: North America Market Volume (Units) Forecast by Source, 2020-2035
  • Table 21: North America Market Value (USD Billion) Forecast by Product Type, 2020-2035
  • Table 22: North America Market Volume (Units) Forecast by Product Type, 2020-2035
  • Table 23: North America Market Value (USD Billion) Forecast by Application, 2020-2035
  • Table 24: North America Market Volume (Units) Forecast by Application, 2020-2035
  • Table 25: North America Market Value Share (%) Analysis by Country, 2025-2035
  • Table 26: North America Market Value Share (%) Analysis by Source, 2025-2035
  • Table 27: North America Market Value Share (%) Analysis by Product Type, 2025-2035
  • Table 28: North America Market Value Share (%) Analysis by Application, 2025-2035
  • Table 29: North America Market Basis Point Share Analysis by Country, 2025-2035
  • Table 30: North America Market Basis Point Share Analysis by Source, 2025-2035
  • Table 31: North America Market Basis Point Share Analysis by Product Type, 2025-2035
  • Table 32: North America Market Basis Point Share Analysis by Application, 2025-2035
  • Table 33: Latin America Market Value (USD Billion) Forecast by Country, 2020-2035
  • Table 34: Latin America Market Volume (Units) Forecast by Country, 2020-2035
  • Table 35: Latin America Market Value (USD Billion) Forecast by Source, 2020-2035
  • Table 36: Latin America Market Volume (Units) Forecast by Source, 2020-2035
  • Table 37: Latin America Market Value (USD Billion) Forecast by Product Type, 2020-2035
  • Table 38: Latin America Market Volume (Units) Forecast by Product Type, 2020-2035
  • Table 39: Latin America Market Value (USD Billion) Forecast by Application, 2020-2035
  • Table 40: Latin America Market Volume (Units) Forecast by Application, 2020-2035
  • Table 41: Latin America Market Value Share (%) Analysis by Country, 2025-2035
  • Table 42: Latin America Market Value Share (%) Analysis by Source, 2025-2035
  • Table 43: Latin America Market Value Share (%) Analysis by Product Type, 2025-2035
  • Table 44: Latin America Market Value Share (%) Analysis by Application, 2025-2035
  • Table 45: Latin America Market Basis Point Share Analysis by Country, 2025-2035
  • Table 46: Latin America Market Basis Point Share Analysis by Source, 2025-2035
  • Table 47: Latin America Market Basis Point Share Analysis by Product Type, 2025-2035
  • Table 48: Latin America Market Basis Point Share Analysis by Application, 2025-2035
  • Table 49: Western Europe Market Value (USD Billion) Forecast by Country, 2020-2035
  • Table 50: Western Europe Market Volume (Units) Forecast by Country, 2020-2035
  • Table 51: Western Europe Market Value (USD Billion) Forecast by Source, 2020-2035
  • Table 52: Western Europe Market Volume (Units) Forecast by Source, 2020-2035
  • Table 53: Western Europe Market Value (USD Billion) Forecast by Product Type, 2020-2035
  • Table 54: Western Europe Market Volume (Units) Forecast by Product Type, 2020-2035
  • Table 55: Western Europe Market Value (USD Billion) Forecast by Application, 2020-2035
  • Table 56: Western Europe Market Volume (Units) Forecast by Application, 2020-2035
  • Table 57: Western Europe Market Value Share (%) Analysis by Country, 2025-2035
  • Table 58: Western Europe Market Value Share (%) Analysis by Source, 2025-2035
  • Table 59: Western Europe Market Value Share (%) Analysis by Product Type, 2025-2035
  • Table 60: Western Europe Market Value Share (%) Analysis by Application, 2025-2035
  • Table 61: Western Europe Market Basis Point Share Analysis by Country, 2025-2035
  • Table 62: Western Europe Market Basis Point Share Analysis by Source, 2025-2035
  • Table 63: Western Europe Market Basis Point Share Analysis by Product Type, 2025-2035
  • Table 64: Western Europe Market Basis Point Share Analysis by Application, 2025-2035
  • Table 65: Eastern Europe Market Value (USD Billion) Forecast by Country, 2020-2035
  • Table 66: Eastern Europe Market Volume (Units) Forecast by Country, 2020-2035
  • Table 67: Eastern Europe Market Value (USD Billion) Forecast by Source, 2020-2035
  • Table 68: Eastern Europe Market Volume (Units) Forecast by Source, 2020-2035
  • Table 69: Eastern Europe Market Value (USD Billion) Forecast by Product Type, 2020-2035
  • Table 70: Eastern Europe Market Volume (Units) Forecast by Product Type, 2020-2035
  • Table 71: Eastern Europe Market Value (USD Billion) Forecast by Application, 2020-2035
  • Table 72: Eastern Europe Market Volume (Units) Forecast by Application, 2020-2035
  • Table 73: Eastern Europe Market Value Share (%) Analysis by Country, 2025-2035
  • Table 74: Eastern Europe Market Value Share (%) Analysis by Source, 2025-2035
  • Table 75: Eastern Europe Market Value Share (%) Analysis by Product Type, 2025-2035
  • Table 76: Eastern Europe Market Value Share (%) Analysis by Application, 2025-2035
  • Table 77: Eastern Europe Market Basis Point Share Analysis by Country, 2025-2035
  • Table 78: Eastern Europe Market Basis Point Share Analysis by Source, 2025-2035
  • Table 79: Eastern Europe Market Basis Point Share Analysis by Product Type, 2025-2035
  • Table 80: Eastern Europe Market Basis Point Share Analysis by Application, 2025-2035
  • Table 81: East Asia Market Value (USD Billion) Forecast by Country, 2020-2035
  • Table 82: East Asia Market Volume (Units) Forecast by Country, 2020-2035
  • Table 83: East Asia Market Value (USD Billion) Forecast by Source, 2020-2035
  • Table 84: East Asia Market Volume (Units) Forecast by Source, 2020-2035
  • Table 85: East Asia Market Value (USD Billion) Forecast by Product Type, 2020-2035
  • Table 86: East Asia Market Volume (Units) Forecast by Product Type, 2020-2035
  • Table 87: East Asia Market Value (USD Billion) Forecast by Application, 2020-2035
  • Table 88: East Asia Market Volume (Units) Forecast by Application, 2020-2035
  • Table 89: East Asia Market Value Share (%) Analysis by Country, 2025-2035
  • Table 90: East Asia Market Value Share (%) Analysis by Source, 2025-2035
  • Table 91: East Asia Market Value Share (%) Analysis by Product Type, 2025-2035
  • Table 92: East Asia Market Value Share (%) Analysis by Application, 2025-2035
  • Table 93: East Asia Market Basis Point Share Analysis by Country, 2025-2035
  • Table 94: East Asia Market Basis Point Share Analysis by Source, 2025-2035
  • Table 95: East Asia Market Basis Point Share Analysis by Product Type, 2025-2035
  • Table 96: East Asia Market Basis Point Share Analysis by Application, 2025-2035
  • Table 97: South Asia & Pacific Market Value (USD Billion) Forecast by Country, 2020-2035
  • Table 98: South Asia & Pacific Market Volume (Units) Forecast by Country, 2020-2035
  • Table 99: South Asia & Pacific Market Value (USD Billion) Forecast by Source, 2020-2035
  • Table 100: South Asia & Pacific Market Volume (Units) Forecast by Source, 2020-2035
  • Table 101: South Asia & Pacific Market Value (USD Billion) Forecast by Product Type, 2020-2035
  • Table 102: South Asia & Pacific Market Volume (Units) Forecast by Product Type, 2020-2035
  • Table 103: South Asia & Pacific Market Value (USD Billion) Forecast by Application, 2020-2035
  • Table 104: South Asia & Pacific Market Volume (Units) Forecast by Application, 2020-2035
  • Table 105: South Asia & Pacific Market Value Share (%) Analysis by Country, 2025-2035
  • Table 106: South Asia & Pacific Market Value Share (%) Analysis by Source, 2025-2035
  • Table 107: South Asia & Pacific Market Value Share (%) Analysis by Product Type, 2025-2035
  • Table 108: South Asia & Pacific Market Value Share (%) Analysis by Application, 2025-2035
  • Table 109: South Asia & Pacific Market Basis Point Share Analysis by Country, 2025-2035
  • Table 110: South Asia & Pacific Market Basis Point Share Analysis by Source, 2025-2035
  • Table 111: South Asia & Pacific Market Basis Point Share Analysis by Product Type, 2025-2035
  • Table 112: South Asia & Pacific Market Basis Point Share Analysis by Application, 2025-2035
  • Table 113: Middle East & Africa Market Value (USD Billion) Forecast by Country, 2020-2035
  • Table 114: Middle East & Africa Market Volume (Units) Forecast by Country, 2020-2035
  • Table 115: Middle East & Africa Market Value (USD Billion) Forecast by Source, 2020-2035
  • Table 116: Middle East & Africa Market Volume (Units) Forecast by Source, 2020-2035
  • Table 117: Middle East & Africa Market Value (USD Billion) Forecast by Product Type, 2020-2035
  • Table 118: Middle East & Africa Market Volume (Units) Forecast by Product Type, 2020-2035
  • Table 119: Middle East & Africa Market Value (USD Billion) Forecast by Application, 2020-2035
  • Table 120: Middle East & Africa Market Volume (Units) Forecast by Application, 2020-2035
  • Table 121: Middle East & Africa Market Value Share (%) Analysis by Country, 2025-2035
  • Table 122: Middle East & Africa Market Value Share (%) Analysis by Source, 2025-2035
  • Table 123: Middle East & Africa Market Value Share (%) Analysis by Product Type, 2025-2035
  • Table 124: Middle East & Africa Market Value Share (%) Analysis by Application, 2025-2035
  • Table 125: Middle East & Africa Market Basis Point Share Analysis by Country, 2025-2035
  • Table 126: Middle East & Africa Market Basis Point Share Analysis by Source, 2025-2035
  • Table 127: Middle East & Africa Market Basis Point Share Analysis by Product Type, 2025-2035
  • Table 128: Middle East & Africa Market Basis Point Share Analysis by Application, 2025-2035
  • Table 129: United States Market Value (USD Billion) Forecast by Source, 2020-2035
  • Table 130: United States Market Volume (Units) Forecast by Source, 2020-2035
  • Table 131: United States Market Value (USD Billion) Forecast by Product Type, 2020-2035
  • Table 132: United States Market Volume (Units) Forecast by Product Type, 2020-2035
  • Table 133: United States Market Value (USD Billion) Forecast by Application, 2020-2035
  • Table 134: United States Market Volume (Units) Forecast by Application, 2020-2035
  • Table 135: Canada Market Value (USD Billion) Forecast by Source, 2020-2035
  • Table 136: Canada Market Volume (Units) Forecast by Source, 2020-2035
  • Table 137: Canada Market Value (USD Billion) Forecast by Product Type, 2020-2035
  • Table 138: Canada Market Volume (Units) Forecast by Product Type, 2020-2035
  • Table 139: Canada Market Value (USD Billion) Forecast by Application, 2020-2035
  • Table 140: Canada Market Volume (Units) Forecast by Application, 2020-2035
  • Table 141: Mexico Market Value (USD Billion) Forecast by Source, 2020-2035
  • Table 142: Mexico Market Volume (Units) Forecast by Source, 2020-2035
  • Table 143: Mexico Market Value (USD Billion) Forecast by Product Type, 2020-2035
  • Table 144: Mexico Market Volume (Units) Forecast by Product Type, 2020-2035
  • Table 145: Mexico Market Value (USD Billion) Forecast by Application, 2020-2035
  • Table 146: Mexico Market Volume (Units) Forecast by Application, 2020-2035
  • Table 147: Brazil Market Value (USD Billion) Forecast by Source, 2020-2035
  • Table 148: Brazil Market Volume (Units) Forecast by Source, 2020-2035
  • Table 149: Brazil Market Value (USD Billion) Forecast by Product Type, 2020-2035
  • Table 150: Brazil Market Volume (Units) Forecast by Product Type, 2020-2035
  • Table 151: Brazil Market Value (USD Billion) Forecast by Application, 2020-2035
  • Table 152: Brazil Market Volume (Units) Forecast by Application, 2020-2035
  • Table 153: Argentina Market Value (USD Billion) Forecast by Source, 2020-2035
  • Table 154: Argentina Market Volume (Units) Forecast by Source, 2020-2035
  • Table 155: Argentina Market Value (USD Billion) Forecast by Product Type, 2020-2035
  • Table 156: Argentina Market Volume (Units) Forecast by Product Type, 2020-2035
  • Table 157: Argentina Market Value (USD Billion) Forecast by Application, 2020-2035
  • Table 158: Argentina Market Volume (Units) Forecast by Application, 2020-2035
  • Table 159: Germany Market Value (USD Billion) Forecast by Source, 2020-2035
  • Table 160: Germany Market Volume (Units) Forecast by Source, 2020-2035
  • Table 161: Germany Market Value (USD Billion) Forecast by Product Type, 2020-2035
  • Table 162: Germany Market Volume (Units) Forecast by Product Type, 2020-2035
  • Table 163: Germany Market Value (USD Billion) Forecast by Application, 2020-2035
  • Table 164: Germany Market Volume (Units) Forecast by Application, 2020-2035
  • Table 165: United Kingdom Market Value (USD Billion) Forecast by Source, 2020-2035
  • Table 166: United Kingdom Market Volume (Units) Forecast by Source, 2020-2035
  • Table 167: United Kingdom Market Value (USD Billion) Forecast by Product Type, 2020-2035
  • Table 168: United Kingdom Market Volume (Units) Forecast by Product Type, 2020-2035
  • Table 169: United Kingdom Market Value (USD Billion) Forecast by Application, 2020-2035
  • Table 170: United Kingdom Market Volume (Units) Forecast by Application, 2020-2035
  • Table 171: France Market Value (USD Billion) Forecast by Source, 2020-2035
  • Table 172: France Market Volume (Units) Forecast by Source, 2020-2035
  • Table 173: France Market Value (USD Billion) Forecast by Product Type, 2020-2035
  • Table 174: France Market Volume (Units) Forecast by Product Type, 2020-2035
  • Table 175: France Market Value (USD Billion) Forecast by Application, 2020-2035
  • Table 176: France Market Volume (Units) Forecast by Application, 2020-2035
  • Table 177: Italy Market Value (USD Billion) Forecast by Source, 2020-2035
  • Table 178: Italy Market Volume (Units) Forecast by Source, 2020-2035
  • Table 179: Italy Market Value (USD Billion) Forecast by Product Type, 2020-2035
  • Table 180: Italy Market Volume (Units) Forecast by Product Type, 2020-2035
  • Table 181: Italy Market Value (USD Billion) Forecast by Application, 2020-2035
  • Table 182: Italy Market Volume (Units) Forecast by Application, 2020-2035
  • Table 183: Spain Market Value (USD Billion) Forecast by Source, 2020-2035
  • Table 184: Spain Market Volume (Units) Forecast by Source, 2020-2035
  • Table 185: Spain Market Value (USD Billion) Forecast by Product Type, 2020-2035
  • Table 186: Spain Market Volume (Units) Forecast by Product Type, 2020-2035
  • Table 187: Spain Market Value (USD Billion) Forecast by Application, 2020-2035
  • Table 188: Spain Market Volume (Units) Forecast by Application, 2020-2035
  • Table 189: China Market Value (USD Billion) Forecast by Source, 2020-2035
  • Table 190: China Market Volume (Units) Forecast by Source, 2020-2035
  • Table 191: China Market Value (USD Billion) Forecast by Product Type, 2020-2035
  • Table 192: China Market Volume (Units) Forecast by Product Type, 2020-2035

List of Figures

  • Figure 1: Global Market Value (USD Billion) by Source, 2025-2035
  • Figure 2: Global Market Value (USD Billion) by Product Type, 2025-2035
  • Figure 3: Global Market Value (USD Billion) by Application, 2025-2035
  • Figure 4: Global Market Value (USD Billion) by Region, 2025-2035
  • Figure 5: Global Market Value (USD Billion) Analysis by Region, 2020-2035
  • Figure 6: Global Market Volume (Units) Analysis by Region, 2020-2035
  • Figure 7: Global Market Value Share (%) and BPS Analysis by Region, 2025-2035
  • Figure 8: Global Market Y-o-Y Growth (%) Projections by Region, 2025-2035
  • Figure 9: Global Market Value (USD Billion) Analysis by Source, 2020-2035
  • Figure 10: Global Market Volume (Units) Analysis by Source, 2020-2035
  • Figure 11: Global Market Value Share (%) and BPS Analysis by Source, 2025-2035
  • Figure 12: Global Market Y-o-Y Growth (%) Projections by Source, 2025-2035
  • Figure 13: Global Market Value (USD Billion) Analysis by Product Type, 2020-2035
  • Figure 14: Global Market Volume (Units) Analysis by Product Type, 2020-2035
  • Figure 15: Global Market Value Share (%) and BPS Analysis by Product Type, 2025-2035
  • Figure 16: Global Market Y-o-Y Growth (%) Projections by Product Type, 2025-2035
  • Figure 17: Global Market Value (USD Billion) Analysis by Application, 2020-2035
  • Figure 18: Global Market Volume (Units) Analysis by Application, 2020-2035
  • Figure 19: Global Market Value Share (%) and BPS Analysis by Application, 2025-2035
  • Figure 20: Global Market Y-o-Y Growth (%) Projections by Application, 2025-2035
  • Figure 21: Global Market Attractiveness by Source, 2025-2035
  • Figure 22: Global Market Attractiveness by Product Type, 2025-2035
  • Figure 23: Global Market Attractiveness by Application, 2025-2035
  • Figure 24: Global Market Attractiveness by Region, 2025-2035
  • Figure 25: North America Market Value (USD Billion) by Source, 2025-2035
  • Figure 26: North America Market Value (USD Billion) by Product Type, 2025-2035
  • Figure 27: North America Market Value (USD Billion) by Application, 2025-2035
  • Figure 28: North America Market Value (USD Billion) by Country, 2025-2035
  • Figure 29: North America Market Value (USD Billion) Analysis by Country, 2020-2035
  • Figure 30: North America Market Volume (Units) Analysis by Country, 2020-2035
  • Figure 31: North America Market Value Share (%) and BPS Analysis by Country, 2025-2035
  • Figure 32: North America Market Y-o-Y Growth (%) Projections by Country, 2025-2035
  • Figure 33: North America Market Value (USD Billion) Analysis by Source, 2020-2035
  • Figure 34: North America Market Volume (Units) Analysis by Source, 2020-2035
  • Figure 35: North America Market Value Share (%) and BPS Analysis by Source, 2025-2035
  • Figure 36: North America Market Y-o-Y Growth (%) Projections by Source, 2025-2035
  • Figure 37: North America Market Value (USD Billion) Analysis by Product Type, 2020-2035
  • Figure 38: North America Market Volume (Units) Analysis by Product Type, 2020-2035
  • Figure 39: North America Market Value Share (%) and BPS Analysis by Product Type, 2025-2035
  • Figure 40: North America Market Y-o-Y Growth (%) Projections by Product Type, 2025-2035
  • Figure 41: North America Market Value (USD Billion) Analysis by Application, 2020-2035
  • Figure 42: North America Market Volume (Units) Analysis by Application, 2020-2035
  • Figure 43: North America Market Value Share (%) and BPS Analysis by Application, 2025-2035
  • Figure 44: North America Market Y-o-Y Growth (%) Projections by Application, 2025-2035
  • Figure 45: North America Market Attractiveness by Source, 2025-2035
  • Figure 46: North America Market Attractiveness by Product Type, 2025-2035
  • Figure 47: North America Market Attractiveness by Application, 2025-2035
  • Figure 48: North America Market Attractiveness by Country, 2025-2035
  • Figure 49: Latin America Market Value (USD Billion) by Source, 2025-2035
  • Figure 50: Latin America Market Value (USD Billion) by Product Type, 2025-2035
  • Figure 51: Latin America Market Value (USD Billion) by Application, 2025-2035
  • Figure 52: Latin America Market Value (USD Billion) by Country, 2025-2035
  • Figure 53: Latin America Market Value (USD Billion) Analysis by Country, 2020-2035
  • Figure 54: Latin America Market Volume (Units) Analysis by Country, 2020-2035
  • Figure 55: Latin America Market Value Share (%) and BPS Analysis by Country, 2025-2035
  • Figure 56: Latin America Market Y-o-Y Growth (%) Projections by Country, 2025-2035
  • Figure 57: Latin America Market Value (USD Billion) Analysis by Source, 2020-2035
  • Figure 58: Latin America Market Volume (Units) Analysis by Source, 2020-2035
  • Figure 59: Latin America Market Value Share (%) and BPS Analysis by Source, 2025-2035
  • Figure 60: Latin America Market Y-o-Y Growth (%) Projections by Source, 2025-2035
  • Figure 61: Latin America Market Value (USD Billion) Analysis by Product Type, 2020-2035
  • Figure 62: Latin America Market Volume (Units) Analysis by Product Type, 2020-2035
  • Figure 63: Latin America Market Value Share (%) and BPS Analysis by Product Type, 2025-2035
  • Figure 64: Latin America Market Y-o-Y Growth (%) Projections by Product Type, 2025-2035
  • Figure 65: Latin America Market Value (USD Billion) Analysis by Application, 2020-2035
  • Figure 66: Latin America Market Volume (Units) Analysis by Application, 2020-2035
  • Figure 67: Latin America Market Value Share (%) and BPS Analysis by Application, 2025-2035
  • Figure 68: Latin America Market Y-o-Y Growth (%) Projections by Application, 2025-2035
  • Figure 69: Latin America Market Attractiveness by Source, 2025-2035
  • Figure 70: Latin America Market Attractiveness by Product Type, 2025-2035
  • Figure 71: Latin America Market Attractiveness by Application, 2025-2035
  • Figure 72: Latin America Market Attractiveness by Country, 2025-2035
  • Figure 73: Western Europe Market Value (USD Billion) by Source, 2025-2035
  • Figure 74: Western Europe Market Value (USD Billion) by Product Type, 2025-2035
  • Figure 75: Western Europe Market Value (USD Billion) by Application, 2025-2035
  • Figure 76: Western Europe Market Value (USD Billion) by Country, 2025-2035
  • Figure 77: Western Europe Market Value (USD Billion) Analysis by Country, 2020-2035
  • Figure 78: Western Europe Market Volume (Units) Analysis by Country, 2020-2035
  • Figure 79: Western Europe Market Value Share (%) and BPS Analysis by Country, 2025-2035
  • Figure 80: Western Europe Market Y-o-Y Growth (%) Projections by Country, 2025-2035
  • Figure 81: Western Europe Market Value (USD Billion) Analysis by Source, 2020-2035
  • Figure 82: Western Europe Market Volume (Units) Analysis by Source, 2020-2035
  • Figure 83: Western Europe Market Value Share (%) and BPS Analysis by Source, 2025-2035
  • Figure 84: Western Europe Market Y-o-Y Growth (%) Projections by Source, 2025-2035
  • Figure 85: Western Europe Market Value (USD Billion) Analysis by Product Type, 2020-2035
  • Figure 86: Western Europe Market Volume (Units) Analysis by Product Type, 2020-2035
  • Figure 87: Western Europe Market Value Share (%) and BPS Analysis by Product Type, 2025-2035
  • Figure 88: Western Europe Market Y-o-Y Growth (%) Projections by Product Type, 2025-2035
  • Figure 89: Western Europe Market Value (USD Billion) Analysis by Application, 2020-2035
  • Figure 90: Western Europe Market Volume (Units) Analysis by Application, 2020-2035
  • Figure 91: Western Europe Market Value Share (%) and BPS Analysis by Application, 2025-2035
  • Figure 92: Western Europe Market Y-o-Y Growth (%) Projections by Application, 2025-2035
  • Figure 93: Western Europe Market Attractiveness by Source, 2025-2035
  • Figure 94: Western Europe Market Attractiveness by Product Type, 2025-2035
  • Figure 95: Western Europe Market Attractiveness by Application, 2025-2035
  • Figure 96: Western Europe Market Attractiveness by Country, 2025-2035
  • Figure 97: Eastern Europe Market Value (USD Billion) by Source, 2025-2035
  • Figure 98: Eastern Europe Market Value (USD Billion) by Product Type, 2025-2035
  • Figure 99: Eastern Europe Market Value (USD Billion) by Application, 2025-2035
  • Figure 100: Eastern Europe Market Value (USD Billion) by Country, 2025-2035
  • Figure 101: Eastern Europe Market Value (USD Billion) Analysis by Country, 2020-2035
  • Figure 102: Eastern Europe Market Volume (Units) Analysis by Country, 2020-2035
  • Figure 103: Eastern Europe Market Value Share (%) and BPS Analysis by Country, 2025-2035
  • Figure 104: Eastern Europe Market Y-o-Y Growth (%) Projections by Country, 2025-2035
  • Figure 105: Eastern Europe Market Value (USD Billion) Analysis by Source, 2020-2035
  • Figure 106: Eastern Europe Market Volume (Units) Analysis by Source, 2020-2035
  • Figure 107: Eastern Europe Market Value Share (%) and BPS Analysis by Source, 2025-2035
  • Figure 108: Eastern Europe Market Y-o-Y Growth (%) Projections by Source, 2025-2035
  • Figure 109: Eastern Europe Market Value (USD Billion) Analysis by Product Type, 2020-2035
  • Figure 110: Eastern Europe Market Volume (Units) Analysis by Product Type, 2020-2035
  • Figure 111: Eastern Europe Market Value Share (%) and BPS Analysis by Product Type, 2025-2035
  • Figure 112: Eastern Europe Market Y-o-Y Growth (%) Projections by Product Type, 2025-2035
  • Figure 113: Eastern Europe Market Value (USD Billion) Analysis by Application, 2020-2035
  • Figure 114: Eastern Europe Market Volume (Units) Analysis by Application, 2020-2035
  • Figure 115: Eastern Europe Market Value Share (%) and BPS Analysis by Application, 2025-2035
  • Figure 116: Eastern Europe Market Y-o-Y Growth (%) Projections by Application, 2025-2035
  • Figure 117: Eastern Europe Market Attractiveness by Source, 2025-2035
  • Figure 118: Eastern Europe Market Attractiveness by Product Type, 2025-2035
  • Figure 119: Eastern Europe Market Attractiveness by Application, 2025-2035
  • Figure 120: Eastern Europe Market Attractiveness by Country, 2025-2035
  • Figure 121: East Asia Market Value (USD Billion) by Source, 2025-2035
  • Figure 122: East Asia Market Value (USD Billion) by Product Type, 2025-2035
  • Figure 123: East Asia Market Value (USD Billion) by Application, 2025-2035
  • Figure 124: East Asia Market Value (USD Billion) by Country, 2025-2035
  • Figure 125: East Asia Market Value (USD Billion) Analysis by Country, 2020-2035
  • Figure 126: East Asia Market Volume (Units) Analysis by Country, 2020-2035
  • Figure 127: East Asia Market Value Share (%) and BPS Analysis by Country, 2025-2035
  • Figure 128: East Asia Market Y-o-Y Growth (%) Projections by Country, 2025-2035
  • Figure 129: East Asia Market Value (USD Billion) Analysis by Source, 2020-2035
  • Figure 130: East Asia Market Volume (Units) Analysis by Source, 2020-2035
  • Figure 131: East Asia Market Value Share (%) and BPS Analysis by Source, 2025-2035
  • Figure 132: East Asia Market Y-o-Y Growth (%) Projections by Source, 2025-2035
  • Figure 133: East Asia Market Value (USD Billion) Analysis by Product Type, 2020-2035
  • Figure 134: East Asia Market Volume (Units) Analysis by Product Type, 2020-2035
  • Figure 135: East Asia Market Value Share (%) and BPS Analysis by Product Type, 2025-2035
  • Figure 136: East Asia Market Y-o-Y Growth (%) Projections by Product Type, 2025-2035
  • Figure 137: East Asia Market Value (USD Billion) Analysis by Application, 2020-2035
  • Figure 138: East Asia Market Volume (Units) Analysis by Application, 2020-2035
  • Figure 139: East Asia Market Value Share (%) and BPS Analysis by Application, 2025-2035
  • Figure 140: East Asia Market Y-o-Y Growth (%) Projections by Application, 2025-2035
  • Figure 141: East Asia Market Attractiveness by Source, 2025-2035
  • Figure 142: East Asia Market Attractiveness by Product Type, 2025-2035
  • Figure 143: East Asia Market Attractiveness by Application, 2025-2035
  • Figure 144: East Asia Market Attractiveness by Country, 2025-2035
  • Figure 145: South Asia & Pacific Market Value (USD Billion) by Source, 2025-2035
  • Figure 146: South Asia & Pacific Market Value (USD Billion) by Product Type, 2025-2035
  • Figure 147: South Asia & Pacific Market Value (USD Billion) by Application, 2025-2035
  • Figure 148: South Asia & Pacific Market Value (USD Billion) by Country, 2025-2035
  • Figure 149: South Asia & Pacific Market Value (USD Billion) Analysis by Country, 2020-2035
  • Figure 150: South Asia & Pacific Market Volume (Units) Analysis by Country, 2020-2035
  • Figure 151: South Asia & Pacific Market Value Share (%) and BPS Analysis by Country, 2025-2035
  • Figure 152: South Asia & Pacific Market Y-o-Y Growth (%) Projections by Country, 2025-2035
  • Figure 153: South Asia & Pacific Market Value (USD Billion) Analysis by Source, 2020-2035
  • Figure 154: South Asia & Pacific Market Volume (Units) Analysis by Source, 2020-2035
  • Figure 155: South Asia & Pacific Market Value Share (%) and BPS Analysis by Source, 2025-2035
  • Figure 156: South Asia & Pacific Market Y-o-Y Growth (%) Projections by Source, 2025-2035
  • Figure 157: South Asia & Pacific Market Value (USD Billion) Analysis by Product Type, 2020-2035
  • Figure 158: South Asia & Pacific Market Volume (Units) Analysis by Product Type, 2020-2035
  • Figure 159: South Asia & Pacific Market Value Share (%) and BPS Analysis by Product Type, 2025-2035
  • Figure 160: South Asia & Pacific Market Y-o-Y Growth (%) Projections by Product Type, 2025-2035
  • Figure 161: South Asia & Pacific Market Value (USD Billion) Analysis by Application, 2020-2035
  • Figure 162: South Asia & Pacific Market Volume (Units) Analysis by Application, 2020-2035
  • Figure 163: South Asia & Pacific Market Value Share (%) and BPS Analysis by Application, 2025-2035
  • Figure 164: South Asia & Pacific Market Y-o-Y Growth (%) Projections by Application, 2025-2035
  • Figure 165: South Asia & Pacific Market Attractiveness by Source, 2025-2035
  • Figure 166: South Asia & Pacific Market Attractiveness by Product Type, 2025-2035
  • Figure 167: South Asia & Pacific Market Attractiveness by Application, 2025-2035
  • Figure 168: South Asia & Pacific Market Attractiveness by Country, 2025-2035
  • Figure 169: Middle East & Africa Market Value (USD Billion) by Source, 2025-2035
  • Figure 170: Middle East & Africa Market Value (USD Billion) by Product Type, 2025-2035
  • Figure 171: Middle East & Africa Market Value (USD Billion) by Application, 2025-2035
  • Figure 172: Middle East & Africa Market Value (USD Billion) by Country, 2025-2035
  • Figure 173: Middle East & Africa Market Value (USD Billion) Analysis by Country, 2020-2035
  • Figure 174: Middle East & Africa Market Volume (Units) Analysis by Country, 2020-2035
  • Figure 175: Middle East & Africa Market Value Share (%) and BPS Analysis by Country, 2025-2035
  • Figure 176: Middle East & Africa Market Y-o-Y Growth (%) Projections by Country, 2025-2035
  • Figure 177: Middle East & Africa Market Value (USD Billion) Analysis by Source, 2020-2035
  • Figure 178: Middle East & Africa Market Volume (Units) Analysis by Source, 2020-2035
  • Figure 179: Middle East & Africa Market Value Share (%) and BPS Analysis by Source, 2025-2035
  • Figure 180: Middle East & Africa Market Y-o-Y Growth (%) Projections by Source, 2025-2035
  • Figure 181: Middle East & Africa Market Value (USD Billion) Analysis by Product Type, 2020-2035
  • Figure 182: Middle East & Africa Market Volume (Units) Analysis by Product Type, 2020-2035
  • Figure 183: Middle East & Africa Market Value Share (%) and BPS Analysis by Product Type, 2025-2035
  • Figure 184: Middle East & Africa Market Y-o-Y Growth (%) Projections by Product Type, 2025-2035
  • Figure 185: Middle East & Africa Market Value (USD Billion) Analysis by Application, 2020-2035
  • Figure 186: Middle East & Africa Market Volume (Units) Analysis by Application, 2020-2035
  • Figure 187: Middle East & Africa Market Value Share (%) and BPS Analysis by Application, 2025-2035
  • Figure 188: Middle East & Africa Market Y-o-Y Growth (%) Projections by Application, 2025-2035
  • Figure 189: Middle East & Africa Market Attractiveness by Source, 2025-2035
  • Figure 190: Middle East & Africa Market Attractiveness by Product Type, 2025-2035
  • Figure 191: Middle East & Africa Market Attractiveness by Application, 2025-2035
  • Figure 192: Middle East & Africa Market Attractiveness by Country, 2025-2035
Dashboard
Dashboard
Dashboard
Dashboard
Dashboard
Dashboard

Full Research Suite comprises of:

Market outlook & trends analysis

Market outlook & trends analysis

Interviews & case studies

Interviews & case studies

Strategic recommendations

Strategic recommendations

Vendor profiles & capabilities analysis

Vendor profiles & capabilities analysis

5-year forecasts

5-year forecasts

8 regions and 60+ country-level data splits

8 regions and 60+ country-level data splits

Market segment data splits

Market segment data splits

12 months of continuous data updates

12 months of continuous data updates

DELIVERED AS:

PDF EXCEL ONLINE

Full Research Suite


$3500

$5000

$6500

Buy Report Now
Similar Industry Reports

Similar Industry Reports

Glucose-fructose Syrup Market

Glucose-Fructose Syrup Market – Growth, Demand & Food Industry Trends

Crystalline Fructose Market

Crystalline Fructose Market Growth - Trends & Forecast through 2034

Future Market Insights

Fructose Market

Chat With MaRIA

Chat With

MaRIA

Hi There, I am MaRIA, Your Market Research Intelligence Assistant. How may I help you?