The global geocells market is valued at USD 160.1 million in 2025 and is projected to reach USD 281.4 million by 2035, advancing at a CAGR of 5.8%. Growth is driven by the expanding infrastructure development sector, rising preference for soil stabilization solutions, and the need for erosion control in construction and civil engineering applications. Geocells offer superior load distribution capabilities, enhanced slope protection performance, and cost-effective ground reinforcement solutions, making them suitable for road construction, retaining walls, channel protection, and embankment stabilization operations.
High-density polyethylene (HDPE) geocells account for the largest share due to proven durability characteristics, established manufacturing processes, and compatibility with diverse soil conditions, while polypropylene and polyester geocells support specialized applications in chemical-resistant environments and high-temperature installations. Road construction represents the dominant application at 40% of demand, followed by slope protection as infrastructure developers expand ground stabilization requirements. Asia Pacific, particularly China and India, leads growth due to rapid infrastructure development and modernization of transportation systems, while North America shows steady potential supported by aging infrastructure replacement and highway maintenance projects. Competition in the geocells market remains moderate, with key companies such as Presto Geosystems, Strata Systems, and TenCate Geosynthetics focusing on material strength optimization, installation efficiency enhancement, and long-term performance capabilities to strengthen market positioning.
Manufacturing operations encounter coordination difficulties when managing different regional requirements for barrier film composition and end-of-life disposal protocols. Quality assurance teams must validate that multilayer barrier films meet varying recyclability standards across different markets while maintaining consistent oxygen and moisture barrier performance. Production managers face challenges when switching between barrier coating technologies to meet specific regional sustainability requirements, as traditional PVDC coatings face restrictions in European and North American markets due to chlorinated polymer regulations.
Cross-functional tensions arise when environmental compliance teams push for biodegradable alternatives while operations personnel require predictable barrier performance for high-speed packaging lines. Engineering departments struggle to balance advanced barrier properties with mechanical processing requirements when implementing new bio-based coating systems that may exhibit different thermal stability characteristics during lamination and converting operations. Procurement teams encounter difficulties managing inventory across multiple barrier film specifications needed for different product categories and regional markets with distinct regulatory frameworks.
The supply chain coordination becomes complicated when addressing varying certification requirements across different geographic regions. Packaging must align with regional regulations including Canadian and European Union green policies that increasingly mandate sustainable packaging practices and restrict certain plastic materials, with certifications such as EN13432 and ISO 18606 defining industrial compostability criteria. Quality control departments must develop inspection protocols for validating compostability claims and proper labeling requirements while maintaining production efficiency targets.
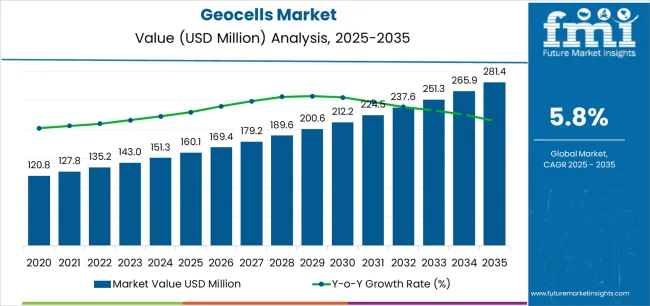
From 2030 to 2035, the market is forecast to grow from USD 214.0 million to USD 281.4 million, adding another USD 67.3 million, which constitutes 55.5% of the overall ten-year expansion. This period is expected to be characterized by the expansion of climate resilience integration and nature-based engineering solutions, the development of advanced polymer formulation technologies and recycled-content systems, and the growth of specialized applications for coastal protection and disaster mitigation infrastructure.
The growing adoption of sustainable construction practices and circular economy principles will drive demand for geocells with enhanced durability and environmental performance features.
Between 2020 and 2025, the geocells market experienced steady growth, driven by increasing transportation infrastructure development and growing recognition of cellular confinement systems as essential solutions for reliable soil stabilization and load distribution in diverse civil engineering applications.
The market developed as civil engineers and infrastructure developers recognized the potential for geocells to enhance project longevity while supporting continuous performance and cost-effective construction requirements. Technological advancement in polymer extrusion processes and welding systems began emphasizing the critical importance of maintaining structural integrity and operational efficiency in geotechnical applications.
| Metric | Value |
|---|---|
| Estimated Value in (2025E) | USD 160.1 million |
| Forecast Value in (2035F) | USD 281.4 million |
| Forecast CAGR (2025 to 2035) | 5.8% |
Market expansion is being supported by the increasing global demand for transportation infrastructure and the corresponding need for reliable soil reinforcement solutions that can ensure effective load distribution, maintain slope stability, and support operational efficiency across various highway construction, railway embankment, and erosion control applications. Modern infrastructure developers and civil engineering contractors are increasingly focused on implementing cellular confinement systems that can deliver reliable performance, ensure consistent durability, and provide versatile applications in demanding construction conditions.
The growing emphasis on sustainable infrastructure and climate resilience is driving demand for geocells that can support effective soil stabilization, enable natural drainage pathways, and ensure comprehensive environmental compliance. Infrastructure developers' preference for geosynthetic solutions that combine construction efficiency with operational reliability and supply chain availability is creating opportunities for innovative geocells implementations. The rising influence of extreme weather events and aging infrastructure rehabilitation is also contributing to increased adoption of high-performance geocells that can provide reliable reinforcement without compromising project quality or construction efficiency.
The market is segmented by material, application, region, and end-user sector. By material, the market is divided into HDPE, PP, polyester, and polymeric alloys/others. Based on application, the market is categorized into slope protection, load support, earth reinforcement (embankments/retaining), channel protection, and tree-root/landscaping. By end-user sector, the market includes transportation (roads, rails, ports), environmental & water (slopes, channels, shorelines), industrial & mining, and defense & others. Regionally, the market is divided into Asia Pacific, North America, Europe, Latin America, and the Middle East & Africa.
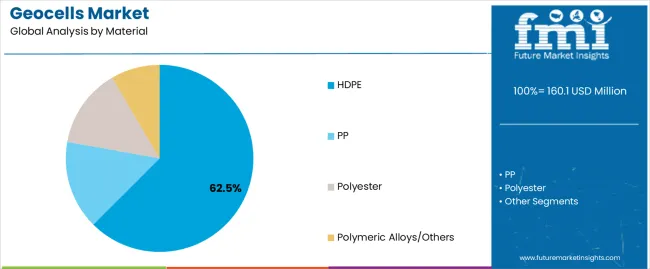
The HDPE material segment is projected to maintain its leading position in the geocells market in 2025 with 62.5% market share, reaffirming its role as the preferred material category for infrastructure projects, transportation applications, and soil stabilization installations.
Civil engineering contractors and infrastructure developers increasingly utilize HDPE geocells for their superior chemical resistance, excellent weatherability characteristics, and versatile application suitability across various construction sites and geotechnical conditions. HDPE geocell technology's proven effectiveness and operational durability directly address the industry requirements for efficient load distribution and consistent performance in diverse highway construction and erosion control applications.
This material segment forms the foundation of modern cellular confinement supply chains, as it represents the configuration with the greatest structural integrity and established performance record across multiple transportation infrastructure projects and environmental protection applications.
Infrastructure developer investments in HDPE geocell procurement continue to strengthen adoption among construction teams and project managers. With civil engineering applications requiring reliable performance and long-term durability, HDPE geocells align with both technical objectives and project specifications, making them the central component of comprehensive soil stabilization strategies.
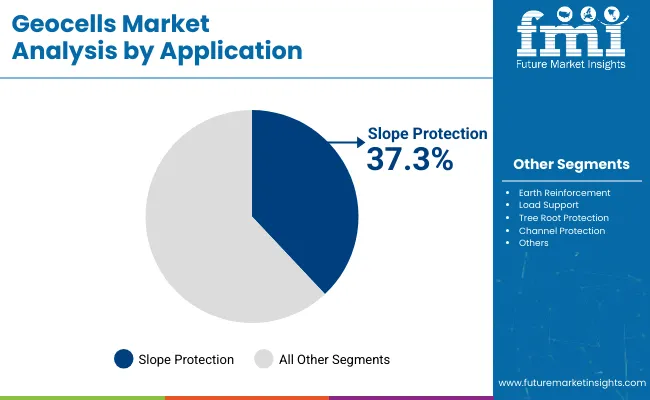
The slope protection application segment is projected to represent the largest share of geocells demand in 2025 with 37.3% market share, underscoring its critical role as the primary driver for specialized cellular confinement adoption across highway embankments, hillside stabilization, and erosion control operations. Infrastructure developers prefer geocells for slope protection due to their reliable soil confinement performance, consistent erosion resistance, and ability to ensure continuous slope stability while supporting construction efficiency and project specifications. Positioned as essential geosynthetic solutions for modern slope engineering operations, geocells offer both operational advantages and safety benefits.
The segment is supported by continuous innovation in cellular design technologies and the growing availability of specialized installation equipment that enables effective slope stabilization with enhanced drainage control and construction efficiency. Additionally, transportation authorities are investing in comprehensive slope protection programs to support large-scale highway construction requirements and climate resilience objectives. As infrastructure projects become more sophisticated and environmental standards increase, the slope protection application will continue to dominate the market while supporting advanced cellular confinement utilization and construction optimization strategies.
The Asia Pacific regional segment is projected to represent the largest share of geocells demand in 2025 with 36.0% market share, reflecting its critical role as the primary driver for infrastructure development and transportation project adoption across highway construction, railway embankments, and erosion control installations.
Regional governments prefer geocell solutions for infrastructure projects due to their excellent cost-effectiveness, rapid installation capabilities, and ability to support construction schedules while ensuring project reliability and performance specifications. Positioned as essential materials for modern infrastructure development, geocells offer both technical advantages and economic benefits.
This regional segment drives innovation in cellular confinement applications and project specifications, as Asia Pacific infrastructure demands increasingly sophisticated soil stabilization solutions for mega-projects and mountainous terrain developments. The segment is supported by the growing infrastructure investment and continuous technological advancement in construction methodologies. Additionally, governments are investing in comprehensive transportation development programs to support high-volume construction requirements and economic growth objectives. With infrastructure applications requiring superior performance and efficient installation, geocells align with both project requirements and budget constraints, ensuring continued market leadership.
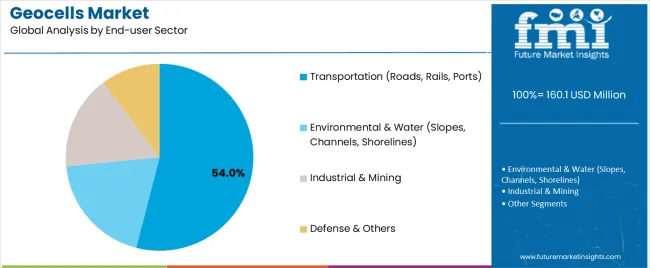
The transportation end-user sector segment is projected to represent the largest share of geocells demand in 2025 with 54.0% market share, reflecting its critical role as the primary driver for highway pavement support, railway embankment stabilization, and port infrastructure development.
Transportation authorities prefer geocells for infrastructure construction due to their excellent load distribution properties, proven performance reliability, and ability to extend pavement life while ensuring structural stability and maintenance efficiency. Positioned as essential solutions for modern transportation infrastructure, geocells offer both engineering advantages and lifecycle cost benefits.
This end-use segment drives innovation in cellular confinement design and installation methodologies, as transportation infrastructure demands increasingly stringent performance requirements for heavy traffic loads and adverse soil conditions. The segment is supported by the growing transportation network expansion and continuous investment in infrastructure rehabilitation.
Additionally, highway authorities are investing in comprehensive pavement preservation programs to support long-term performance objectives and budget optimization. With transportation applications requiring superior structural support and proven durability, geocells align with both engineering standards and economic considerations, ensuring continued market leadership.
The geocells market is advancing steadily due to increasing demand for transportation infrastructure development and growing adoption of specialized geosynthetic solutions that provide enhanced soil stabilization efficiency and project durability across diverse highway construction, slope protection, and embankment reinforcement applications.
However, the market faces challenges, including competition from traditional reinforcement methods such as geogrid and geotextile alternatives, project budget constraints and procurement complexities in developing markets, and limited awareness among smaller contractors regarding cellular confinement benefits and installation techniques. Innovation in high-modulus polymer formulations and recycled-content integration continues to influence product development and market expansion patterns.
The growing adoption of advanced polymer formulation technologies and high-modulus materials is enabling infrastructure developers to achieve enhanced structural performance, improved load distribution capabilities, and comprehensive durability characteristics for heavy-traffic and challenging soil applications.
High-stiffness HDPE compounds and modified polymer alloys provide improved dimensional stability while allowing more effective stress distribution and consistent long-term performance across various geotechnical conditions and loading scenarios.
Manufacturers are increasingly recognizing the competitive advantages of material innovation for performance differentiation and project specification compliance. Major geosynthetic companies are establishing dedicated research facilities and collaborating with polymer suppliers to develop next-generation cellular confinement systems with superior mechanical properties.
Modern infrastructure authorities are incorporating geocells into comprehensive rehabilitation strategies, slope stabilization initiatives, and climate adaptation projects to enhance asset longevity, reduce maintenance costs, and support environmental protection through optimized construction methodologies and proven performance characteristics.
These applications improve project outcomes while enabling new implementations, including coastal erosion defenses and stormwater management infrastructure. Infrastructure rehabilitation integration also allows agencies to support stringent sustainability requirements and budget optimization beyond traditional construction approaches. Investment in standardized specification development and contractor training programs continues to drive market penetration and competitive positioning in the global geocells market.
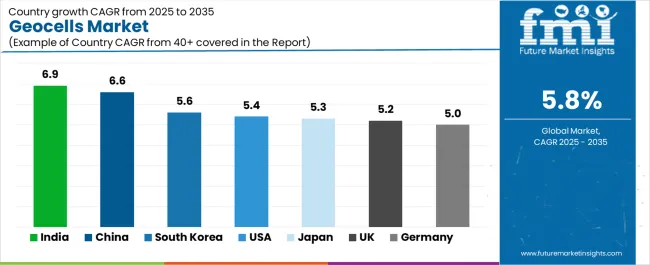
| Country | CAGR (2025 to 2035) |
|---|---|
| India | 6.9% |
| China | 6.6% |
| South Korea | 5.6% |
| United States | 5.4% |
| Japan | 5.3% |
| United Kingdom | 5.2% |
| Germany | 5.0% |
The geocells market is experiencing solid growth globally, with India leading at a 6.9% CAGR through 2035, driven by the expanding highway infrastructure network, growing hillside stabilization requirements, and significant investment in corridor modernization and riverbank protection development.
China follows at 6.6%, supported by expressway capacity expansion, increasing high-speed rail embankment demand, and growing adoption of erosion control systems in mega-infrastructure projects. South Korea shows growth at 5.6%, emphasizing coastal erosion defense initiatives and smart-city foundation development.
The United States records 5.4%, focusing on IIJA-funded pavement rehabilitation and stormwater management infrastructure expansion. Japan demonstrates 5.3% growth, supported by disaster-mitigation slope projects and railway track-bed upgrade requirements.
The United Kingdom exhibits 5.2% growth, supported by flood defense programs and rail embankment stabilization initiatives. Germany shows 5.0% growth, emphasizing Autobahn rehabilitation and renewable energy site access road construction.
The report covers an in-depth analysis of 40+ countries top-performing countries are highlighted below.
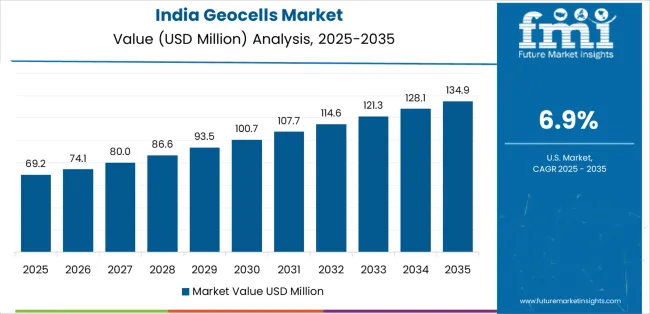
Revenue from geocells in India is projected to exhibit exceptional growth with a CAGR of 6.9% through 2035, driven by large-scale national highway expansion and rapidly growing hill-road stabilization requirements supported by government infrastructure modernization initiatives and connectivity enhancement programs.
The country's massive transportation sector development and increasing investment in erosion control projects are creating substantial demand for reliable cellular confinement solutions. Major infrastructure contractors and government agencies are establishing comprehensive geocells procurement capabilities to serve both domestic construction markets and regional project requirements.
Revenue from geocells in China is expanding at a CAGR of 6.6%, supported by the country's extensive expressway construction program, increasing demand for high-speed railway embankment solutions, and rising adoption of erosion control systems in mega-infrastructure and environmental protection applications.
The country's sophisticated construction industry and expanding transportation network are driving demand for advanced geosynthetic reinforcement solutions. International suppliers and domestic manufacturers are establishing extensive production and distribution capabilities to address the growing demand for high-performance cellular confinement systems.
Revenue from geocells in South Korea is expanding at a CAGR of 5.6%, supported by the country's comprehensive coastal protection initiatives, increasing smart-city foundation requirements, and rising demand for advanced soil stabilization solutions in urban development and environmental restoration applications. The nation's focus on climate resilience and technological innovation is driving sophisticated geosynthetic solution requirements throughout the construction sector. International suppliers and domestic engineering firms are establishing comprehensive technical support and installation capabilities to serve the expanding geocells market.
Revenue from geocells in the United States is growing at a CAGR of 5.4%, driven by expanding federal infrastructure investment programs, increasing pavement rehabilitation requirements, and growing adoption of stormwater management and shoreline protection solutions. The country's comprehensive transportation infrastructure and focus on asset preservation are supporting demand for cellular confinement systems across major construction regions. Highway contractors and municipal agencies are establishing comprehensive capabilities to serve both pavement support and environmental protection requirements.
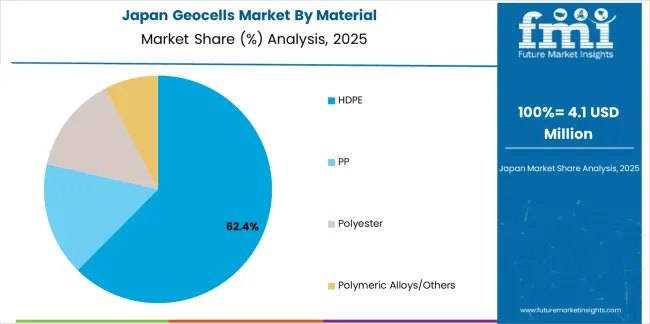
Revenue from geocells in Japan is expanding at a CAGR of 5.3%, supported by the country's focus on disaster-mitigation slope protection, railway infrastructure modernization, and strong emphasis on seismic resilience and construction quality in critical transportation applications. Japan's sophisticated engineering practices and precision construction expertise are driving demand for high-specification cellular confinement systems and specialized soil stabilization solutions. Leading construction companies are investing in specialized capabilities to serve advanced transportation, disaster prevention, and environmental protection applications.
Revenue from geocells in the United Kingdom is expanding at a CAGR of 5.2%, supported by the country's comprehensive flood defense initiatives, established railway network upgrade requirements, and steady growth in environmental protection applications across coastal and inland infrastructure. The nation's aging transportation assets and increasing climate adaptation focus are maintaining consistent demand for cellular confinement solutions. Infrastructure contractors are investing in installation capabilities and technical expertise to serve both flood management and railway embankment requirements.
Revenue from geocells in Germany is growing at a CAGR of 5.0%, driven by the country's emphasis on highway infrastructure preservation, renewable energy project access roads, and strong focus on operational efficiency in mature transportation network applications. Germany's established construction industry and focus on sustainable development are supporting steady demand for geosynthetic reinforcement solutions throughout major industrial regions. Industry leaders are establishing specialized capabilities to serve both transportation and renewable energy infrastructure requirements.
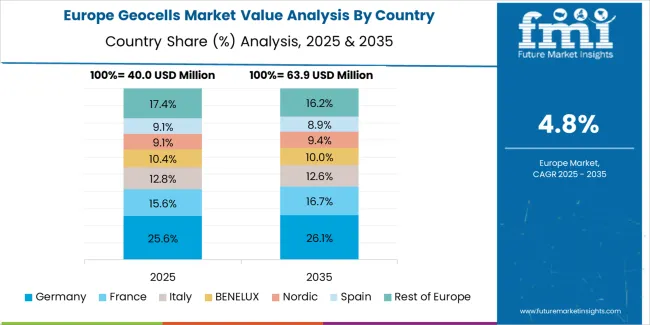
The geocells market in Europe is projected to grow steadily over the forecast period, with Western Europe accounting for the largest regional demand. Germany leads European consumption with approximately 22% market share, driven by Autobahn rehabilitation projects, wind and solar site access roads, and landfill capping applications tied to transportation and environmental infrastructure.
The country's advanced construction practices and sustainable development emphasis support consistent demand for high-performance cellular confinement systems across diverse civil engineering applications. The United Kingdom follows with about 15% of European consumption, benefiting from flood defense investments and rail embankment stabilization programs that are establishing comprehensive slope protection and erosion control capabilities for climate resilience infrastructure.
France reflects steady demand at approximately 14% market share, supported by road construction, canal protection, and coastal erosion control applications for transportation and environmental management. Italy accounts for about 12% of European geocells consumption, balancing hillside road stabilization and port infrastructure development across its diversified construction base.
Spain represents approximately 10% of European demand, growing with drought-resilient slope protection and highway reservoir infrastructure applications that support water management and transportation industries. The Nordic region (Sweden, Finland, Denmark, and Norway combined, led by Sweden and Norway) accounts for about 9% of European consumption, skewing toward shoreline protection and forestry road applications for environmental and natural resource development.
The Benelux countries (Belgium, Netherlands, and Luxembourg) maintain approximately 8% market share, supported by chemical logistics corridor infrastructure and floodplain stabilization operations serving European supply chains. The remaining approximately 10% of European geocells demand is distributed across Central and Eastern Europe, notably Poland, Czech Republic, and Hungary, where EU-funded highway and rail upgrade programs and landfill closure projects drive incremental market growth.
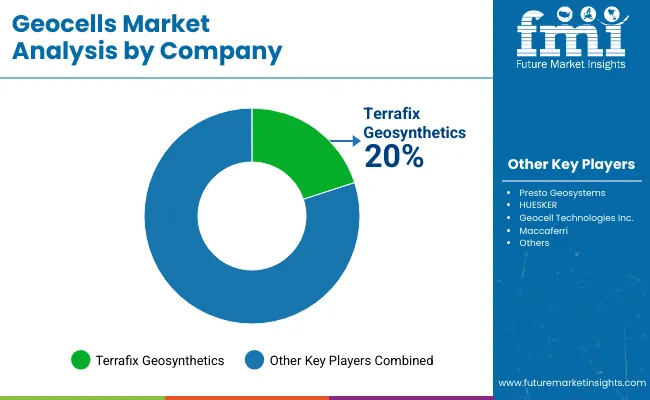
The Geocells Market is expanding steadily as infrastructure developers, mining operators, and environmental engineers increasingly rely on cellular confinement systems to stabilize soil, control erosion, and reinforce load-bearing surfaces. Geocells are being deployed across highways, railways, embankments, retaining structures, and landfill capping projects where lightweight, cost-efficient, and long-lasting ground improvement solutions are required. Their ability to reduce aggregate usage, improve drainage, and enhance the performance of weak soils is accelerating adoption, especially in regions investing heavily in transportation upgrades and climate-resilient infrastructure.
Presto Geosystems, PRS Geo-Technologies (Neoloy), and Strata Systems/Strata Geosystems lead the global landscape with high-strength polymer geocell systems engineered for demanding civil engineering applications. These companies emphasize long-term durability, improved modulus performance, and compatibility with challenging soil conditions. Maccaferri S.p.A., HUESKER, and ACE Geosynthetics maintain strong international presence through advanced geocell and geogrid technologies integrated into large-scale geotechnical projects.
Manufacturers such as TMP Geosynthetics, NAUE GmbH & Co. KG, and Terram (Berry Global) are expanding portfolios with environmentally engineered solutions designed for slope stabilization and erosion control. Geofabrics Australasia remains influential in Asia-Pacific with geocells optimized for mining haul roads, soft soil reinforcement, and coastal protection. As sustainable construction practices rise, geocell adoption is expected to accelerate across global infrastructure and environmental restoration projects.
Geocells represent a specialized three-dimensional cellular confinement geosynthetic system within soil stabilization and infrastructure development, projected to grow from USD 160.1 million in 2025 to USD 281.4 million by 2035 at a 5.8% CAGR. This cellular honeycomb structure, primarily supplied in HDPE material form for load distribution applications, serves as an essential reinforcement solution for slope protection, highway embankments, erosion control, and railway infrastructure across transportation, environmental, and industrial construction sectors.
Market expansion is driven by increasing transportation infrastructure development, growing demand for sustainable soil stabilization techniques, expanding climate resilience programs, and rising emphasis on cost-effective construction solutions in diverse civil engineering applications.
Geosynthetic Specification Standards: Establish comprehensive technical standards for geocells quality, including material properties, dimensional tolerances, welding integrity requirements, and performance specifications that ensure consistent structural performance in highway and slope stabilization applications.
Infrastructure Quality Frameworks: Develop regulatory frameworks that link geocells utilization to project specifications, requiring validated cellular confinement systems that meet load distribution requirements, durability standards, and support overall infrastructure performance objectives.
Installation Safety Protocols: Implement mandatory standards for geocells handling, site preparation, and installation procedures, including quality control systems, performance verification methods, and documentation requirements that ensure construction reliability and long-term performance.
Sustainable Construction Incentives: Create specialized guidelines for recycled-content integration and circular economy principles, addressing post-consumer polymer utilization, material recovery systems, and environmental benefits specific to geosynthetic reinforcement applications.
Technology Development Support: Provide regulatory support and financial incentives for research and development of next-generation cellular confinement technologies that improve structural performance, reduce installation costs, and enhance durability in transportation infrastructure applications.
Installation Best Practices: Develop comprehensive technical guidelines for geocells design, site preparation, and installation that optimize soil confinement effectiveness, minimize construction defects, and ensure reliable performance across different soil conditions and loading scenarios.
Quality Management Protocols: Establish standardized testing procedures, analytical methods, and quality control systems specifically designed for geocells assessment in infrastructure construction environments with diverse geotechnical conditions and project specifications.
Performance Benchmarking Systems: Create industry-wide metrics for cellular confinement effectiveness, installation efficiency, and long-term durability that enable comparative analysis, identify best practices, and drive continuous improvement across construction projects.
Professional Training and Certification: Develop specialized training programs for civil engineers, construction managers, and installation crews covering geocells design principles, soil mechanics integration, and installation optimization in infrastructure applications.
Technology Innovation Partnerships: Facilitate collaboration between infrastructure developers, geosynthetic manufacturers, and research institutions to advance cellular confinement development and address emerging challenges in climate resilience and sustainable construction practices.
Advanced Material Engineering: Invest in research and development of high-modulus polymer formulations, improved welding technologies, and optimized cellular geometries that enable superior load distribution while reducing material costs and enhancing installation efficiency.
Sustainable Production Integration: Develop recycled-content capabilities with integrated polymer recovery technologies, post-consumer material processing, and circular feedstock utilization that support environmental objectives while maintaining structural performance and cost competitiveness.
Quality Assurance Excellence: Engineer comprehensive testing capabilities with validated performance verification systems, advanced quality control protocols, and standardized testing methods that ensure consistent product specifications while reducing manufacturing variation and customer concerns.
Supply Chain Optimization: Create flexible manufacturing platforms with strategically located production facilities, reliable logistics networks, and responsive technical support that ensure product availability while minimizing delivery times and installation delays.
Global Market Expansion: Establish comprehensive regional capabilities providing installation support, application engineering, and customer collaboration that optimize geocells utilization across diverse infrastructure applications and geographic markets.
Strategic Material Selection: Conduct comprehensive assessments of soil conditions, loading requirements, and project specifications to optimize geocells procurement strategies while ensuring construction quality and long-term performance objectives.
Advanced Installation Management: Implement quality control systems, trained installation crews, and performance monitoring capabilities to optimize cellular confinement placement, reduce construction defects, and improve overall project efficiency.
Performance Verification Integration: Utilize field testing protocols, load monitoring systems, and post-construction assessment to ensure infrastructure performance while minimizing maintenance requirements and lifecycle costs.
Sustainability Implementation: Integrate recycled-content geocells, environmental protection measures, and circular economy principles with conventional construction practices to enhance project sustainability while maintaining structural specifications and budget constraints.
Technology Adoption Planning: Develop systematic strategies that incorporate advanced cellular confinement systems, improved installation methodologies, and performance optimization while maintaining project schedules and managing construction costs effectively.
Comprehensive Design Services: Provide specialized engineering services for geocells system design, soil-structure interaction analysis, and performance optimization that address unique site requirements, loading conditions, and project constraints.
Performance Analysis and Improvement: Conduct detailed assessments of proposed cellular confinement applications, identify optimization opportunities, and develop design strategies that enhance structural efficiency, reduce costs, and improve long-term performance.
Technology Integration Services: Offer expertise in integrating geocells with complementary geosynthetics, drainage systems, and construction equipment that optimize overall infrastructure performance and installation efficiency.
Regulatory Compliance Support: Provide specialized knowledge of infrastructure standards, environmental regulations, and industry requirements to ensure design specifications and installation practices meet all applicable requirements and performance criteria.
Economic Analysis Services: Develop comprehensive cost models that evaluate total project costs, including material expenses, installation costs, maintenance requirements, and lifecycle performance to support informed decision-making.
Manufacturing Capacity Financing: Provide capital for new geocells production facilities, capacity expansions, and technology modernization projects that drive market growth while supporting global infrastructure development requirements.
Recycling Technology Investment: Finance development of breakthrough polymer recovery technologies, including post-consumer processing systems, material purification capabilities, and recycled-content integration that advance circular economy principles and sustainable manufacturing.
Installation Excellence Support: Support construction contractors in implementing advanced installation equipment, establishing quality management systems, and developing operational excellence capabilities that improve competitiveness while ensuring project quality.
Sustainable Technology Financing: Fund bio-based polymer development, renewable energy integration, and emissions reduction technologies that enhance environmental performance while maintaining production economics and product specifications.
Emerging Market Development: Provide financing and technical assistance for infrastructure development in emerging economies, creating new markets for geosynthetic solutions while supporting transportation modernization and economic growth initiatives.
| Items | Values |
|---|---|
| Quantitative Units (2025) | USD 160.1 million |
| Material | HDPE, PP, Polyester, Polymeric Alloys/Others |
| Application | Slope Protection, Load Support, Earth Reinforcement (Embankments/Retaining), Channel Protection, Tree-root/Landscaping |
| End-user Sector | Transportation (Roads, Rails, Ports), Environmental & Water (Slopes, Channels, Shorelines), Industrial & Mining, Defense & Others |
| Regions Covered | Asia Pacific, North America, Europe, Latin America, Middle East & Africa |
| Countries Covered | China, India, Japan, South Korea, United States, United Kingdom, Germany, and 40+ countries |
| Key Companies Profiled | Presto Geosystems, PRS Geo-Technologies (Neoloy), Strata Systems/Strata Geosystems, Maccaferri S.p.A., HUESKER, ACE Geosynthetics, TMP Geosynthetics, NAUE GmbH & Co. KG, Terram (Berry Global), Geofabrics Australasia |
| Additional Attributes | Dollar sales by material, application, and end-user sector category, regional demand trends, competitive landscape, technological advancements in polymer formulations, standardization development, sustainable manufacturing innovation, and installation efficiency optimization |
The global geocells market is estimated to be valued at USD 160.1 million in 2025.
The market size for the geocells market is projected to reach USD 281.4 million by 2035.
The geocells market is expected to grow at a 5.8% CAGR between 2025 and 2035.
The key product types in geocells market are hdpe, pp, polyester and polymeric alloys/others.
In terms of application, slope protection segment to command 37.3% share in the geocells market in 2025.


Our Research Products

The "Full Research Suite" delivers actionable market intel, deep dives on markets or technologies, so clients act faster, cut risk, and unlock growth.

The Leaderboard benchmarks and ranks top vendors, classifying them as Established Leaders, Leading Challengers, or Disruptors & Challengers.

Locates where complements amplify value and substitutes erode it, forecasting net impact by horizon

We deliver granular, decision-grade intel: market sizing, 5-year forecasts, pricing, adoption, usage, revenue, and operational KPIs—plus competitor tracking, regulation, and value chains—across 60 countries broadly.

Spot the shifts before they hit your P&L. We track inflection points, adoption curves, pricing moves, and ecosystem plays to show where demand is heading, why it is changing, and what to do next across high-growth markets and disruptive tech

Real-time reads of user behavior. We track shifting priorities, perceptions of today’s and next-gen services, and provider experience, then pace how fast tech moves from trial to adoption, blending buyer, consumer, and channel inputs with social signals (#WhySwitch, #UX).

Partner with our analyst team to build a custom report designed around your business priorities. From analysing market trends to assessing competitors or crafting bespoke datasets, we tailor insights to your needs.
Supplier Intelligence
Discovery & Profiling
Capacity & Footprint
Performance & Risk
Compliance & Governance
Commercial Readiness
Who Supplies Whom
Scorecards & Shortlists
Playbooks & Docs
Category Intelligence
Definition & Scope
Demand & Use Cases
Cost Drivers
Market Structure
Supply Chain Map
Trade & Policy
Operating Norms
Deliverables
Buyer Intelligence
Account Basics
Spend & Scope
Procurement Model
Vendor Requirements
Terms & Policies
Entry Strategy
Pain Points & Triggers
Outputs
Pricing Analysis
Benchmarks
Trends
Should-Cost
Indexation
Landed Cost
Commercial Terms
Deliverables
Brand Analysis
Positioning & Value Prop
Share & Presence
Customer Evidence
Go-to-Market
Digital & Reputation
Compliance & Trust
KPIs & Gaps
Outputs
Full Research Suite comprises of:
Market outlook & trends analysis
Interviews & case studies
Strategic recommendations
Vendor profiles & capabilities analysis
5-year forecasts
8 regions and 60+ country-level data splits
Market segment data splits
12 months of continuous data updates
DELIVERED AS:
PDF EXCEL ONLINE

Thank you!
You will receive an email from our Business Development Manager. Please be sure to check your SPAM/JUNK folder too.
Chat With
MaRIA