Haptic Touchscreen Market Size and Share Forecast Outlook 2025 to 2035

The Haptic Touchscreen Market is estimated to be valued at USD 20.1 billion in 2025 and is projected to reach USD 76.0 billion by 2035, registering a compound annual growth rate (CAGR) of 14.2% over the forecast period.
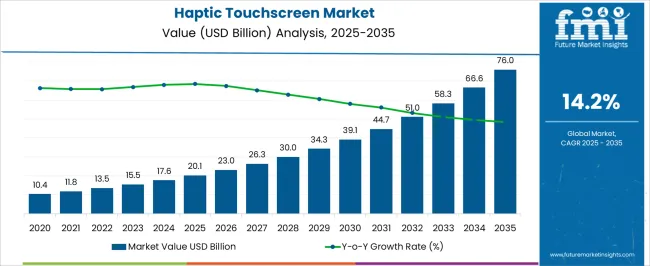
Quick Stats for Haptic Touchscreen Market

  • Haptic Touchscreen Market Value (2025): USD 20.1 billion
  • Haptic Touchscreen Market Forecast Value (2035): USD 76.0 billion
  • Haptic Touchscreen Market Forecast CAGR: 14.2%
  • Leading Segment in Haptic Touchscreen Market in 2025: Hardware (49.6%)
  • Key Growth Regions in Haptic Touchscreen Market: North America, Asia-Pacific, Europe
  • Top Key Players in Haptic Touchscreen Market: Synaptics Incorporated, Ultraleap Limited, AAC Technologies Holdings Inc., Qualcomm Technologies, Inc., Immersion Corporation, TDK Corporation, AAC Technologies, Haption, Apple Inc., Delta Electronics, GoerTek Inc., Rivian Automotive, Inc.

Haptic Touchscreen Market Market Value Analysis

Haptic Touchscreen Market Key Takeaways

Metric Value
Haptic Touchscreen Market Estimated Value in (2025 E) USD 20.1 billion
Haptic Touchscreen Market Forecast Value in (2035 F) USD 76.0 billion
Forecast CAGR (2025 to 2035) 14.2%

Why is the Haptic Touchscreen Market Growing?

The Haptic Touchscreen market is experiencing robust growth driven by the rising demand for immersive and interactive user experiences across consumer electronics, enterprise applications, and industrial interfaces. The current market environment is shaped by increasing adoption of tactile feedback technologies in devices where intuitive interaction and precision are critical. Advancements in haptic actuator design, multi-touch sensitivity, and software-driven feedback systems have enhanced the usability and responsiveness of touchscreens, making them essential in both consumer and professional contexts.

As mobile devices, tablets, and enterprise touch-enabled applications proliferate globally, demand for haptic solutions continues to expand. Investments in research and development to improve durability, accuracy, and energy efficiency of haptic modules are facilitating market expansion.

The growing need for ergonomically optimized interfaces in corporate environments, alongside rising expectations for enhanced user engagement in mobile devices, is providing sustained growth opportunities Future market potential is further bolstered by increasing integration of haptic touchscreens in collaborative tools, enterprise solutions, and interactive applications, highlighting the technology’s strategic value across industries.

Segmental Analysis

The haptic touchscreen market is segmented by component, application, end users, technology, industry, and geographic regions. By component, haptic touchscreen market is divided into Hardware, Software, and Services. In terms of application, haptic touchscreen market is classified into Mobile Devices, Video Games, Personal Computers, Automated Teller Machines, Tele-Operators And Simulators, Virtual Reality, Ticketing Counters, Robotics, Biometric Devices, Arts, Design And Handwriting, Holographic Interaction, and Others. Based on end users, haptic touchscreen market is segmented into Corporates, Security Departments, Supermarkets And Malls, Educational Institutes, and Others. By technology, haptic touchscreen market is segmented into Contact Haptic Technology and Non-Contact Haptic Technology. By industry, haptic touchscreen market is segmented into Electronics, Robotic, Automobile, Financial, Healthcare, and Others. Regionally, the haptic touchscreen industry is classified into North America, Latin America, Western Europe, Eastern Europe, Balkan & Baltic Countries, Russia & Belarus, Central Asia, East Asia, South Asia & Pacific, and the Middle East & Africa.
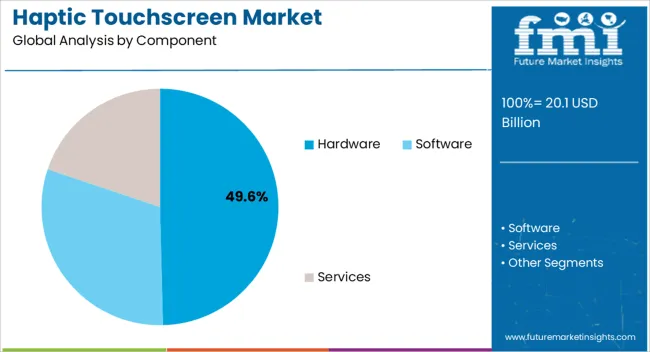
Insights into the Hardware Component Segment

Haptic Touchscreen Market Analysis By Component

The hardware component segment is projected to hold 49.60% of the Haptic Touchscreen market revenue in 2025, making it the leading component type. This dominance is being attributed to the essential role of tactile actuators, sensors, and supporting circuitry in delivering precise haptic feedback. Hardware reliability and sensitivity directly influence user perception, and the ongoing focus on miniaturization and energy-efficient actuators has further driven adoption.

The growth of this segment has been accelerated by the rising integration of haptic modules in mobile devices and corporate interfaces, where performance, durability, and responsiveness are critical. The modular design of haptic hardware allows seamless integration with various touchscreen formats and device sizes, enabling consistent user experiences across applications.

Additionally, hardware improvements have enhanced the compatibility of touchscreens with software-based gesture recognition and adaptive feedback systems As end users increasingly demand more interactive and immersive experiences, the hardware component segment is expected to maintain leadership due to its foundational role in the effectiveness and adoption of haptic touchscreen technology.
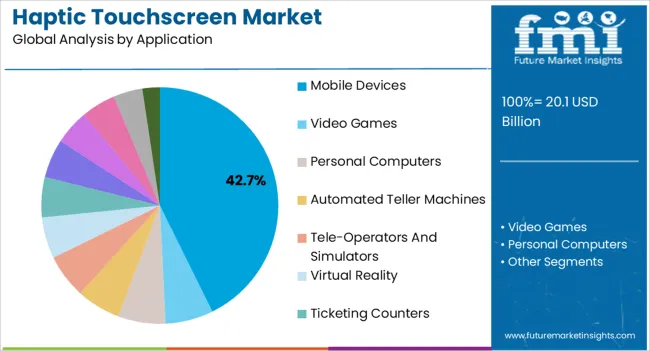
Insights into the Mobile Devices Application Segment

Haptic Touchscreen Market Analysis By Application

The mobile devices application segment is anticipated to account for 42.70% of the Haptic Touchscreen market revenue in 2025, making it the leading application. The prominence of this segment is being driven by the widespread adoption of smartphones, tablets, and wearable devices that prioritize enhanced user interaction and tactile feedback.

Mobile devices benefit from haptic technology through improved typing accuracy, immersive gaming experiences, and gesture-based control, which enhance the overall user interface experience. Growth has been accelerated by consumer preference for premium interactive features and the rising demand for devices that offer intuitive feedback without additional peripherals.

Additionally, the integration of haptic touchscreens into mobile devices supports accessibility features and multi-sensory interaction, increasing their appeal across diverse user demographics As smartphone penetration rises and mobile technology continues to evolve, the mobile devices application segment is expected to sustain its leading position, supported by continuous innovation in haptic feedback mechanisms and consumer expectations for high-quality, interactive touch interfaces.
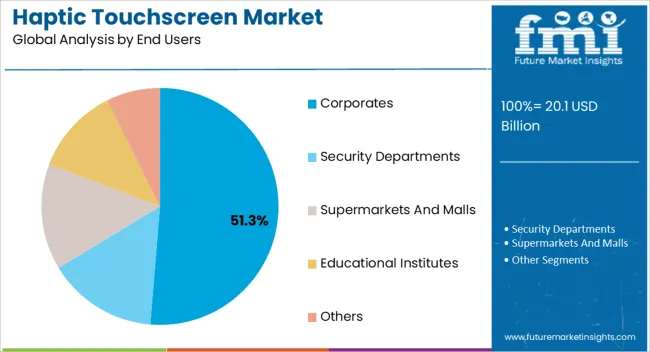
Insights into the Corporate End Users Segment

Haptic Touchscreen Market Analysis By End Users

The corporate end users segment is projected to hold 51.30% of the Haptic Touchscreen market revenue in 2025, establishing it as the leading end-use industry. This dominance is being attributed to the growing deployment of touch-enabled collaborative tools, enterprise devices, and professional control panels where precise interaction is crucial.

Corporates benefit from haptic touchscreens in conference systems, interactive kiosks, point-of-sale devices, and productivity tools, enhancing operational efficiency and user satisfaction. The growth of this segment has been accelerated by the need for ergonomic and responsive touch interfaces that minimize input errors and provide intuitive control.

Additionally, software-driven updates in haptic systems allow corporate installations to remain adaptable and scalable without significant hardware replacement As organizations increasingly invest in interactive workplace technologies and digital transformation initiatives, the corporate segment is expected to continue leading due to the enhanced productivity, employee engagement, and operational advantages provided by haptic touchscreen solutions.

Market Overview

Haptic Touchscreen Market Overview

Humans always expect any feedback (something in return) for the stimuli, letting them know that the message was received or not. The same is in the case of the Haptic Touchscreen. Haptic Touchscreen recreates the sense of touch by applying forces, vibrations, or motions to the user. Various haptic displays are becoming available for implementing a new kind of human-computer interaction (HCI) method.

A Haptic Touchscreen finds its frequent application in the mobile phone industry giving significant growth to Haptic Touchscreen Market. Haptic Touchscreen market is witnessing a high growth owing to its increasing applications in several new industries such as medical, ARVR, digital advertising, and others.

Also, several companies in the market are investing in the development of Haptic Touchscreen technologies to introduce better and efficient solutions for enhanced user experience. During the forecast period with the upcoming advanced technologies, Haptic Touchscreen is expected to be used in most of the electronics and optoelectronics devices which give better growth opportunities to the Haptic Touchscreen Market.
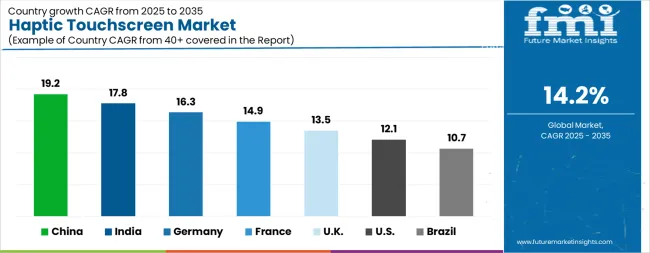
Analysis of Haptic Touchscreen Market By Key Countries

Haptic Touchscreen Market Cagr Analysis By Country

Country CAGR
China 19.2%
India 17.8%
Germany 16.3%
France 14.9%
U.K. 13.5%
U.S. 12.1%
Brazil 10.7%

Country-wise Analysis

The Haptic Touchscreen Market is expected to register a CAGR of 14.2% during the forecast period, exhibiting varied country level momentum. China leads with the highest CAGR of 19.2%, followed by India at 17.8%. Developed markets such as Germany, France, and the U.K. continue to expand steadily, while the U.S. is likely to grow at consistent rates. Brazil posts the lowest CAGR at 10.7%, yet still underscores a broadly positive trajectory for the global Haptic Touchscreen Market. In 2024, Germany held a dominant revenue in the Western Europe market and is expected to grow with a CAGR of 16.3%. The U.S. Haptic Touchscreen Market is estimated to be valued at USD 7.1 billion in 2025 and is anticipated to reach a valuation of USD 22.3 billion by 2035. Sales are projected to rise at a CAGR of 12.1% over the forecast period between 2025 and 2035. While Japan and South Korea markets are estimated to be valued at USD 961.1 million and USD 536.2 million respectively in 2025.
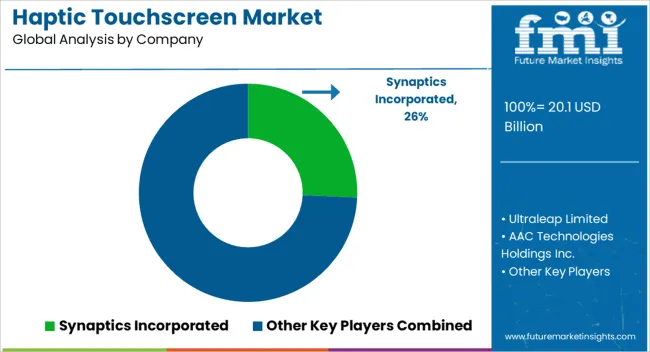
Key Players in the Haptic Touchscreen Market

Haptic Touchscreen Market Analysis By Company

  • Synaptics Incorporated
  • Ultraleap Limited
  • AAC Technologies Holdings Inc.
  • Qualcomm Technologies, Inc.
  • Immersion Corporation
  • TDK Corporation
  • AAC Technologies
  • Haption
  • Apple Inc.
  • Delta Electronics
  • GoerTek Inc.
  • Rivian Automotive, Inc.

Scope of the Report

Item Value
Quantitative Units USD 20.1 Billion
Component Hardware, Software, and Services
Application Mobile Devices, Video Games, Personal Computers, Automated Teller Machines, Tele-Operators And Simulators, Virtual Reality, Ticketing Counters, Robotics, Biometric Devices, Arts, Design And Handwriting, Holographic Interaction, and Others
End Users Corporates, Security Departments, Supermarkets And Malls, Educational Institutes, and Others
Technology Contact Haptic Technology and Non-Contact Haptic Technology
Industry Electronics, Robotic, Automobile, Financial, Healthcare, and Others
Regions Covered North America, Europe, Asia-Pacific, Latin America, Middle East & Africa
Country Covered United States, Canada, Germany, France, United Kingdom, China, Japan, India, Brazil, South Africa
Key Companies Profiled Synaptics Incorporated, Ultraleap Limited, AAC Technologies Holdings Inc., Qualcomm Technologies, Inc., Immersion Corporation, TDK Corporation, AAC Technologies, Haption, Apple Inc., Delta Electronics, GoerTek Inc., and Rivian Automotive, Inc.

Haptic Touchscreen Market by Segments

Component:

  • Hardware
  • Software
  • Services

Application:

  • Mobile Devices
  • Video Games
  • Personal Computers
  • Automated Teller Machines
  • Tele-Operators And Simulators
  • Virtual Reality
  • Ticketing Counters
  • Robotics
  • Biometric Devices
  • Arts, Design And Handwriting
  • Holographic Interaction
  • Others

End Users:

  • Corporates
  • Security Departments
  • Supermarkets And Malls
  • Educational Institutes
  • Others

Technology:

  • Contact Haptic Technology
  • Non-Contact Haptic Technology

Industry:

  • Electronics
  • Robotic
  • Automobile
  • Financial
  • Healthcare
  • Others

Region:

  • North America
    • U.S.
    • Canada
    • Mexico
  • Latin America
    • Brazil
    • Chile
    • Rest of Latin America
  • Western Europe
    • Germany
    • U.K.
    • Italy
    • Spain
    • France
    • Nordic
    • BENELUX
    • Rest of Western Europe
  • Eastern Europe
    • Russia
    • Poland
    • Hungary
    • Balkan & Baltic
    • Rest of Eastern Europe
  • East Asia
    • China
    • Japan
    • South Korea
  • South Asia and Pacific
    • India
    • ASEAN
    • Australia & New Zealand
    • Rest of South Asia and Pacific
  • Middle East & Africa
    • Kingdom of Saudi Arabia
    • Other GCC Countries
    • Turkiye
    • South Africa
    • Other African Union
    • Rest of Middle East & Africa

Table of Content

  1. Executive Summary
    • Global Market Outlook
    • Demand-side Trends
    • Supply-side Trends
    • Technology Roadmap Analysis
    • Analysis and Recommendations
  2. Market Overview
    • Market Coverage / Taxonomy
    • Market Definition / Scope / Limitations
  3. Market Background
    • Market Dynamics
      • Drivers
      • Restraints
      • Opportunity
      • Trends
    • Scenario Forecast
      • Demand in Optimistic Scenario
      • Demand in Likely Scenario
      • Demand in Conservative Scenario
    • Opportunity Map Analysis
    • Product Life Cycle Analysis
    • Supply Chain Analysis
    • Investment Feasibility Matrix
    • Value Chain Analysis
    • PESTLE and Porter’s Analysis
    • Regulatory Landscape
    • Regional Parent Market Outlook
    • Production and Consumption Statistics
    • Import and Export Statistics
  4. Global Haptic Touchscreen Market Analysis 2020-2024 and Forecast, 2025-2035
    • Historical Market Size Value (USD Mn) Analysis, 2020-2024
    • Current and Future Market Size Value (USD Mn) Projections, 2025-2035
      • Y-o-Y Growth Trend Analysis
      • Absolute $ Opportunity Analysis
  5. Global Haptic Touchscreen Market Pricing Analysis 2020-2024 and Forecast 2025-2035
  6. Global Haptic Touchscreen Market Analysis 2020-2024 and Forecast 2025-2035, By Component
    • Introduction / Key Findings
    • Historical Market Size Value (USD Mn) Analysis By Component , 2020-2024
    • Current and Future Market Size Value (USD Mn) Analysis and Forecast By Component , 2025-2035
      • Hardware
      • Software
      • Services
    • Y-o-Y Growth Trend Analysis By Component , 2020-2024
    • Absolute $ Opportunity Analysis By Component , 2025-2035
  7. Global Haptic Touchscreen Market Analysis 2020-2024 and Forecast 2025-2035, By Application
    • Introduction / Key Findings
    • Historical Market Size Value (USD Mn) Analysis By Application, 2020-2024
    • Current and Future Market Size Value (USD Mn) Analysis and Forecast By Application, 2025-2035
      • Mobile Devices
      • Video Games
      • Personal Computers
      • Automated Teller Machines
      • Tele-Operators And Simulators
      • Virtual Reality
      • Ticketing Counters
      • Robotics
      • Biometric Devices
      • Arts, Design And Handwriting
      • Holographic Interaction
    • Y-o-Y Growth Trend Analysis By Application, 2020-2024
    • Absolute $ Opportunity Analysis By Application, 2025-2035
  8. Global Haptic Touchscreen Market Analysis 2020-2024 and Forecast 2025-2035, By End Users
    • Introduction / Key Findings
    • Historical Market Size Value (USD Mn) Analysis By End Users, 2020-2024
    • Current and Future Market Size Value (USD Mn) Analysis and Forecast By End Users, 2025-2035
      • Corporates
      • Security Departments
      • Supermarkets And Malls
      • Educational Institutes
      • Others
    • Y-o-Y Growth Trend Analysis By End Users, 2020-2024
    • Absolute $ Opportunity Analysis By End Users, 2025-2035
  9. Global Haptic Touchscreen Market Analysis 2020-2024 and Forecast 2025-2035, By Technology
    • Introduction / Key Findings
    • Historical Market Size Value (USD Mn) Analysis By Technology, 2020-2024
    • Current and Future Market Size Value (USD Mn) Analysis and Forecast By Technology, 2025-2035
      • Contact Haptic Technology
      • Non-Contact Haptic Technology
    • Y-o-Y Growth Trend Analysis By Technology, 2020-2024
    • Absolute $ Opportunity Analysis By Technology, 2025-2035
  10. Global Haptic Touchscreen Market Analysis 2020-2024 and Forecast 2025-2035, By Industry
    • Introduction / Key Findings
    • Historical Market Size Value (USD Mn) Analysis By Industry, 2020-2024
    • Current and Future Market Size Value (USD Mn) Analysis and Forecast By Industry, 2025-2035
      • Electronics
      • Robotic
      • Automobile
      • Financial
      • Healthcare
      • Others
    • Y-o-Y Growth Trend Analysis By Industry, 2020-2024
    • Absolute $ Opportunity Analysis By Industry, 2025-2035
  11. Global Haptic Touchscreen Market Analysis 2020-2024 and Forecast 2025-2035, By Region
    • Introduction
    • Historical Market Size Value (USD Mn) Analysis By Region, 2020-2024
    • Current Market Size Value (USD Mn) Analysis and Forecast By Region, 2025-2035
      • North America
      • Latin America
      • Western Europe
      • Eastern Europe
      • East Asia
      • South Asia and Pacific
      • Middle East & Africa
    • Market Attractiveness Analysis By Region
  12. North America Haptic Touchscreen Market Analysis 2020-2024 and Forecast 2025-2035, By Country
    • Historical Market Size Value (USD Mn) Trend Analysis By Market Taxonomy, 2020-2024
    • Market Size Value (USD Mn) Forecast By Market Taxonomy, 2025-2035
      • By Country
        • U.S.
        • Canada
        • Mexico
      • By Component
      • By Application
      • By End Users
      • By Technology
      • By Industry
    • Market Attractiveness Analysis
      • By Country
      • By Component
      • By Application
      • By End Users
      • By Technology
      • By Industry
    • Key Takeaways
  13. Latin America Haptic Touchscreen Market Analysis 2020-2024 and Forecast 2025-2035, By Country
    • Historical Market Size Value (USD Mn) Trend Analysis By Market Taxonomy, 2020-2024
    • Market Size Value (USD Mn) Forecast By Market Taxonomy, 2025-2035
      • By Country
        • Brazil
        • Chile
        • Rest of Latin America
      • By Component
      • By Application
      • By End Users
      • By Technology
      • By Industry
    • Market Attractiveness Analysis
      • By Country
      • By Component
      • By Application
      • By End Users
      • By Technology
      • By Industry
    • Key Takeaways
  14. Western Europe Haptic Touchscreen Market Analysis 2020-2024 and Forecast 2025-2035, By Country
    • Historical Market Size Value (USD Mn) Trend Analysis By Market Taxonomy, 2020-2024
    • Market Size Value (USD Mn) Forecast By Market Taxonomy, 2025-2035
      • By Country
        • Germany
        • U.K.
        • Italy
        • Spain
        • France
        • Nordic
        • BENELUX
        • Rest of Western Europe
      • By Component
      • By Application
      • By End Users
      • By Technology
      • By Industry
    • Market Attractiveness Analysis
      • By Country
      • By Component
      • By Application
      • By End Users
      • By Technology
      • By Industry
    • Key Takeaways
  15. Eastern Europe Haptic Touchscreen Market Analysis 2020-2024 and Forecast 2025-2035, By Country
    • Historical Market Size Value (USD Mn) Trend Analysis By Market Taxonomy, 2020-2024
    • Market Size Value (USD Mn) Forecast By Market Taxonomy, 2025-2035
      • By Country
        • Russia
        • Poland
        • Hungary
        • Balkan & Baltic
        • Rest of Eastern Europe
      • By Component
      • By Application
      • By End Users
      • By Technology
      • By Industry
    • Market Attractiveness Analysis
      • By Country
      • By Component
      • By Application
      • By End Users
      • By Technology
      • By Industry
    • Key Takeaways
  16. East Asia Haptic Touchscreen Market Analysis 2020-2024 and Forecast 2025-2035, By Country
    • Historical Market Size Value (USD Mn) Trend Analysis By Market Taxonomy, 2020-2024
    • Market Size Value (USD Mn) Forecast By Market Taxonomy, 2025-2035
      • By Country
        • China
        • Japan
        • South Korea
      • By Component
      • By Application
      • By End Users
      • By Technology
      • By Industry
    • Market Attractiveness Analysis
      • By Country
      • By Component
      • By Application
      • By End Users
      • By Technology
      • By Industry
    • Key Takeaways
  17. South Asia and Pacific Haptic Touchscreen Market Analysis 2020-2024 and Forecast 2025-2035, By Country
    • Historical Market Size Value (USD Mn) Trend Analysis By Market Taxonomy, 2020-2024
    • Market Size Value (USD Mn) Forecast By Market Taxonomy, 2025-2035
      • By Country
        • India
        • ASEAN
        • Australia & New Zealand
        • Rest of South Asia and Pacific
      • By Component
      • By Application
      • By End Users
      • By Technology
      • By Industry
    • Market Attractiveness Analysis
      • By Country
      • By Component
      • By Application
      • By End Users
      • By Technology
      • By Industry
    • Key Takeaways
  18. Middle East & Africa Haptic Touchscreen Market Analysis 2020-2024 and Forecast 2025-2035, By Country
    • Historical Market Size Value (USD Mn) Trend Analysis By Market Taxonomy, 2020-2024
    • Market Size Value (USD Mn) Forecast By Market Taxonomy, 2025-2035
      • By Country
        • Kingdom of Saudi Arabia
        • Other GCC Countries
        • Turkiye
        • South Africa
        • Other African Union
        • Rest of Middle East & Africa
      • By Component
      • By Application
      • By End Users
      • By Technology
      • By Industry
    • Market Attractiveness Analysis
      • By Country
      • By Component
      • By Application
      • By End Users
      • By Technology
      • By Industry
    • Key Takeaways
  19. Key Countries Haptic Touchscreen Market Analysis
    • U.S.
      • Pricing Analysis
      • Market Share Analysis, 2024
        • By Component
        • By Application
        • By End Users
        • By Technology
        • By Industry
    • Canada
      • Pricing Analysis
      • Market Share Analysis, 2024
        • By Component
        • By Application
        • By End Users
        • By Technology
        • By Industry
    • Mexico
      • Pricing Analysis
      • Market Share Analysis, 2024
        • By Component
        • By Application
        • By End Users
        • By Technology
        • By Industry
    • Brazil
      • Pricing Analysis
      • Market Share Analysis, 2024
        • By Component
        • By Application
        • By End Users
        • By Technology
        • By Industry
    • Chile
      • Pricing Analysis
      • Market Share Analysis, 2024
        • By Component
        • By Application
        • By End Users
        • By Technology
        • By Industry
    • Germany
      • Pricing Analysis
      • Market Share Analysis, 2024
        • By Component
        • By Application
        • By End Users
        • By Technology
        • By Industry
    • U.K.
      • Pricing Analysis
      • Market Share Analysis, 2024
        • By Component
        • By Application
        • By End Users
        • By Technology
        • By Industry
    • Italy
      • Pricing Analysis
      • Market Share Analysis, 2024
        • By Component
        • By Application
        • By End Users
        • By Technology
        • By Industry
    • Spain
      • Pricing Analysis
      • Market Share Analysis, 2024
        • By Component
        • By Application
        • By End Users
        • By Technology
        • By Industry
    • France
      • Pricing Analysis
      • Market Share Analysis, 2024
        • By Component
        • By Application
        • By End Users
        • By Technology
        • By Industry
    • India
      • Pricing Analysis
      • Market Share Analysis, 2024
        • By Component
        • By Application
        • By End Users
        • By Technology
        • By Industry
    • ASEAN
      • Pricing Analysis
      • Market Share Analysis, 2024
        • By Component
        • By Application
        • By End Users
        • By Technology
        • By Industry
    • Australia & New Zealand
      • Pricing Analysis
      • Market Share Analysis, 2024
        • By Component
        • By Application
        • By End Users
        • By Technology
        • By Industry
    • China
      • Pricing Analysis
      • Market Share Analysis, 2024
        • By Component
        • By Application
        • By End Users
        • By Technology
        • By Industry
    • Japan
      • Pricing Analysis
      • Market Share Analysis, 2024
        • By Component
        • By Application
        • By End Users
        • By Technology
        • By Industry
    • South Korea
      • Pricing Analysis
      • Market Share Analysis, 2024
        • By Component
        • By Application
        • By End Users
        • By Technology
        • By Industry
    • Russia
      • Pricing Analysis
      • Market Share Analysis, 2024
        • By Component
        • By Application
        • By End Users
        • By Technology
        • By Industry
    • Poland
      • Pricing Analysis
      • Market Share Analysis, 2024
        • By Component
        • By Application
        • By End Users
        • By Technology
        • By Industry
    • Hungary
      • Pricing Analysis
      • Market Share Analysis, 2024
        • By Component
        • By Application
        • By End Users
        • By Technology
        • By Industry
    • Kingdom of Saudi Arabia
      • Pricing Analysis
      • Market Share Analysis, 2024
        • By Component
        • By Application
        • By End Users
        • By Technology
        • By Industry
    • Turkiye
      • Pricing Analysis
      • Market Share Analysis, 2024
        • By Component
        • By Application
        • By End Users
        • By Technology
        • By Industry
    • South Africa
      • Pricing Analysis
      • Market Share Analysis, 2024
        • By Component
        • By Application
        • By End Users
        • By Technology
        • By Industry
  20. Market Structure Analysis
    • Competition Dashboard
    • Competition Benchmarking
    • Market Share Analysis of Top Players
      • By Regional
      • By Component
      • By Application
      • By End Users
      • By Technology
      • By Industry
  21. Competition Analysis
    • Competition Deep Dive
      • Synaptics Incorporated
        • Overview
        • Product Portfolio
        • Profitability by Market Segments (Product/Age /Sales Channel/Region)
        • Sales Footprint
        • Strategy Overview
          • Marketing Strategy
          • Product Strategy
          • Channel Strategy
      • Ultraleap Limited
      • AAC Technologies Holdings Inc.
      • Qualcomm Technologies, Inc.
      • Immersion Corporation
      • TDK Corporation
      • AAC Technologies
      • Haption
      • Apple Inc.
      • Delta Electronics
      • GoerTek Inc.
      • Rivian Automotive, Inc.
  22. Assumptions & Acronyms Used
  23. Research Methodology

List of Tables

  • Table 1: Global Haptic Touchscreen Market Value (USD Mn) Forecast by Region, 2020-2035
  • Table 2: Global Haptic Touchscreen Market Value (USD Mn) Forecast by Component , 2020-2035
  • Table 3: Global Haptic Touchscreen Market Value (USD Mn) Forecast by Application, 2020-2035
  • Table 4: Global Haptic Touchscreen Market Value (USD Mn) Forecast by End Users, 2020-2035
  • Table 5: Global Haptic Touchscreen Market Value (USD Mn) Forecast by Technology, 2020-2035
  • Table 6: Global Haptic Touchscreen Market Value (USD Mn) Forecast by Industry, 2020-2035
  • Table 7: North America Haptic Touchscreen Market Value (USD Mn) Forecast by Country, 2020-2035
  • Table 8: North America Haptic Touchscreen Market Value (USD Mn) Forecast by Component , 2020-2035
  • Table 9: North America Haptic Touchscreen Market Value (USD Mn) Forecast by Application, 2020-2035
  • Table 10: North America Haptic Touchscreen Market Value (USD Mn) Forecast by End Users, 2020-2035
  • Table 11: North America Haptic Touchscreen Market Value (USD Mn) Forecast by Technology, 2020-2035
  • Table 12: North America Haptic Touchscreen Market Value (USD Mn) Forecast by Industry, 2020-2035
  • Table 13: Latin America Haptic Touchscreen Market Value (USD Mn) Forecast by Country, 2020-2035
  • Table 14: Latin America Haptic Touchscreen Market Value (USD Mn) Forecast by Component , 2020-2035
  • Table 15: Latin America Haptic Touchscreen Market Value (USD Mn) Forecast by Application, 2020-2035
  • Table 16: Latin America Haptic Touchscreen Market Value (USD Mn) Forecast by End Users, 2020-2035
  • Table 17: Latin America Haptic Touchscreen Market Value (USD Mn) Forecast by Technology, 2020-2035
  • Table 18: Latin America Haptic Touchscreen Market Value (USD Mn) Forecast by Industry, 2020-2035
  • Table 19: Western Europe Haptic Touchscreen Market Value (USD Mn) Forecast by Country, 2020-2035
  • Table 20: Western Europe Haptic Touchscreen Market Value (USD Mn) Forecast by Component , 2020-2035
  • Table 21: Western Europe Haptic Touchscreen Market Value (USD Mn) Forecast by Application, 2020-2035
  • Table 22: Western Europe Haptic Touchscreen Market Value (USD Mn) Forecast by End Users, 2020-2035
  • Table 23: Western Europe Haptic Touchscreen Market Value (USD Mn) Forecast by Technology, 2020-2035
  • Table 24: Western Europe Haptic Touchscreen Market Value (USD Mn) Forecast by Industry, 2020-2035
  • Table 25: Eastern Europe Haptic Touchscreen Market Value (USD Mn) Forecast by Country, 2020-2035
  • Table 26: Eastern Europe Haptic Touchscreen Market Value (USD Mn) Forecast by Component , 2020-2035
  • Table 27: Eastern Europe Haptic Touchscreen Market Value (USD Mn) Forecast by Application, 2020-2035
  • Table 28: Eastern Europe Haptic Touchscreen Market Value (USD Mn) Forecast by End Users, 2020-2035
  • Table 29: Eastern Europe Haptic Touchscreen Market Value (USD Mn) Forecast by Technology, 2020-2035
  • Table 30: Eastern Europe Haptic Touchscreen Market Value (USD Mn) Forecast by Industry, 2020-2035
  • Table 31: East Asia Haptic Touchscreen Market Value (USD Mn) Forecast by Country, 2020-2035
  • Table 32: East Asia Haptic Touchscreen Market Value (USD Mn) Forecast by Component , 2020-2035
  • Table 33: East Asia Haptic Touchscreen Market Value (USD Mn) Forecast by Application, 2020-2035
  • Table 34: East Asia Haptic Touchscreen Market Value (USD Mn) Forecast by End Users, 2020-2035
  • Table 35: East Asia Haptic Touchscreen Market Value (USD Mn) Forecast by Technology, 2020-2035
  • Table 36: East Asia Haptic Touchscreen Market Value (USD Mn) Forecast by Industry, 2020-2035
  • Table 37: South Asia and Pacific Haptic Touchscreen Market Value (USD Mn) Forecast by Country, 2020-2035
  • Table 38: South Asia and Pacific Haptic Touchscreen Market Value (USD Mn) Forecast by Component , 2020-2035
  • Table 39: South Asia and Pacific Haptic Touchscreen Market Value (USD Mn) Forecast by Application, 2020-2035
  • Table 40: South Asia and Pacific Haptic Touchscreen Market Value (USD Mn) Forecast by End Users, 2020-2035
  • Table 41: South Asia and Pacific Haptic Touchscreen Market Value (USD Mn) Forecast by Technology, 2020-2035
  • Table 42: South Asia and Pacific Haptic Touchscreen Market Value (USD Mn) Forecast by Industry, 2020-2035
  • Table 43: Middle East & Africa Haptic Touchscreen Market Value (USD Mn) Forecast by Country, 2020-2035
  • Table 44: Middle East & Africa Haptic Touchscreen Market Value (USD Mn) Forecast by Component , 2020-2035
  • Table 45: Middle East & Africa Haptic Touchscreen Market Value (USD Mn) Forecast by Application, 2020-2035
  • Table 46: Middle East & Africa Haptic Touchscreen Market Value (USD Mn) Forecast by End Users, 2020-2035
  • Table 47: Middle East & Africa Haptic Touchscreen Market Value (USD Mn) Forecast by Technology, 2020-2035
  • Table 48: Middle East & Africa Haptic Touchscreen Market Value (USD Mn) Forecast by Industry, 2020-2035

List of Figures

  • Figure 1: Global Haptic Touchscreen Market Pricing Analysis
  • Figure 2: Global Haptic Touchscreen Market Value (USD Mn) Forecast 2020–2035
  • Figure 3: Global Haptic Touchscreen Market Value Share and BPS Analysis by Component , 2025 and 2035
  • Figure 4: Global Haptic Touchscreen Market Y-o-Y Growth Comparison by Component , 2025–2035
  • Figure 5: Global Haptic Touchscreen Market Attractiveness Analysis by Component
  • Figure 6: Global Haptic Touchscreen Market Value Share and BPS Analysis by Application, 2025 and 2035
  • Figure 7: Global Haptic Touchscreen Market Y-o-Y Growth Comparison by Application, 2025–2035
  • Figure 8: Global Haptic Touchscreen Market Attractiveness Analysis by Application
  • Figure 9: Global Haptic Touchscreen Market Value Share and BPS Analysis by End Users, 2025 and 2035
  • Figure 10: Global Haptic Touchscreen Market Y-o-Y Growth Comparison by End Users, 2025–2035
  • Figure 11: Global Haptic Touchscreen Market Attractiveness Analysis by End Users
  • Figure 12: Global Haptic Touchscreen Market Value Share and BPS Analysis by Technology, 2025 and 2035
  • Figure 13: Global Haptic Touchscreen Market Y-o-Y Growth Comparison by Technology, 2025–2035
  • Figure 14: Global Haptic Touchscreen Market Attractiveness Analysis by Technology
  • Figure 15: Global Haptic Touchscreen Market Value Share and BPS Analysis by Industry, 2025 and 2035
  • Figure 16: Global Haptic Touchscreen Market Y-o-Y Growth Comparison by Industry, 2025–2035
  • Figure 17: Global Haptic Touchscreen Market Attractiveness Analysis by Industry
  • Figure 18: Global Haptic Touchscreen Market Value (USD Mn) Share and BPS Analysis by Region, 2025 and 2035
  • Figure 19: Global Haptic Touchscreen Market Y-o-Y Growth Comparison by Region, 2025–2035
  • Figure 20: Global Haptic Touchscreen Market Attractiveness Analysis by Region
  • Figure 21: North America Haptic Touchscreen Market Incremental Dollar Opportunity, 2025–2035
  • Figure 22: Latin America Haptic Touchscreen Market Incremental Dollar Opportunity, 2025–2035
  • Figure 23: Western Europe Haptic Touchscreen Market Incremental Dollar Opportunity, 2025–2035
  • Figure 24: Eastern Europe Haptic Touchscreen Market Incremental Dollar Opportunity, 2025–2035
  • Figure 25: East Asia Haptic Touchscreen Market Incremental Dollar Opportunity, 2025–2035
  • Figure 26: South Asia and Pacific Haptic Touchscreen Market Incremental Dollar Opportunity, 2025–2035
  • Figure 27: Middle East & Africa Haptic Touchscreen Market Incremental Dollar Opportunity, 2025–2035
  • Figure 28: North America Haptic Touchscreen Market Value Share and BPS Analysis by Country, 2025 and 2035
  • Figure 29: North America Haptic Touchscreen Market Value Share and BPS Analysis by Component , 2025 and 2035
  • Figure 30: North America Haptic Touchscreen Market Y-o-Y Growth Comparison by Component , 2025–2035
  • Figure 31: North America Haptic Touchscreen Market Attractiveness Analysis by Component
  • Figure 32: North America Haptic Touchscreen Market Value Share and BPS Analysis by Application, 2025 and 2035
  • Figure 33: North America Haptic Touchscreen Market Y-o-Y Growth Comparison by Application, 2025–2035
  • Figure 34: North America Haptic Touchscreen Market Attractiveness Analysis by Application
  • Figure 35: North America Haptic Touchscreen Market Value Share and BPS Analysis by End Users, 2025 and 2035
  • Figure 36: North America Haptic Touchscreen Market Y-o-Y Growth Comparison by End Users, 2025–2035
  • Figure 37: North America Haptic Touchscreen Market Attractiveness Analysis by End Users
  • Figure 38: North America Haptic Touchscreen Market Value Share and BPS Analysis by Technology, 2025 and 2035
  • Figure 39: North America Haptic Touchscreen Market Y-o-Y Growth Comparison by Technology, 2025–2035
  • Figure 40: North America Haptic Touchscreen Market Attractiveness Analysis by Technology
  • Figure 41: North America Haptic Touchscreen Market Value Share and BPS Analysis by Industry, 2025 and 2035
  • Figure 42: North America Haptic Touchscreen Market Y-o-Y Growth Comparison by Industry, 2025–2035
  • Figure 43: North America Haptic Touchscreen Market Attractiveness Analysis by Industry
  • Figure 44: Latin America Haptic Touchscreen Market Value Share and BPS Analysis by Country, 2025 and 2035
  • Figure 45: Latin America Haptic Touchscreen Market Value Share and BPS Analysis by Component , 2025 and 2035
  • Figure 46: Latin America Haptic Touchscreen Market Y-o-Y Growth Comparison by Component , 2025–2035
  • Figure 47: Latin America Haptic Touchscreen Market Attractiveness Analysis by Component
  • Figure 48: Latin America Haptic Touchscreen Market Value Share and BPS Analysis by Application, 2025 and 2035
  • Figure 49: Latin America Haptic Touchscreen Market Y-o-Y Growth Comparison by Application, 2025–2035
  • Figure 50: Latin America Haptic Touchscreen Market Attractiveness Analysis by Application
  • Figure 51: Latin America Haptic Touchscreen Market Value Share and BPS Analysis by End Users, 2025 and 2035
  • Figure 52: Latin America Haptic Touchscreen Market Y-o-Y Growth Comparison by End Users, 2025–2035
  • Figure 53: Latin America Haptic Touchscreen Market Attractiveness Analysis by End Users
  • Figure 54: Latin America Haptic Touchscreen Market Value Share and BPS Analysis by Technology, 2025 and 2035
  • Figure 55: Latin America Haptic Touchscreen Market Y-o-Y Growth Comparison by Technology, 2025–2035
  • Figure 56: Latin America Haptic Touchscreen Market Attractiveness Analysis by Technology
  • Figure 57: Latin America Haptic Touchscreen Market Value Share and BPS Analysis by Industry, 2025 and 2035
  • Figure 58: Latin America Haptic Touchscreen Market Y-o-Y Growth Comparison by Industry, 2025–2035
  • Figure 59: Latin America Haptic Touchscreen Market Attractiveness Analysis by Industry
  • Figure 60: Western Europe Haptic Touchscreen Market Value Share and BPS Analysis by Country, 2025 and 2035
  • Figure 61: Western Europe Haptic Touchscreen Market Value Share and BPS Analysis by Component , 2025 and 2035
  • Figure 62: Western Europe Haptic Touchscreen Market Y-o-Y Growth Comparison by Component , 2025–2035
  • Figure 63: Western Europe Haptic Touchscreen Market Attractiveness Analysis by Component
  • Figure 64: Western Europe Haptic Touchscreen Market Value Share and BPS Analysis by Application, 2025 and 2035
  • Figure 65: Western Europe Haptic Touchscreen Market Y-o-Y Growth Comparison by Application, 2025–2035
  • Figure 66: Western Europe Haptic Touchscreen Market Attractiveness Analysis by Application
  • Figure 67: Western Europe Haptic Touchscreen Market Value Share and BPS Analysis by End Users, 2025 and 2035
  • Figure 68: Western Europe Haptic Touchscreen Market Y-o-Y Growth Comparison by End Users, 2025–2035
  • Figure 69: Western Europe Haptic Touchscreen Market Attractiveness Analysis by End Users
  • Figure 70: Western Europe Haptic Touchscreen Market Value Share and BPS Analysis by Technology, 2025 and 2035
  • Figure 71: Western Europe Haptic Touchscreen Market Y-o-Y Growth Comparison by Technology, 2025–2035
  • Figure 72: Western Europe Haptic Touchscreen Market Attractiveness Analysis by Technology
  • Figure 73: Western Europe Haptic Touchscreen Market Value Share and BPS Analysis by Industry, 2025 and 2035
  • Figure 74: Western Europe Haptic Touchscreen Market Y-o-Y Growth Comparison by Industry, 2025–2035
  • Figure 75: Western Europe Haptic Touchscreen Market Attractiveness Analysis by Industry
  • Figure 76: Eastern Europe Haptic Touchscreen Market Value Share and BPS Analysis by Country, 2025 and 2035
  • Figure 77: Eastern Europe Haptic Touchscreen Market Value Share and BPS Analysis by Component , 2025 and 2035
  • Figure 78: Eastern Europe Haptic Touchscreen Market Y-o-Y Growth Comparison by Component , 2025–2035
  • Figure 79: Eastern Europe Haptic Touchscreen Market Attractiveness Analysis by Component
  • Figure 80: Eastern Europe Haptic Touchscreen Market Value Share and BPS Analysis by Application, 2025 and 2035
  • Figure 81: Eastern Europe Haptic Touchscreen Market Y-o-Y Growth Comparison by Application, 2025–2035
  • Figure 82: Eastern Europe Haptic Touchscreen Market Attractiveness Analysis by Application
  • Figure 83: Eastern Europe Haptic Touchscreen Market Value Share and BPS Analysis by End Users, 2025 and 2035
  • Figure 84: Eastern Europe Haptic Touchscreen Market Y-o-Y Growth Comparison by End Users, 2025–2035
  • Figure 85: Eastern Europe Haptic Touchscreen Market Attractiveness Analysis by End Users
  • Figure 86: Eastern Europe Haptic Touchscreen Market Value Share and BPS Analysis by Technology, 2025 and 2035
  • Figure 87: Eastern Europe Haptic Touchscreen Market Y-o-Y Growth Comparison by Technology, 2025–2035
  • Figure 88: Eastern Europe Haptic Touchscreen Market Attractiveness Analysis by Technology
  • Figure 89: Eastern Europe Haptic Touchscreen Market Value Share and BPS Analysis by Industry, 2025 and 2035
  • Figure 90: Eastern Europe Haptic Touchscreen Market Y-o-Y Growth Comparison by Industry, 2025–2035
  • Figure 91: Eastern Europe Haptic Touchscreen Market Attractiveness Analysis by Industry
  • Figure 92: East Asia Haptic Touchscreen Market Value Share and BPS Analysis by Country, 2025 and 2035
  • Figure 93: East Asia Haptic Touchscreen Market Value Share and BPS Analysis by Component , 2025 and 2035
  • Figure 94: East Asia Haptic Touchscreen Market Y-o-Y Growth Comparison by Component , 2025–2035
  • Figure 95: East Asia Haptic Touchscreen Market Attractiveness Analysis by Component
  • Figure 96: East Asia Haptic Touchscreen Market Value Share and BPS Analysis by Application, 2025 and 2035
  • Figure 97: East Asia Haptic Touchscreen Market Y-o-Y Growth Comparison by Application, 2025–2035
  • Figure 98: East Asia Haptic Touchscreen Market Attractiveness Analysis by Application
  • Figure 99: East Asia Haptic Touchscreen Market Value Share and BPS Analysis by End Users, 2025 and 2035
  • Figure 100: East Asia Haptic Touchscreen Market Y-o-Y Growth Comparison by End Users, 2025–2035
  • Figure 101: East Asia Haptic Touchscreen Market Attractiveness Analysis by End Users
  • Figure 102: East Asia Haptic Touchscreen Market Value Share and BPS Analysis by Technology, 2025 and 2035
  • Figure 103: East Asia Haptic Touchscreen Market Y-o-Y Growth Comparison by Technology, 2025–2035
  • Figure 104: East Asia Haptic Touchscreen Market Attractiveness Analysis by Technology
  • Figure 105: East Asia Haptic Touchscreen Market Value Share and BPS Analysis by Industry, 2025 and 2035
  • Figure 106: East Asia Haptic Touchscreen Market Y-o-Y Growth Comparison by Industry, 2025–2035
  • Figure 107: East Asia Haptic Touchscreen Market Attractiveness Analysis by Industry
  • Figure 108: South Asia and Pacific Haptic Touchscreen Market Value Share and BPS Analysis by Country, 2025 and 2035
  • Figure 109: South Asia and Pacific Haptic Touchscreen Market Value Share and BPS Analysis by Component , 2025 and 2035
  • Figure 110: South Asia and Pacific Haptic Touchscreen Market Y-o-Y Growth Comparison by Component , 2025–2035
  • Figure 111: South Asia and Pacific Haptic Touchscreen Market Attractiveness Analysis by Component
  • Figure 112: South Asia and Pacific Haptic Touchscreen Market Value Share and BPS Analysis by Application, 2025 and 2035
  • Figure 113: South Asia and Pacific Haptic Touchscreen Market Y-o-Y Growth Comparison by Application, 2025–2035
  • Figure 114: South Asia and Pacific Haptic Touchscreen Market Attractiveness Analysis by Application
  • Figure 115: South Asia and Pacific Haptic Touchscreen Market Value Share and BPS Analysis by End Users, 2025 and 2035
  • Figure 116: South Asia and Pacific Haptic Touchscreen Market Y-o-Y Growth Comparison by End Users, 2025–2035
  • Figure 117: South Asia and Pacific Haptic Touchscreen Market Attractiveness Analysis by End Users
  • Figure 118: South Asia and Pacific Haptic Touchscreen Market Value Share and BPS Analysis by Technology, 2025 and 2035
  • Figure 119: South Asia and Pacific Haptic Touchscreen Market Y-o-Y Growth Comparison by Technology, 2025–2035
  • Figure 120: South Asia and Pacific Haptic Touchscreen Market Attractiveness Analysis by Technology
  • Figure 121: South Asia and Pacific Haptic Touchscreen Market Value Share and BPS Analysis by Industry, 2025 and 2035
  • Figure 122: South Asia and Pacific Haptic Touchscreen Market Y-o-Y Growth Comparison by Industry, 2025–2035
  • Figure 123: South Asia and Pacific Haptic Touchscreen Market Attractiveness Analysis by Industry
  • Figure 124: Middle East & Africa Haptic Touchscreen Market Value Share and BPS Analysis by Country, 2025 and 2035
  • Figure 125: Middle East & Africa Haptic Touchscreen Market Value Share and BPS Analysis by Component , 2025 and 2035
  • Figure 126: Middle East & Africa Haptic Touchscreen Market Y-o-Y Growth Comparison by Component , 2025–2035
  • Figure 127: Middle East & Africa Haptic Touchscreen Market Attractiveness Analysis by Component
  • Figure 128: Middle East & Africa Haptic Touchscreen Market Value Share and BPS Analysis by Application, 2025 and 2035
  • Figure 129: Middle East & Africa Haptic Touchscreen Market Y-o-Y Growth Comparison by Application, 2025–2035
  • Figure 130: Middle East & Africa Haptic Touchscreen Market Attractiveness Analysis by Application
  • Figure 131: Middle East & Africa Haptic Touchscreen Market Value Share and BPS Analysis by End Users, 2025 and 2035
  • Figure 132: Middle East & Africa Haptic Touchscreen Market Y-o-Y Growth Comparison by End Users, 2025–2035
  • Figure 133: Middle East & Africa Haptic Touchscreen Market Attractiveness Analysis by End Users
  • Figure 134: Middle East & Africa Haptic Touchscreen Market Value Share and BPS Analysis by Technology, 2025 and 2035
  • Figure 135: Middle East & Africa Haptic Touchscreen Market Y-o-Y Growth Comparison by Technology, 2025–2035
  • Figure 136: Middle East & Africa Haptic Touchscreen Market Attractiveness Analysis by Technology
  • Figure 137: Middle East & Africa Haptic Touchscreen Market Value Share and BPS Analysis by Industry, 2025 and 2035
  • Figure 138: Middle East & Africa Haptic Touchscreen Market Y-o-Y Growth Comparison by Industry, 2025–2035
  • Figure 139: Middle East & Africa Haptic Touchscreen Market Attractiveness Analysis by Industry
  • Figure 140: Global Haptic Touchscreen Market – Tier Structure Analysis
  • Figure 141: Global Haptic Touchscreen Market – Company Share Analysis

Frequently Asked Questions

How big is the haptic touchscreen market in 2025?

The global haptic touchscreen market is estimated to be valued at USD 20.1 billion in 2025.

What will be the size of haptic touchscreen market in 2035?

The market size for the haptic touchscreen market is projected to reach USD 76.0 billion by 2035.

How much will be the haptic touchscreen market growth between 2025 and 2035?

The haptic touchscreen market is expected to grow at a 14.2% CAGR between 2025 and 2035.

What are the key product types in the haptic touchscreen market?

The key product types in haptic touchscreen market are hardware, software and services.

Which application segment to contribute significant share in the haptic touchscreen market in 2025?

In terms of application, mobile devices segment to command 42.7% share in the haptic touchscreen market in 2025.

Explore Similar Insights

Future Market Insights

Haptic Touchscreen Market

Chat With MaRIA

Chat With

MaRIA

Hi There, I am MaRIA, Your Market Research Intelligence Assistant. How may I help you?