Global Houseware Market Size and Share Forecast Outlook (2024 to 2034)

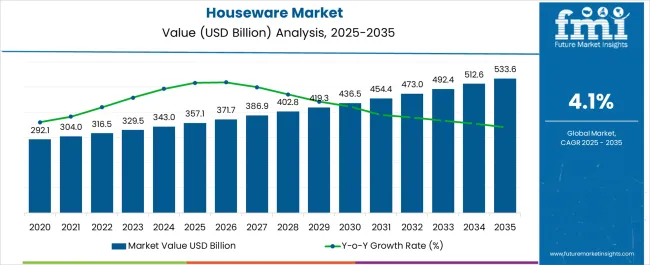
The global houseware market is expected to be worth USD 343 billion in 2024. For 2023, the value was tipped to be USD 332 billion. The market is projected to show solid growth over the period from 2024 to 2034, with a CAGR of 4.1%. By 2034, the size of the market is predicted to expand by USD 513 billion.

Houseware Market Overview

  • Countries like China and India are seeing significant booms in the construction sector. An increase in the construction of the residential sector accelerates the demand for household consumer products.
  • Rise in disposable income and improvements in lifestyle are contributing to the desire of people to have better-outfitted kitchens, creating demand for luxurious houseware and essential home appliances.
  • Consumers are more willing to buy houseware with innovative and creative designs, as houseware is becoming a part of home décor and interior design.
  • The rise of smart homes is aiding the houseware market, as consumers pay greater attention to the appliances that become a part of their homes.
  • Counterfeit products pose a significant threat to the market, as they can tarnish the image of brand players and drive people away from the appliances.
Attributes Details
Houseware Market Value for 2024 USD 343 billion
Projected Market Value for 2034 USD 513 billion
Value-based CAGR of Market for 2024 to 2034 4.1%

Historical Performance of the Houseware Market

The size of the houseware market was marked to be USD 298 billion in 2019. The market likely progressed at a consistent pace over the historical period from 2019 to 2023, with a CAGR of 2.7%.

Houseware’s demand continued to rise steadily over the historical period. Though the pandemic caused disruptions in supply and distribution, it also forced more people to stay at home. Thus, greater attention was paid to home appliances and consumers were more willing to have upgrades in houseware. By the end of the historical period in 2023, the market value had jumped to USD 332 billion.

Market Value (2019) USD 298 billion
Historical CAGR (2019 to 2023) 2.7%
Historical Market Valuation (2023) USD 332 billion

Long-term Analysis of the Houseware Market

The houseware market is anticipated to have a value of USD 343 billion in 2024. For the forecast period, the market is expected to register a sturdy CAGR of 4.1%.

The market’s expansion is set to be faster in the historical period than in the forecast period. As more residences get constructed, the demand for houseware is getting propelled. In addition, the desire of consumers to live with high standards is contributing to the demand for high-end houseware. However, counterfeit and low-quality offshoot products are expected to hamper the progress of the market.

Trends of smart homes and modular homes are driving the demand for houseware. Modular and smart homes are incorporating houseware into their designs. Further, houseware is also becoming a part of interior design and benefitting from home renovations. By the end of the forecast period, it is projected that the value of the houseware market will be USD 513 billion.

Trends and Analysis Shaping the Houseware Industry

  • Manufacturers in the market are recognizing the sustainable inclinations of consumers and are focusing on bringing out sustainable houseware. Many prominent brands in the market, such as Ten Thousand Villages and Etsy, have joined in on the trend.
  • Post-pandemic, a penchant for home cooking has been instilled in consumers, contributing to higher demand for kitchenware.
  • As with all streams of life, consumers are desirous of advanced technology in appliances at home too, and thus technologically advanced houseware has emerged as a significant trend in the market.
  • With the shrinkage in households and increasing nuclear families, there has been a growing trend for houseware that is convenient to use and compact, saving space and time.
  • With consumers becoming less hesitant to splash money on houseware, there has been a rising demand for appliances that are personalized or customized to suit the individual needs of households.
  • While there is wide availability of houseware due to local and affordable options, sometimes the options contribute to the negative reputation of houseware. Small vendors serve low-quality products that are prone to not last, thereby damaging the reputation of houseware.
  • In addition to kitchens and living rooms, bathrooms are becoming outfitted with convenient appliances. As a more comfortable experience is sought in bathrooms, demand for bathroom essentials is getting boosted.

Houseware Industry Analysis by Top Investment Segments

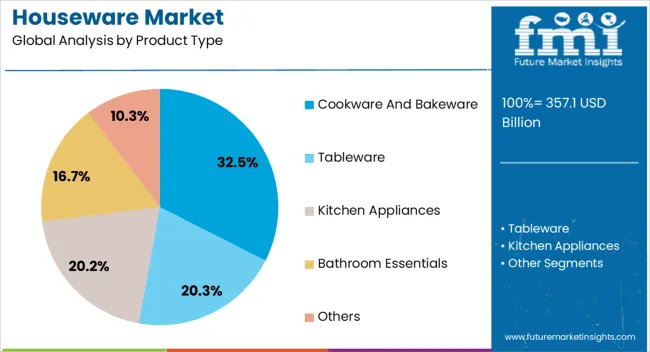
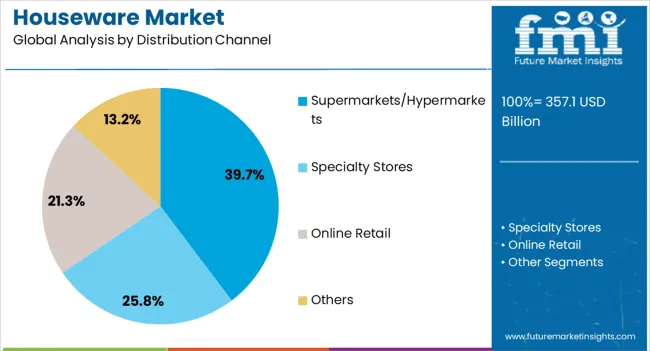
The houseware market can be divided into the following segments: product type and distribution channel. As home sizes increase and there is more demand for an upgrade in homeware for all rooms, the type of products available in the market is widening. The boom in online platforms has impacted the distribution channel segment, but for the time being offline channels are still ruling.

Kitchen Appliances are the Foremost Type of Houseware Desired by Consumers

Kitchen appliances are the common type of houseware in homes. For 2024, kitchen appliances are expected to account for 33.3% of the market share.

With home cooking on the rise, kitchens’ importance in homes is ever-increasing. Innovations in kitchen appliances, aided by people experimenting with different cuisines that require untraditional tools, are also helping the spread of the product.

Attributes Details
Top Product Type Kitchen Appliances
Market Share in 2024 33.3%

Supermarkets/Hypermarkets Continue to Dominate the Distribution Channel Segment

Supermarkets/hypermarkets are the preferred choice of consumers when buying houseware. For 2024, supermarkets/hypermarkets are anticipated to contribute to 47.1% of the market share.

The offline channels are still dominant in the houseware market. Among the offline channels, supermarkets are the destination that consumers often visit for houseware. Supermarkets afford consumers bulk-buying options and are also attractive due to the various offers and discounts provided.

Attributes Details
Top Distribution Channel Supermarkets/Hypermarkets
Market Share in 2024 47.1%

Analysis of Top Countries Manufacturing, Distributing, and Using Houseware Products

The rapidly expanding construction sector in the Asia Pacific and Oceania is helping the market go from strength to strength in the regions. The growth of middle-class families, as well as consumers desirous of luxurious living, are other factors propelling the markets in the region.

The market has high potential in Europe due to the willingness of the population in the region to spend on aesthetic household products. North America is also a prominent region, as home renovation and modular kitchens gain popularity.

Countries CAGR (2024 to 2034)
United States 2.9%
China 4.1%
Germany 3.8%
Australia 4.7%
India 5.5%

India Became a Land of Opportunity by Both Local and Foreign Players

India is set to be one of the lucrative countries in the market. For the 2024 to 2034 period, the CAGR for India is estimated to be a normal 5.5%.

Investment in houseware is rising in India, from both foreign and local players. For example, in February 2022, H&M Home entered the Indian market, and in November 2023, local player Cello World went public. Thus, the market is set to enjoy a sparkling rise in India over the forecast period.

Incorporation of Wellness into Houseware in China Giving New Dimension to the Market

Another country in Asia marked with promise for the market is China. For the forecast period, the CAGR for China is predicted to be a commendable 4.1%.

In China, comfort is the priority for a significant chunk of consumers when it comes to houseware. With the pandemic’s effects still felt in the country, consumers are seeking solace at home. Thus, producers in China are designing houseware that is pleasant and comfortable to be around.

Aesthetics Playing a Key Part in the Demand for Houseware in Australia

Australian homeowners are seeking houseware that helps make their houses look sleek. Therefore, Australian consumers are buying houseware that is inspired by vintage, playful, and other funky styles. Australian market players, including a considerable number of local start-ups, are focused on creativity and differentiation. For the forecast period, the CAGR for Australia is anticipated to be a respectable 4.7%.

Being at the Forefront of Advanced Technology Helps the Market in Germany

Germany is often at the forefront of technological innovations in household products. The country is also home to several trade fairs and shows that showcase houseware and technology, such as Ambiente and the Internationale Funkausstellung (IFA). Thus, German consumers are often among the first beneficiaries of innovations in the market. The market is expected to register a consistent CAGR of 3.8% in Germany.

Consumers in the United States Flock to Supermarket Chains for Houseware

Supermarket chains like Walmart, Costco, and Target are prominent destinations for United States consumers when it comes to shopping for houseware. Producers in the United States are stocking supermarket shelves with affordable products to appeal to consumers. The market is expected to register a steady CAGR of 2.9% in the United States.
Competitive Landscape of the Global Houseware Market

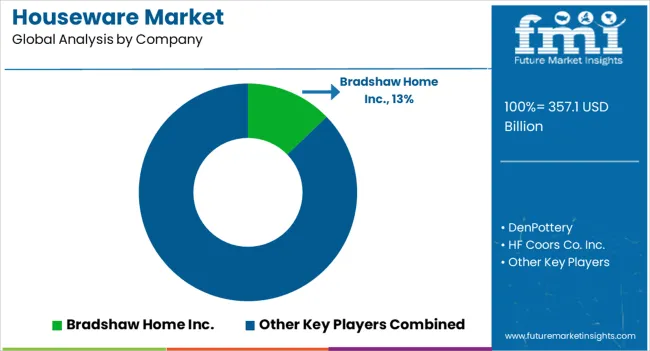
In line with the customization trends, start-up culture is strong in the market, offering a more intimate and personalized feel to home appliances. However, multinational giants have established a firm foothold in the market.

As designer trends emerge in houseware, celebrities and models are also becoming a part of the market, whether through branding or investment. Market players are also leveraging technology to come up with innovative home appliances.

Recent Developments in the Houseware Market

  • In November 2023, Flannels Home was launched, marking Flannels’ entry into the market. The retailer made available designer houseware pieces from brands such as Versace and Dolce & Gabbana.
  • In September 2023, the British brand Ultimate Products expanded into the French market. The company opened a showroom in Paris, after previously expanding into Germany and Poland.
  • In August 2023, Australian brand Anko collaborated with the Indian e-commerce website Myntra. Through the collaboration, Anko entered the Indian market.
  • In June 2022, popular film actress Priyanka Chopra launched the homeware brand Sona Home, in collaboration with Manish Goyal. The brand includes kitchenware and barware inspired by Indian traditions.

Key Companies in the Houseware Industry

  • Bradshaw Home Inc.
  • Denby Pottery
  • HF Coors Co. Inc.
  • Inter Ikea Holding Bv
  • Hutzler Manufacturing Co. Inc.
  • TTK Prestige Ltd.
  • Newell Brands Inc.
  • BSH Hausgerate GmbH
  • Kohler Co
  • Haier US Appliance Solutions Inc.

Top Segments Studied in the Houseware Market Report

By Product Type:

  • Cookware and Bakeware
  • Tableware
  • Kitchen Appliances
  • Bathroom Essentials
  • Others

By Distribution Channel:

  • Supermarkets/Hypermarkets
  • Specialty Stores
  • Online Retail
  • Others

By Region:

  • North America
  • Latin America
  • Europe
  • South Asia
  • East Asia
  • Oceania
  • The Middle East and Africa (MEA)

Table of Content

  • 1. Executive Summary
  • 2. Market Overview
  • 3. Market Background
  • 4. Global Market Analysis 2019 to 2023 and Forecast, 2024 to 2034
  • 5. Global Market Analysis 2019 to 2023 and Forecast 2024 to 2034, By Types
    • 5.1. Cookware
    • 5.2. Bakeware
    • 5.3. Kitchen Tools & Accessories
    • 5.4. Tableware
    • 5.5. Others
  • 6. Global Market Analysis 2019 to 2023 and Forecast 2024 to 2034, By Materials
    • 6.1. Glass
    • 6.2. Steel
    • 6.3. Plastic
    • 6.4. Ceramic
    • 6.5. Others
  • 7. Global Market Analysis 2019 to 2023 and Forecast 2024 to 2034, By Distribution Channels
    • 7.1. Online
    • 7.2. Offline
  • 8. Global Market Analysis 2019 to 2023 and Forecast 2024 to 2034, By Applications
    • 8.1. Personal
    • 8.2. Commercial
  • 9. Global Market Analysis 2019 to 2023 and Forecast 2024 to 2034, By Region
    • 9.1. North America
    • 9.2. Latin America
    • 9.3. Western Europe
    • 9.4. Eastern Europe
    • 9.5. South Asia and Pacific
    • 9.6. East Asia
    • 9.7. Middle East and Africa
  • 10. North America Market Analysis 2019 to 2023 and Forecast 2024 to 2034, By Country
  • 11. Latin America Market Analysis 2019 to 2023 and Forecast 2024 to 2034, By Country
  • 12. Western Europe Market Analysis 2019 to 2023 and Forecast 2024 to 2034, By Country
  • 13. Eastern Europe Market Analysis 2019 to 2023 and Forecast 2024 to 2034, By Country
  • 14. South Asia and Pacific Market Analysis 2019 to 2023 and Forecast 2024 to 2034, By Country
  • 15. East Asia Market Analysis 2019 to 2023 and Forecast 2024 to 2034, By Country
  • 16. Middle East and Africa Market Analysis 2019 to 2023 and Forecast 2024 to 2034, By Country
  • 17. Key Countries Market Analysis
  • 18. Market Structure Analysis
  • 19. Competition Analysis
    • 19.1. Tupperware
    • 19.2. Breville Group Limited
    • 19.3. KitchenAid
    • 19.4. Samsung Electronics Co., Ltd.
    • 19.5. Haier Group Corporation
    • 19.6. Kenwood Limited
    • 19.7. Boffi
    • 19.8. TTK Prestige Limited
    • 19.9. The Middleby Corporation
    • 19.10. LG Corporation
    • 19.11. Whirpool Corporation
  • 20. Assumptions & Acronyms Used
  • 21. Research Methodology

List of Tables

Table 1: Global Market Value (US$ Million) Forecast by Region, 2019 to 2034

Table 2: Global Market Volume (Units) Forecast by Region, 2019 to 2034

Table 3: Global Market Value (US$ Million) Forecast by Types, 2019 to 2034

Table 4: Global Market Volume (Units) Forecast by Types, 2019 to 2034

Table 5: Global Market Value (US$ Million) Forecast by Materials, 2019 to 2034

Table 6: Global Market Volume (Units) Forecast by Materials, 2019 to 2034

Table 7: Global Market Value (US$ Million) Forecast by Distribution Channels, 2019 to 2034

Table 8: Global Market Volume (Units) Forecast by Distribution Channels, 2019 to 2034

Table 9: Global Market Value (US$ Million) Forecast by Applications, 2019 to 2034

Table 10: Global Market Volume (Units) Forecast by Applications, 2019 to 2034

Table 11: North America Market Value (US$ Million) Forecast by Country, 2019 to 2034

Table 12: North America Market Volume (Units) Forecast by Country, 2019 to 2034

Table 13: North America Market Value (US$ Million) Forecast by Types, 2019 to 2034

Table 14: North America Market Volume (Units) Forecast by Types, 2019 to 2034

Table 15: North America Market Value (US$ Million) Forecast by Materials, 2019 to 2034

Table 16: North America Market Volume (Units) Forecast by Materials, 2019 to 2034

Table 17: North America Market Value (US$ Million) Forecast by Distribution Channels, 2019 to 2034

Table 18: North America Market Volume (Units) Forecast by Distribution Channels, 2019 to 2034

Table 19: North America Market Value (US$ Million) Forecast by Applications, 2019 to 2034

Table 20: North America Market Volume (Units) Forecast by Applications, 2019 to 2034

Table 21: Latin America Market Value (US$ Million) Forecast by Country, 2019 to 2034

Table 22: Latin America Market Volume (Units) Forecast by Country, 2019 to 2034

Table 23: Latin America Market Value (US$ Million) Forecast by Types, 2019 to 2034

Table 24: Latin America Market Volume (Units) Forecast by Types, 2019 to 2034

Table 25: Latin America Market Value (US$ Million) Forecast by Materials, 2019 to 2034

Table 26: Latin America Market Volume (Units) Forecast by Materials, 2019 to 2034

Table 27: Latin America Market Value (US$ Million) Forecast by Distribution Channels, 2019 to 2034

Table 28: Latin America Market Volume (Units) Forecast by Distribution Channels, 2019 to 2034

Table 29: Latin America Market Value (US$ Million) Forecast by Applications, 2019 to 2034

Table 30: Latin America Market Volume (Units) Forecast by Applications, 2019 to 2034

Table 31: Western Europe Market Value (US$ Million) Forecast by Country, 2019 to 2034

Table 32: Western Europe Market Volume (Units) Forecast by Country, 2019 to 2034

Table 33: Western Europe Market Value (US$ Million) Forecast by Types, 2019 to 2034

Table 34: Western Europe Market Volume (Units) Forecast by Types, 2019 to 2034

Table 35: Western Europe Market Value (US$ Million) Forecast by Materials, 2019 to 2034

Table 36: Western Europe Market Volume (Units) Forecast by Materials, 2019 to 2034

Table 37: Western Europe Market Value (US$ Million) Forecast by Distribution Channels, 2019 to 2034

Table 38: Western Europe Market Volume (Units) Forecast by Distribution Channels, 2019 to 2034

Table 39: Western Europe Market Value (US$ Million) Forecast by Applications, 2019 to 2034

Table 40: Western Europe Market Volume (Units) Forecast by Applications, 2019 to 2034

Table 41: Eastern Europe Market Value (US$ Million) Forecast by Country, 2019 to 2034

Table 42: Eastern Europe Market Volume (Units) Forecast by Country, 2019 to 2034

Table 43: Eastern Europe Market Value (US$ Million) Forecast by Types, 2019 to 2034

Table 44: Eastern Europe Market Volume (Units) Forecast by Types, 2019 to 2034

Table 45: Eastern Europe Market Value (US$ Million) Forecast by Materials, 2019 to 2034

Table 46: Eastern Europe Market Volume (Units) Forecast by Materials, 2019 to 2034

Table 47: Eastern Europe Market Value (US$ Million) Forecast by Distribution Channels, 2019 to 2034

Table 48: Eastern Europe Market Volume (Units) Forecast by Distribution Channels, 2019 to 2034

Table 49: Eastern Europe Market Value (US$ Million) Forecast by Applications, 2019 to 2034

Table 50: Eastern Europe Market Volume (Units) Forecast by Applications, 2019 to 2034

Table 51: South Asia and Pacific Market Value (US$ Million) Forecast by Country, 2019 to 2034

Table 52: South Asia and Pacific Market Volume (Units) Forecast by Country, 2019 to 2034

Table 53: South Asia and Pacific Market Value (US$ Million) Forecast by Types, 2019 to 2034

Table 54: South Asia and Pacific Market Volume (Units) Forecast by Types, 2019 to 2034

Table 55: South Asia and Pacific Market Value (US$ Million) Forecast by Materials, 2019 to 2034

Table 56: South Asia and Pacific Market Volume (Units) Forecast by Materials, 2019 to 2034

Table 57: South Asia and Pacific Market Value (US$ Million) Forecast by Distribution Channels, 2019 to 2034

Table 58: South Asia and Pacific Market Volume (Units) Forecast by Distribution Channels, 2019 to 2034

Table 59: South Asia and Pacific Market Value (US$ Million) Forecast by Applications, 2019 to 2034

Table 60: South Asia and Pacific Market Volume (Units) Forecast by Applications, 2019 to 2034

Table 61: East Asia Market Value (US$ Million) Forecast by Country, 2019 to 2034

Table 62: East Asia Market Volume (Units) Forecast by Country, 2019 to 2034

Table 63: East Asia Market Value (US$ Million) Forecast by Types, 2019 to 2034

Table 64: East Asia Market Volume (Units) Forecast by Types, 2019 to 2034

Table 65: East Asia Market Value (US$ Million) Forecast by Materials, 2019 to 2034

Table 66: East Asia Market Volume (Units) Forecast by Materials, 2019 to 2034

Table 67: East Asia Market Value (US$ Million) Forecast by Distribution Channels, 2019 to 2034

Table 68: East Asia Market Volume (Units) Forecast by Distribution Channels, 2019 to 2034

Table 69: East Asia Market Value (US$ Million) Forecast by Applications, 2019 to 2034

Table 70: East Asia Market Volume (Units) Forecast by Applications, 2019 to 2034

Table 71: Middle East and Africa Market Value (US$ Million) Forecast by Country, 2019 to 2034

Table 72: Middle East and Africa Market Volume (Units) Forecast by Country, 2019 to 2034

Table 73: Middle East and Africa Market Value (US$ Million) Forecast by Types, 2019 to 2034

Table 74: Middle East and Africa Market Volume (Units) Forecast by Types, 2019 to 2034

Table 75: Middle East and Africa Market Value (US$ Million) Forecast by Materials, 2019 to 2034

Table 76: Middle East and Africa Market Volume (Units) Forecast by Materials, 2019 to 2034

Table 77: Middle East and Africa Market Value (US$ Million) Forecast by Distribution Channels, 2019 to 2034

Table 78: Middle East and Africa Market Volume (Units) Forecast by Distribution Channels, 2019 to 2034

Table 79: Middle East and Africa Market Value (US$ Million) Forecast by Applications, 2019 to 2034

Table 80: Middle East and Africa Market Volume (Units) Forecast by Applications, 2019 to 2034


List of Figures

Figure 1: Global Market Value (US$ Million) by Types, 2024 to 2034

Figure 2: Global Market Value (US$ Million) by Materials, 2024 to 2034

Figure 3: Global Market Value (US$ Million) by Distribution Channels, 2024 to 2034

Figure 4: Global Market Value (US$ Million) by Applications, 2024 to 2034

Figure 5: Global Market Value (US$ Million) by Region, 2024 to 2034

Figure 6: Global Market Value (US$ Million) Analysis by Region, 2019 to 2034

Figure 7: Global Market Volume (Units) Analysis by Region, 2019 to 2034

Figure 8: Global Market Value Share (%) and BPS Analysis by Region, 2024 to 2034

Figure 9: Global Market Y-o-Y Growth (%) Projections by Region, 2024 to 2034

Figure 10: Global Market Value (US$ Million) Analysis by Types, 2019 to 2034

Figure 11: Global Market Volume (Units) Analysis by Types, 2019 to 2034

Figure 12: Global Market Value Share (%) and BPS Analysis by Types, 2024 to 2034

Figure 13: Global Market Y-o-Y Growth (%) Projections by Types, 2024 to 2034

Figure 14: Global Market Value (US$ Million) Analysis by Materials, 2019 to 2034

Figure 15: Global Market Volume (Units) Analysis by Materials, 2019 to 2034

Figure 16: Global Market Value Share (%) and BPS Analysis by Materials, 2024 to 2034

Figure 17: Global Market Y-o-Y Growth (%) Projections by Materials, 2024 to 2034

Figure 18: Global Market Value (US$ Million) Analysis by Distribution Channels, 2019 to 2034

Figure 19: Global Market Volume (Units) Analysis by Distribution Channels, 2019 to 2034

Figure 20: Global Market Value Share (%) and BPS Analysis by Distribution Channels, 2024 to 2034

Figure 21: Global Market Y-o-Y Growth (%) Projections by Distribution Channels, 2024 to 2034

Figure 22: Global Market Value (US$ Million) Analysis by Applications, 2019 to 2034

Figure 23: Global Market Volume (Units) Analysis by Applications, 2019 to 2034

Figure 24: Global Market Value Share (%) and BPS Analysis by Applications, 2024 to 2034

Figure 25: Global Market Y-o-Y Growth (%) Projections by Applications, 2024 to 2034

Figure 26: Global Market Attractiveness by Types, 2024 to 2034

Figure 27: Global Market Attractiveness by Materials, 2024 to 2034

Figure 28: Global Market Attractiveness by Distribution Channels, 2024 to 2034

Figure 29: Global Market Attractiveness by Applications, 2024 to 2034

Figure 30: Global Market Attractiveness by Region, 2024 to 2034

Figure 31: North America Market Value (US$ Million) by Types, 2024 to 2034

Figure 32: North America Market Value (US$ Million) by Materials, 2024 to 2034

Figure 33: North America Market Value (US$ Million) by Distribution Channels, 2024 to 2034

Figure 34: North America Market Value (US$ Million) by Applications, 2024 to 2034

Figure 35: North America Market Value (US$ Million) by Country, 2024 to 2034

Figure 36: North America Market Value (US$ Million) Analysis by Country, 2019 to 2034

Figure 37: North America Market Volume (Units) Analysis by Country, 2019 to 2034

Figure 38: North America Market Value Share (%) and BPS Analysis by Country, 2024 to 2034

Figure 39: North America Market Y-o-Y Growth (%) Projections by Country, 2024 to 2034

Figure 40: North America Market Value (US$ Million) Analysis by Types, 2019 to 2034

Figure 41: North America Market Volume (Units) Analysis by Types, 2019 to 2034

Figure 42: North America Market Value Share (%) and BPS Analysis by Types, 2024 to 2034

Figure 43: North America Market Y-o-Y Growth (%) Projections by Types, 2024 to 2034

Figure 44: North America Market Value (US$ Million) Analysis by Materials, 2019 to 2034

Figure 45: North America Market Volume (Units) Analysis by Materials, 2019 to 2034

Figure 46: North America Market Value Share (%) and BPS Analysis by Materials, 2024 to 2034

Figure 47: North America Market Y-o-Y Growth (%) Projections by Materials, 2024 to 2034

Figure 48: North America Market Value (US$ Million) Analysis by Distribution Channels, 2019 to 2034

Figure 49: North America Market Volume (Units) Analysis by Distribution Channels, 2019 to 2034

Figure 50: North America Market Value Share (%) and BPS Analysis by Distribution Channels, 2024 to 2034

Figure 51: North America Market Y-o-Y Growth (%) Projections by Distribution Channels, 2024 to 2034

Figure 52: North America Market Value (US$ Million) Analysis by Applications, 2019 to 2034

Figure 53: North America Market Volume (Units) Analysis by Applications, 2019 to 2034

Figure 54: North America Market Value Share (%) and BPS Analysis by Applications, 2024 to 2034

Figure 55: North America Market Y-o-Y Growth (%) Projections by Applications, 2024 to 2034

Figure 56: North America Market Attractiveness by Types, 2024 to 2034

Figure 57: North America Market Attractiveness by Materials, 2024 to 2034

Figure 58: North America Market Attractiveness by Distribution Channels, 2024 to 2034

Figure 59: North America Market Attractiveness by Applications, 2024 to 2034

Figure 60: North America Market Attractiveness by Country, 2024 to 2034

Figure 61: Latin America Market Value (US$ Million) by Types, 2024 to 2034

Figure 62: Latin America Market Value (US$ Million) by Materials, 2024 to 2034

Figure 63: Latin America Market Value (US$ Million) by Distribution Channels, 2024 to 2034

Figure 64: Latin America Market Value (US$ Million) by Applications, 2024 to 2034

Figure 65: Latin America Market Value (US$ Million) by Country, 2024 to 2034

Figure 66: Latin America Market Value (US$ Million) Analysis by Country, 2019 to 2034

Figure 67: Latin America Market Volume (Units) Analysis by Country, 2019 to 2034

Figure 68: Latin America Market Value Share (%) and BPS Analysis by Country, 2024 to 2034

Figure 69: Latin America Market Y-o-Y Growth (%) Projections by Country, 2024 to 2034

Figure 70: Latin America Market Value (US$ Million) Analysis by Types, 2019 to 2034

Figure 71: Latin America Market Volume (Units) Analysis by Types, 2019 to 2034

Figure 72: Latin America Market Value Share (%) and BPS Analysis by Types, 2024 to 2034

Figure 73: Latin America Market Y-o-Y Growth (%) Projections by Types, 2024 to 2034

Figure 74: Latin America Market Value (US$ Million) Analysis by Materials, 2019 to 2034

Figure 75: Latin America Market Volume (Units) Analysis by Materials, 2019 to 2034

Figure 76: Latin America Market Value Share (%) and BPS Analysis by Materials, 2024 to 2034

Figure 77: Latin America Market Y-o-Y Growth (%) Projections by Materials, 2024 to 2034

Figure 78: Latin America Market Value (US$ Million) Analysis by Distribution Channels, 2019 to 2034

Figure 79: Latin America Market Volume (Units) Analysis by Distribution Channels, 2019 to 2034

Figure 80: Latin America Market Value Share (%) and BPS Analysis by Distribution Channels, 2024 to 2034

Figure 81: Latin America Market Y-o-Y Growth (%) Projections by Distribution Channels, 2024 to 2034

Figure 82: Latin America Market Value (US$ Million) Analysis by Applications, 2019 to 2034

Figure 83: Latin America Market Volume (Units) Analysis by Applications, 2019 to 2034

Figure 84: Latin America Market Value Share (%) and BPS Analysis by Applications, 2024 to 2034

Figure 85: Latin America Market Y-o-Y Growth (%) Projections by Applications, 2024 to 2034

Figure 86: Latin America Market Attractiveness by Types, 2024 to 2034

Figure 87: Latin America Market Attractiveness by Materials, 2024 to 2034

Figure 88: Latin America Market Attractiveness by Distribution Channels, 2024 to 2034

Figure 89: Latin America Market Attractiveness by Applications, 2024 to 2034

Figure 90: Latin America Market Attractiveness by Country, 2024 to 2034

Figure 91: Western Europe Market Value (US$ Million) by Types, 2024 to 2034

Figure 92: Western Europe Market Value (US$ Million) by Materials, 2024 to 2034

Figure 93: Western Europe Market Value (US$ Million) by Distribution Channels, 2024 to 2034

Figure 94: Western Europe Market Value (US$ Million) by Applications, 2024 to 2034

Figure 95: Western Europe Market Value (US$ Million) by Country, 2024 to 2034

Figure 96: Western Europe Market Value (US$ Million) Analysis by Country, 2019 to 2034

Figure 97: Western Europe Market Volume (Units) Analysis by Country, 2019 to 2034

Figure 98: Western Europe Market Value Share (%) and BPS Analysis by Country, 2024 to 2034

Figure 99: Western Europe Market Y-o-Y Growth (%) Projections by Country, 2024 to 2034

Figure 100: Western Europe Market Value (US$ Million) Analysis by Types, 2019 to 2034

Figure 101: Western Europe Market Volume (Units) Analysis by Types, 2019 to 2034

Figure 102: Western Europe Market Value Share (%) and BPS Analysis by Types, 2024 to 2034

Figure 103: Western Europe Market Y-o-Y Growth (%) Projections by Types, 2024 to 2034

Figure 104: Western Europe Market Value (US$ Million) Analysis by Materials, 2019 to 2034

Figure 105: Western Europe Market Volume (Units) Analysis by Materials, 2019 to 2034

Figure 106: Western Europe Market Value Share (%) and BPS Analysis by Materials, 2024 to 2034

Figure 107: Western Europe Market Y-o-Y Growth (%) Projections by Materials, 2024 to 2034

Figure 108: Western Europe Market Value (US$ Million) Analysis by Distribution Channels, 2019 to 2034

Figure 109: Western Europe Market Volume (Units) Analysis by Distribution Channels, 2019 to 2034

Figure 110: Western Europe Market Value Share (%) and BPS Analysis by Distribution Channels, 2024 to 2034

Figure 111: Western Europe Market Y-o-Y Growth (%) Projections by Distribution Channels, 2024 to 2034

Figure 112: Western Europe Market Value (US$ Million) Analysis by Applications, 2019 to 2034

Figure 113: Western Europe Market Volume (Units) Analysis by Applications, 2019 to 2034

Figure 114: Western Europe Market Value Share (%) and BPS Analysis by Applications, 2024 to 2034

Figure 115: Western Europe Market Y-o-Y Growth (%) Projections by Applications, 2024 to 2034

Figure 116: Western Europe Market Attractiveness by Types, 2024 to 2034

Figure 117: Western Europe Market Attractiveness by Materials, 2024 to 2034

Figure 118: Western Europe Market Attractiveness by Distribution Channels, 2024 to 2034

Figure 119: Western Europe Market Attractiveness by Applications, 2024 to 2034

Figure 120: Western Europe Market Attractiveness by Country, 2024 to 2034

Figure 121: Eastern Europe Market Value (US$ Million) by Types, 2024 to 2034

Figure 122: Eastern Europe Market Value (US$ Million) by Materials, 2024 to 2034

Figure 123: Eastern Europe Market Value (US$ Million) by Distribution Channels, 2024 to 2034

Figure 124: Eastern Europe Market Value (US$ Million) by Applications, 2024 to 2034

Figure 125: Eastern Europe Market Value (US$ Million) by Country, 2024 to 2034

Figure 126: Eastern Europe Market Value (US$ Million) Analysis by Country, 2019 to 2034

Figure 127: Eastern Europe Market Volume (Units) Analysis by Country, 2019 to 2034

Figure 128: Eastern Europe Market Value Share (%) and BPS Analysis by Country, 2024 to 2034

Figure 129: Eastern Europe Market Y-o-Y Growth (%) Projections by Country, 2024 to 2034

Figure 130: Eastern Europe Market Value (US$ Million) Analysis by Types, 2019 to 2034

Figure 131: Eastern Europe Market Volume (Units) Analysis by Types, 2019 to 2034

Figure 132: Eastern Europe Market Value Share (%) and BPS Analysis by Types, 2024 to 2034

Figure 133: Eastern Europe Market Y-o-Y Growth (%) Projections by Types, 2024 to 2034

Figure 134: Eastern Europe Market Value (US$ Million) Analysis by Materials, 2019 to 2034

Figure 135: Eastern Europe Market Volume (Units) Analysis by Materials, 2019 to 2034

Figure 136: Eastern Europe Market Value Share (%) and BPS Analysis by Materials, 2024 to 2034

Figure 137: Eastern Europe Market Y-o-Y Growth (%) Projections by Materials, 2024 to 2034

Figure 138: Eastern Europe Market Value (US$ Million) Analysis by Distribution Channels, 2019 to 2034

Figure 139: Eastern Europe Market Volume (Units) Analysis by Distribution Channels, 2019 to 2034

Figure 140: Eastern Europe Market Value Share (%) and BPS Analysis by Distribution Channels, 2024 to 2034

Figure 141: Eastern Europe Market Y-o-Y Growth (%) Projections by Distribution Channels, 2024 to 2034

Figure 142: Eastern Europe Market Value (US$ Million) Analysis by Applications, 2019 to 2034

Figure 143: Eastern Europe Market Volume (Units) Analysis by Applications, 2019 to 2034

Figure 144: Eastern Europe Market Value Share (%) and BPS Analysis by Applications, 2024 to 2034

Figure 145: Eastern Europe Market Y-o-Y Growth (%) Projections by Applications, 2024 to 2034

Figure 146: Eastern Europe Market Attractiveness by Types, 2024 to 2034

Figure 147: Eastern Europe Market Attractiveness by Materials, 2024 to 2034

Figure 148: Eastern Europe Market Attractiveness by Distribution Channels, 2024 to 2034

Figure 149: Eastern Europe Market Attractiveness by Applications, 2024 to 2034

Figure 150: Eastern Europe Market Attractiveness by Country, 2024 to 2034

Figure 151: South Asia and Pacific Market Value (US$ Million) by Types, 2024 to 2034

Figure 152: South Asia and Pacific Market Value (US$ Million) by Materials, 2024 to 2034

Figure 153: South Asia and Pacific Market Value (US$ Million) by Distribution Channels, 2024 to 2034

Figure 154: South Asia and Pacific Market Value (US$ Million) by Applications, 2024 to 2034

Figure 155: South Asia and Pacific Market Value (US$ Million) by Country, 2024 to 2034

Figure 156: South Asia and Pacific Market Value (US$ Million) Analysis by Country, 2019 to 2034

Figure 157: South Asia and Pacific Market Volume (Units) Analysis by Country, 2019 to 2034

Figure 158: South Asia and Pacific Market Value Share (%) and BPS Analysis by Country, 2024 to 2034

Figure 159: South Asia and Pacific Market Y-o-Y Growth (%) Projections by Country, 2024 to 2034

Figure 160: South Asia and Pacific Market Value (US$ Million) Analysis by Types, 2019 to 2034

Figure 161: South Asia and Pacific Market Volume (Units) Analysis by Types, 2019 to 2034

Figure 162: South Asia and Pacific Market Value Share (%) and BPS Analysis by Types, 2024 to 2034

Figure 163: South Asia and Pacific Market Y-o-Y Growth (%) Projections by Types, 2024 to 2034

Figure 164: South Asia and Pacific Market Value (US$ Million) Analysis by Materials, 2019 to 2034

Figure 165: South Asia and Pacific Market Volume (Units) Analysis by Materials, 2019 to 2034

Figure 166: South Asia and Pacific Market Value Share (%) and BPS Analysis by Materials, 2024 to 2034

Figure 167: South Asia and Pacific Market Y-o-Y Growth (%) Projections by Materials, 2024 to 2034

Figure 168: South Asia and Pacific Market Value (US$ Million) Analysis by Distribution Channels, 2019 to 2034

Figure 169: South Asia and Pacific Market Volume (Units) Analysis by Distribution Channels, 2019 to 2034

Figure 170: South Asia and Pacific Market Value Share (%) and BPS Analysis by Distribution Channels, 2024 to 2034

Figure 171: South Asia and Pacific Market Y-o-Y Growth (%) Projections by Distribution Channels, 2024 to 2034

Figure 172: South Asia and Pacific Market Value (US$ Million) Analysis by Applications, 2019 to 2034

Figure 173: South Asia and Pacific Market Volume (Units) Analysis by Applications, 2019 to 2034

Figure 174: South Asia and Pacific Market Value Share (%) and BPS Analysis by Applications, 2024 to 2034

Figure 175: South Asia and Pacific Market Y-o-Y Growth (%) Projections by Applications, 2024 to 2034

Figure 176: South Asia and Pacific Market Attractiveness by Types, 2024 to 2034

Figure 177: South Asia and Pacific Market Attractiveness by Materials, 2024 to 2034

Figure 178: South Asia and Pacific Market Attractiveness by Distribution Channels, 2024 to 2034

Figure 179: South Asia and Pacific Market Attractiveness by Applications, 2024 to 2034

Figure 180: South Asia and Pacific Market Attractiveness by Country, 2024 to 2034

Figure 181: East Asia Market Value (US$ Million) by Types, 2024 to 2034

Figure 182: East Asia Market Value (US$ Million) by Materials, 2024 to 2034

Figure 183: East Asia Market Value (US$ Million) by Distribution Channels, 2024 to 2034

Figure 184: East Asia Market Value (US$ Million) by Applications, 2024 to 2034

Figure 185: East Asia Market Value (US$ Million) by Country, 2024 to 2034

Figure 186: East Asia Market Value (US$ Million) Analysis by Country, 2019 to 2034

Figure 187: East Asia Market Volume (Units) Analysis by Country, 2019 to 2034

Figure 188: East Asia Market Value Share (%) and BPS Analysis by Country, 2024 to 2034

Figure 189: East Asia Market Y-o-Y Growth (%) Projections by Country, 2024 to 2034

Figure 190: East Asia Market Value (US$ Million) Analysis by Types, 2019 to 2034

Figure 191: East Asia Market Volume (Units) Analysis by Types, 2019 to 2034

Figure 192: East Asia Market Value Share (%) and BPS Analysis by Types, 2024 to 2034

Figure 193: East Asia Market Y-o-Y Growth (%) Projections by Types, 2024 to 2034

Figure 194: East Asia Market Value (US$ Million) Analysis by Materials, 2019 to 2034

Figure 195: East Asia Market Volume (Units) Analysis by Materials, 2019 to 2034

Figure 196: East Asia Market Value Share (%) and BPS Analysis by Materials, 2024 to 2034

Figure 197: East Asia Market Y-o-Y Growth (%) Projections by Materials, 2024 to 2034

Figure 198: East Asia Market Value (US$ Million) Analysis by Distribution Channels, 2019 to 2034

Figure 199: East Asia Market Volume (Units) Analysis by Distribution Channels, 2019 to 2034

Figure 200: East Asia Market Value Share (%) and BPS Analysis by Distribution Channels, 2024 to 2034

Figure 201: East Asia Market Y-o-Y Growth (%) Projections by Distribution Channels, 2024 to 2034

Figure 202: East Asia Market Value (US$ Million) Analysis by Applications, 2019 to 2034

Figure 203: East Asia Market Volume (Units) Analysis by Applications, 2019 to 2034

Figure 204: East Asia Market Value Share (%) and BPS Analysis by Applications, 2024 to 2034

Figure 205: East Asia Market Y-o-Y Growth (%) Projections by Applications, 2024 to 2034

Figure 206: East Asia Market Attractiveness by Types, 2024 to 2034

Figure 207: East Asia Market Attractiveness by Materials, 2024 to 2034

Figure 208: East Asia Market Attractiveness by Distribution Channels, 2024 to 2034

Figure 209: East Asia Market Attractiveness by Applications, 2024 to 2034

Figure 210: East Asia Market Attractiveness by Country, 2024 to 2034

Figure 211: Middle East and Africa Market Value (US$ Million) by Types, 2024 to 2034

Figure 212: Middle East and Africa Market Value (US$ Million) by Materials, 2024 to 2034

Figure 213: Middle East and Africa Market Value (US$ Million) by Distribution Channels, 2024 to 2034

Figure 214: Middle East and Africa Market Value (US$ Million) by Applications, 2024 to 2034

Figure 215: Middle East and Africa Market Value (US$ Million) by Country, 2024 to 2034

Figure 216: Middle East and Africa Market Value (US$ Million) Analysis by Country, 2019 to 2034

Figure 217: Middle East and Africa Market Volume (Units) Analysis by Country, 2019 to 2034

Figure 218: Middle East and Africa Market Value Share (%) and BPS Analysis by Country, 2024 to 2034

Figure 219: Middle East and Africa Market Y-o-Y Growth (%) Projections by Country, 2024 to 2034

Figure 220: Middle East and Africa Market Value (US$ Million) Analysis by Types, 2019 to 2034

Figure 221: Middle East and Africa Market Volume (Units) Analysis by Types, 2019 to 2034

Figure 222: Middle East and Africa Market Value Share (%) and BPS Analysis by Types, 2024 to 2034

Figure 223: Middle East and Africa Market Y-o-Y Growth (%) Projections by Types, 2024 to 2034

Figure 224: Middle East and Africa Market Value (US$ Million) Analysis by Materials, 2019 to 2034

Figure 225: Middle East and Africa Market Volume (Units) Analysis by Materials, 2019 to 2034

Figure 226: Middle East and Africa Market Value Share (%) and BPS Analysis by Materials, 2024 to 2034

Figure 227: Middle East and Africa Market Y-o-Y Growth (%) Projections by Materials, 2024 to 2034

Figure 228: Middle East and Africa Market Value (US$ Million) Analysis by Distribution Channels, 2019 to 2034

Figure 229: Middle East and Africa Market Volume (Units) Analysis by Distribution Channels, 2019 to 2034

Figure 230: Middle East and Africa Market Value Share (%) and BPS Analysis by Distribution Channels, 2024 to 2034

Figure 231: Middle East and Africa Market Y-o-Y Growth (%) Projections by Distribution Channels, 2024 to 2034

Figure 232: Middle East and Africa Market Value (US$ Million) Analysis by Applications, 2019 to 2034

Figure 233: Middle East and Africa Market Volume (Units) Analysis by Applications, 2019 to 2034

Figure 234: Middle East and Africa Market Value Share (%) and BPS Analysis by Applications, 2024 to 2034

Figure 235: Middle East and Africa Market Y-o-Y Growth (%) Projections by Applications, 2024 to 2034

Figure 236: Middle East and Africa Market Attractiveness by Types, 2024 to 2034

Figure 237: Middle East and Africa Market Attractiveness by Materials, 2024 to 2034

Figure 238: Middle East and Africa Market Attractiveness by Distribution Channels, 2024 to 2034

Figure 239: Middle East and Africa Market Attractiveness by Applications, 2024 to 2034

Figure 240: Middle East and Africa Market Attractiveness by Country, 2024 to 2034

Frequently Asked Questions

How Big is the Houseware Market?

The size of the houseware market in 2024 is expected to be USD 343 billion.

How Big Will the Houseware Market Get by 2034?

By 2034, the size of the houseware market will be as big as USD 513 billion.

What is the CAGR of the Houseware Market in India?

For the period from 2024 to 2034, the houseware market is expected to progress at a CAGR of 5.5% in India.

What is the Popular Product Type in Houseware?

Kitchen appliances are the popular type of houseware, with an expected market share of 33.3% in 2024.

What are the Ongoing Trends in the Houseware Market?

Sustainable products and customized home appliances are two of the trends in the houseware market.

Future Market Insights

Houseware Market