The Ink-Cartridge Market is estimated to be valued at USD 21.8 billion in 2025 and is projected to reach USD 41.8 billion by 2035, registering a compound annual growth rate (CAGR) of 6.7% over the forecast period.
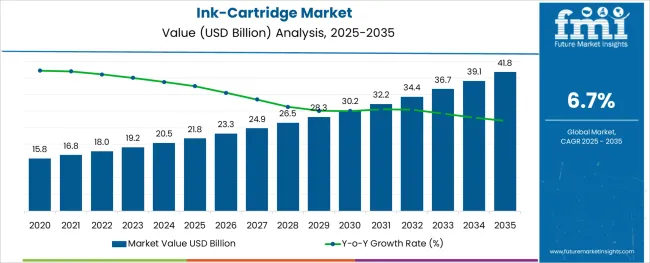
The ink cartridge market is witnessing sustained growth, supported by technological advancements in printing hardware and evolving business requirements for high-quality, cost-effective printing solutions. Demand from enterprise, government, and education sectors remains robust, especially with the return to office environments and expanded remote printing setups.
Innovation in ink formulation and cartridge design is leading to extended shelf life, higher page yield, and reduced maintenance needs. Environmental concerns have driven a rise in remanufacturable and refillable solutions, while OEMs are enhancing smart chip integration to monitor ink levels, prevent leaks, and deter counterfeiting. Additionally, strategic partnerships between printer manufacturers and managed print service providers are creating long-term contract models, further anchoring demand.
As digital transformation drives document-intensive industries to optimize print infrastructure, ink cartridge consumption is expected to remain stable with future opportunities focused on sustainable materials, multi-cartridge systems, and smart ink monitoring capabilities integrated into enterprise IT frameworks.
The market is segmented by Type and End-User and region. By Type, the market is divided into One-piece and Split-type. In terms of End-User, the market is classified into For commercial, For others, and For governmental. Regionally, the market is classified into North America, Latin America, Western Europe, Eastern Europe, Balkan & Baltic Countries, Russia & Belarus, Central Asia, East Asia, South Asia & Pacific, and the Middle East & Africa.
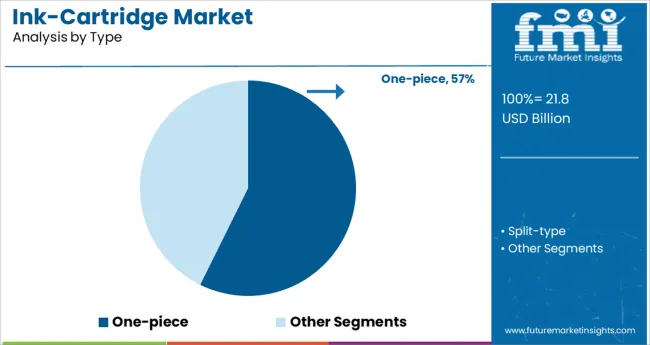
The one-piece type segment is anticipated to account for 57.3% of the ink cartridge market revenue in 2025, making it the dominant configuration. This leadership is attributed to its all-in-one structure that integrates the ink tank and printhead, simplifying installation and reducing user maintenance.
The convenience and reliability offered by one-piece cartridges make them preferred in fast-paced environments where print quality and speed are critical. Furthermore, printer manufacturers often design one-piece systems as proprietary units, ensuring optimal performance and brand loyalty.
The segment has also benefited from its compatibility with compact and home-office printers, where ease of use and consistent output are essential. Enhanced engineering in recent models has improved ink dispersion and nozzle durability, reinforcing its strong presence across a broad user base. These factors collectively support the continued dominance of the one-piece cartridge segment in global markets.
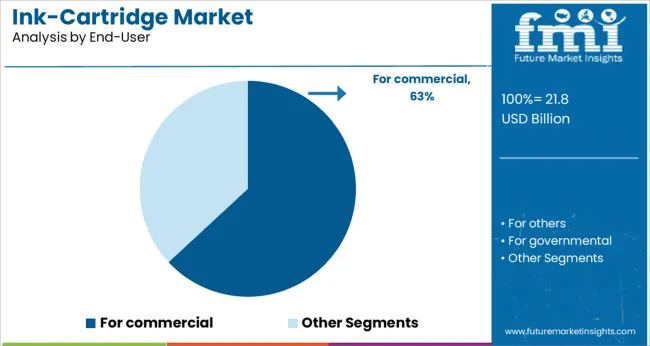
The commercial end-user segment is projected to lead the ink cartridge market with a 63.1% revenue share in 2025. This dominance stems from the persistent need for high-volume, high-quality printing in sectors such as finance, legal, education, healthcare, and government.
Commercial settings require consistent performance, sharp text output, and reduced printer downtime, all of which are supported by reliable ink cartridge systems. As enterprises continue to digitize workflows, the demand for hybrid solutions combining digital and physical documentation has intensified, sustaining print volumes.
Additionally, managed print services and subscription-based models have seen widespread commercial adoption, allowing businesses to maintain predictable supply cycles and reduce operational disruptions. Investments in smart cartridge tracking, predictive maintenance, and fleet-wide print monitoring have further aligned ink cartridge procurement with broader IT strategies. These trends are expected to secure the commercial segment’s dominant position in the coming years.
Development in the education sector is projected to increase printer usage, which will boost the overall ink cartridge market. The increased number of educational institutions and growing awareness of the importance of education have boosted the creation of educational books, journals, and other materials, which stimulates the use of printers.
Printers are also commonly utilized in government organizations, offices, and hospitals, which benefits the ink cartridge industry. These factors have a positive impact on the market and are projected to grow during the forecast years.
Key improvements in the ink-cartridge market include the introduction of inkjet hardcopy peripherals that offer ink tanks with extraordinarily high page yield at a very cheap cost of print per page. These improvements are projected to help the worldwide ink-cartridge market, resulting in increased global demand.
New product introductions give clients more options and broaden the product's market utilization. For example, in 2024, HP announced the global introduction of HP+, it's an intelligent printing system that is secure, productive, and environmentally sustainable. Such advancements will boost demand in the worldwide ink-cartridge market.
The decrease in ink-cartridge pricing will stimulate ink-cartridge demand even more. Furthermore, the transfer of users from tri-color cartridges to ink cartridges for better quality printing has resulted in increased usage of ink cartridges.
Because of the additional functionality afforded by laser tones, the demand for ink cartridges has decreased since their introduction. This is the biggest impediment to the global ink cartridge market.
Cyan ink has a potential environmental impact, but magenta and yellow inks are not. Skin and eye contact are two potential pathways of overexposure to this substance. Inhalation might cause respiratory inflammation. Ingestion can cause nausea, vomiting, and diarrhea. Metal nitrate contact may induce eye and skin rashes. Inhalation might cause respiratory inflammation. These constraints impede the expansion of the ink cartridge market.
End-user segments for the global printer ink cartridges market include commercial use, office use, and others. The commercial sector led the market in 2024 and is likely to maintain its dominance throughout the forecast period.
The rising acceptability of printers for marketing and branding operations in several end-use industry verticals such as retail, consumer goods, textile, and clothing has helped to the segment's growth.
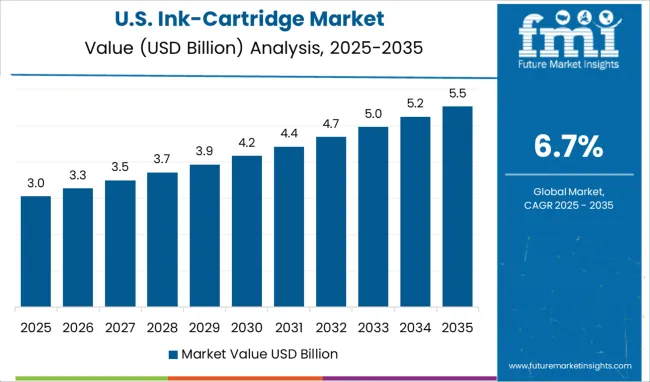
In terms of market share and revenue, the North American market is expected to dominate the global ink-cartridge market during the projection period of 2025 to 2035. The analysts at Future Market Insights predict that by 2025, the market of Ink-cartridges in North America is expected to acquire a global market size of 35.3%.
North America is likely to lead the global market for printer ink cartridges. Third-party vendors' increased use of compatible, relatively low-cost ink cartridges has supported the regional spread of the printer ink cartridges market. Major printer manufacturers are transitioning from ink cartridge printers to high-capacity ink tank printers because they have a less environmental impact than laser printers and even ink cartridge printers, and they offer significant cost savings.
The copier market grew as a result of rising government demand and ongoing government oversight of the refurbished copier market in the USA These advancements in the printer market are expected to boost the expansion of the North American printer cartridge market.
By 2025, Europe will hold approximately 20.7% of the global market share. This region is expected to grow steadily during the forecast period, 2025 to 2035.
In Europe, Italy and Germany have the largest markets for printer ink cartridges. Leading printer ink cartridge manufacturers have broad distribution networks and a diverse product selection.
Several printer ink cartridge manufacturers are working on product portfolio innovation to enhance sales and customer base. These factors are driving the growth of the European ink cartridge market.
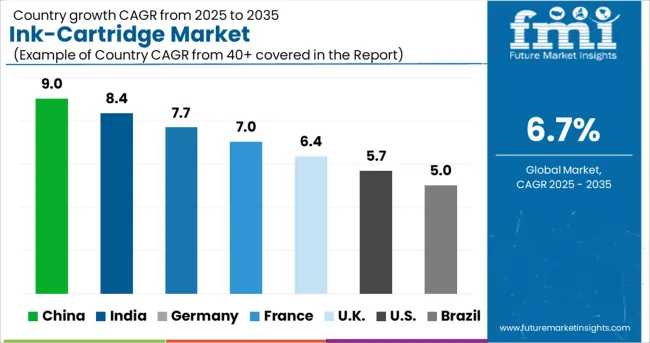
Over the forecast period, the Asia Pacific Ink Cartridges Market is expected to develop at the quickest CAGR. China and India are the two largest markets for printer ink cartridges. Leading printer ink cartridge manufacturers have extensive distribution networks and a wide range of products.
Several ink cartridge manufacturers are working on product innovation to increase sales and expand their consumer base. As a result of these factors, the Asia Pacific market for ink cartridges is expanding.
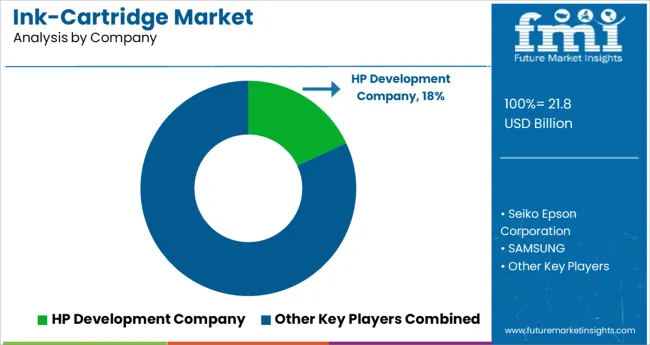
The key players in this market include HP Development Company, L.P., Seiko Epson Corporation, SAMSUNG, Canon, Panasonic Corporation, Dell, Xerox Corporation, Lexmark International, Inc., and Fuji Xerox Co., Ltd.
Print Smart Solutions is a Bangalore-based start-up with an NRI financing of USD 21.8 million. Print Smart manufactures Laser Printer Toner cartridges in its Bangalore facility in accordance with the Make in India concept. In 2025, the company intends to target the quality-conscious niche with its Zero Defect philosophy. Each cartridge manufactured is print tested to assure dependability and quality.
The primary goal is to provide cartridges that can replace pricey OEM cartridges. Currently, approximately 80% of the components and raw materials used in production are imported from major manufacturers in other countries. The objective is to gradually reduce dependency and contribute to Indian industrial progress.
| Report Attribute | Details |
|---|---|
| Growth Rate | 6.7% CAGR |
| Market value in 2025 | USD 21.8 billion |
| Market value in 2035 | USD 41.8 billion |
| Base Year for Estimation | 2024 |
| Historical Data | 2020 to 2024 |
| Forecast Period | 2025 to 2035 |
| Quantitative Units | million for Value |
| Report Coverage | Revenue Forecast, Volume Forecast, Company Ranking, Competitive Landscape, Growth Factors, Trends, and Pricing Analysis |
| Segments Covered | Type, End-user, Region |
| Regions Covered | North America; Latin America; Europe; Asia Pacific; Middle East & Africa |
| Key Countries Profiled | United States of America, Canada, Mexico, Brazil, Germany, Italy, France, United Kingdom, Rest of L.A, Nordic countries, Belgium, Netherlands, Luxembourg, Poland, Russia, Rest Of Eastern Europe, China, India, ASIAN, Australia, New Zealand, Japan, GCC Countries, S. Africa, N. Africa, Rest of the Middle East and Africa |
| Key Companies Profiled | HP Development Company, L.P.; Seiko Epson Corporation; SAMSUNG; Canon; Panasonic Corporation; Dell; Xerox Corporation; Lexmark International, Inc.; Fuji Xerox Co., Ltd. |
| Customisation Scope | Available on Request |
The global ink-cartridge market is estimated to be valued at USD 21.8 billion in 2025.
It is projected to reach USD 41.8 billion by 2035.
The market is expected to grow at a 6.7% CAGR between 2025 and 2035.
The key product types are one-piece and split-type.
for commercial segment is expected to dominate with a 63.1% industry share in 2025.


Our Research Products

The "Full Research Suite" delivers actionable market intel, deep dives on markets or technologies, so clients act faster, cut risk, and unlock growth.

The Leaderboard benchmarks and ranks top vendors, classifying them as Established Leaders, Leading Challengers, or Disruptors & Challengers.

Locates where complements amplify value and substitutes erode it, forecasting net impact by horizon

We deliver granular, decision-grade intel: market sizing, 5-year forecasts, pricing, adoption, usage, revenue, and operational KPIs—plus competitor tracking, regulation, and value chains—across 60 countries broadly.

Spot the shifts before they hit your P&L. We track inflection points, adoption curves, pricing moves, and ecosystem plays to show where demand is heading, why it is changing, and what to do next across high-growth markets and disruptive tech

Real-time reads of user behavior. We track shifting priorities, perceptions of today’s and next-gen services, and provider experience, then pace how fast tech moves from trial to adoption, blending buyer, consumer, and channel inputs with social signals (#WhySwitch, #UX).

Partner with our analyst team to build a custom report designed around your business priorities. From analysing market trends to assessing competitors or crafting bespoke datasets, we tailor insights to your needs.
Supplier Intelligence
Discovery & Profiling
Capacity & Footprint
Performance & Risk
Compliance & Governance
Commercial Readiness
Who Supplies Whom
Scorecards & Shortlists
Playbooks & Docs
Category Intelligence
Definition & Scope
Demand & Use Cases
Cost Drivers
Market Structure
Supply Chain Map
Trade & Policy
Operating Norms
Deliverables
Buyer Intelligence
Account Basics
Spend & Scope
Procurement Model
Vendor Requirements
Terms & Policies
Entry Strategy
Pain Points & Triggers
Outputs
Pricing Analysis
Benchmarks
Trends
Should-Cost
Indexation
Landed Cost
Commercial Terms
Deliverables
Brand Analysis
Positioning & Value Prop
Share & Presence
Customer Evidence
Go-to-Market
Digital & Reputation
Compliance & Trust
KPIs & Gaps
Outputs
Full Research Suite comprises of:
Market outlook & trends analysis
Interviews & case studies
Strategic recommendations
Vendor profiles & capabilities analysis
5-year forecasts
8 regions and 60+ country-level data splits
Market segment data splits
12 months of continuous data updates
DELIVERED AS:
PDF EXCEL ONLINE

Thank you!
You will receive an email from our Business Development Manager. Please be sure to check your SPAM/JUNK folder too.
Chat With
MaRIA