Reports

- Global Locations -

Headquarters

Future Market Insights, Inc.

Christiana Corporate, 200
Continental Drive, Suite 401,
Newark, Delaware - 19713,
United States

T: +1-845-579-5705

Americas

Future Market Insights, Inc.

616 Corporate Way, Suite 2-9018,
Valley Cottage, NY 10989, United States

T: +1-347-918-3531

MEA

Future Market Insights

1602-6 Jumeirah Bay X2 Tower, Plot No: JLT-PH2-X2A,
Jumeirah Lakes Towers, Dubai,
United Arab Emirates

Europe

Future Market Insights

3rd Floor, 207 Regent Street,
W1B 3HH London
United Kingdom

T: + 44 (0) 20 8123 9659
D: +44 (0) 20 3287 4268

Asia Pacific

Future Market Insights

IndiaLand Global Tech Park, Unit UG-1, Behind Grand HighStreet, Phase 1, Hinjawadi, MH, Pune – 411057, India

Isoflavones Market Outlook (2022-2032)

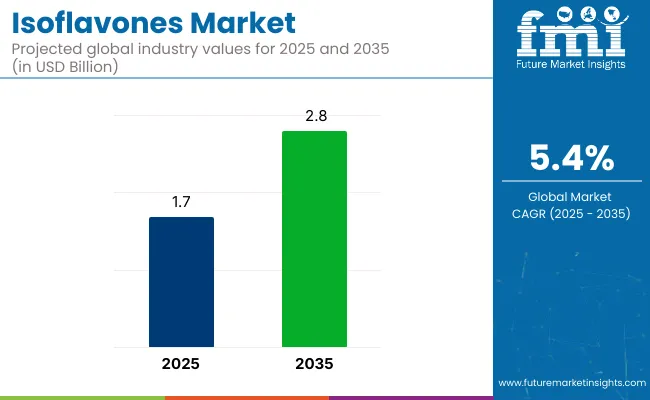
[250 Pages Report] The isoflavones market is valued at USD 1.4 Bn in 2022 and is projected to grow at a CAGR of 5.5% during the forecast period, to reach a value of USD 2.3 Bn by 2032. Newly released data from Future Market Insights market analysis shows that global isoflavones demand is projected to grow year-on-year (Y-o-Y) growth of 5.2% in 2022.

Attribute Details
Market Size Value in 2022 USD 1.4 Billion
Market Forecast Value in 2032 USD 2.3 Billion
Global Growth Rate (2022 to 2032) ~5.5% CAGR
Forecast Period 2022 to 2032
Collective Value Share: Top 3 Countries (2021A) 43.3%

Isoflavones are phytoestrogens, also known as plant-based estrogens, which are naturally occurring phenolic and non-steroidal plant compounds and can exhibit similar properties as vertebrate estrogens, because of its molecular size, structure, and resemblance. The compound can easily work like estrogen in human body and are found in soybeans, chickpeas, fava beans, pistachios, peanuts, and other fruits and nuts naturally.

Don't pay for what you don't need

Customize your report by selecting specific countries or regions and save 30%!

2017-2021 Isoflavones Market Outlook Compared to 2022-2032 Forecast

Isoflavones demand grew at 4.6% CAGR between 2017 and 2021. The dietary sources of isoflavones for humans are mainly found in soybean and its byproducts, which contain genistein and daidzein, possessing both estrogenic and anti-estrogenic effects. Isoflavones are proved to be chemo-protective and may be used in alternative therapies for cardiovascular diseases, several cancer types including breast and prostate cancer, osteoporosis, hormonal disorders, and menopausal symptoms.

Isoflavones Market

When it comes to food items, the maximum amount of isoflavones can be found in unprocessed soy sources, such as tempeh, edamame, miso, tofu, and soymilk, including daidzein, genistein, and glycetein in the products. Being a naturally sourced item, the industry has revolutionized over the period and it is further projected to grow at a CAGR worth 5.5% in the forecasted year of 2022-2032.

Isoflavones market along with organic natured segment, liquid form segment, soybean as a source segment, and nutraceuticals & dietary supplements as application segment are projected to reflect favorable growth outlook in terms of production and revenue, according to the annual market analysis conducted by Future Market Insights.

Country-wise Insights

Plant-based Isoflavones with Holistic Formulation Are Propelling Demand in the US

According to research, more than one million American women with 50-52 average age reach menopause stage every year due to estrogen deficiency with natural aging process, among which 75% of US women experience hot flashes like heavy and bothersome symptoms. Brands like ADM has come up with naturally sourced soy isoflavones for those menopausal women while offering solution by reducing the severity and frequency of hot flashes with plant-based and holistic approach for health-conscious consumers.

Isoflavones Epidemiology as a Dietary Intake Are Boosting Product Growth in Japan

Japanese diet type includes soybeans as a healthy food not only because of the high plant protein and calcium, and low calorie and fat intake, but also the isoflavones content in it. Several surveys in Japan is being done regularly for plant-based isoflavones enabling establishment of intake standards based on the dietary intake of soy products. According to the recent Japanese epidemiological studies, breast cancer risk has severely decreased among people with isoflavones-based diet.

Biotransformation Processes of Soymilk Isoflavones Are Boosting Product Sales in Brazil

Soymilk isoflavones have potential to several health benefits, such as being a possible adjuvant in inflammatory process, or defending intestinal cells during oxidative damage. Brazil has developed biotransformed soymilk with probiotic strains and tannase to increase the activity of the product which can act as a powerful isoflavones nutraceutical agent while enhancing anti-inflammatory potential to improve intestinal cellular model of human body, thus driving the product growth in the country.

Nandini Roy Choudhury

Principal Consultant

Talk to Analyst

Find your sweet spots for generating winning opportunities in this market.

Category-wise Insights

Organic Isoflavones Are Ramping up in Sales Being High Source of Micronutrients

Organic isoflavones demand is increasing among consumers as the ingredients are recognized for ethical and healthy choice and valued for their organic labels in terms of environmental and nutritional impact. Brands like Frutarom Health are making such products with naturally high source of micronutrients which can work in combination with isoflavones to alleviate menopausal symptoms, promote cardiovascular health and bone strength, and improving skin care and gut health as well.

Liquid Form of Isoflavones Are Gaining Popularity among Consumers

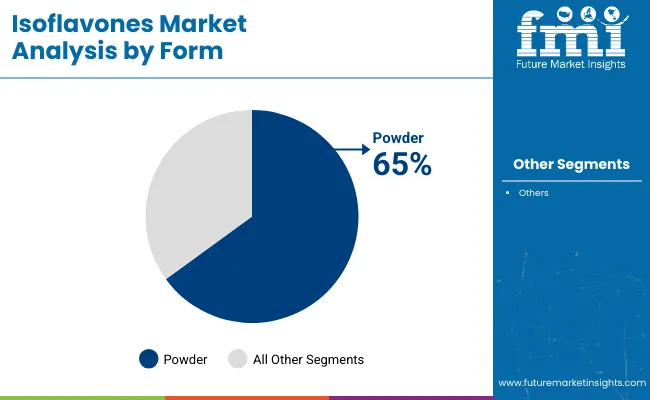
As isoflavones supplements are not FDA regulated in most cases, there are recommendations that the dosage and strength of isoflavones supplements must follow clinical research data recommendations to ensure the effectiveness and quality in those supplements. Though powder supplements are cheaper to make, but dieticians instruct to avoid the form because of weaker strength. The best way to get isoflavones supplements is in its liquid form which is made via natural extract of the product.

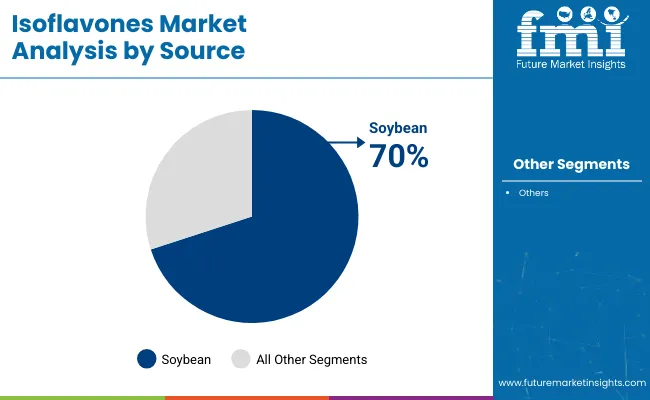
Soybean Sourced Isoflavones Are Dominating in both Production and Consumption

Soybean is known for a good source of fibre, protein, and omega-3 ingredients, which is a low in saturated fat and naturally cholesterol-free food item along with the beneficial fatty acid profile to ensure lower risk of heart disease and its high isoflavones content. All of the aforementioned benefits make the item a perfect raw material of natural and non-GMO isoflavones production process.

Isoflavones brands like Novasoy® offers 20-70% concentrations of soybean sourced isoflavones in different product ranges, such as NovaSoy® Isoflavones Concentrate 20% which is a fine powder to be used in food ingredients and bars, Novasoy® 152-400 with 40% isoflavones content with the form of fine powder, NovaSoy® 152-650 with 65% isoflavones content, and NovaSoy® Isoflavones Concentrate 70% which is a fine powder to be used in functional beverages.

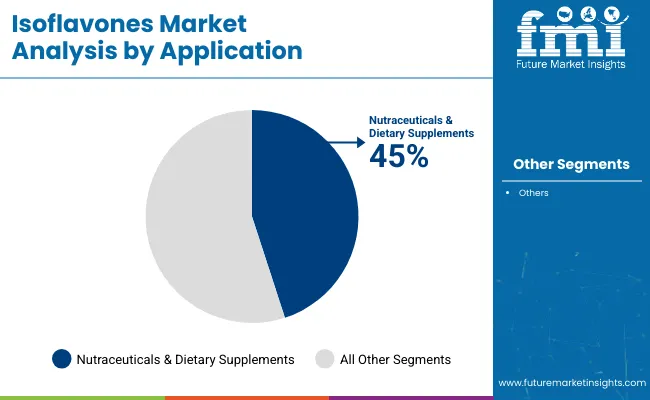
Isoflavones as Functional Food Ingredient Are Boosting Sales in Nutraceuticals Industry

Isoflavones are typically considered as a nutritional supplement, which is a naturally occurring compound in almost all of the Leguminosae (Fabaceae or bean) family and a few herbs like alfalfa and red clover. The anti-oxidant isoflavones characteristics are considered perfect for fighting against certain types of cancer like breast cancer, with a daily dose of 40-80 mg per day if it is red clover sourced and 40-120 mg per day if it is soybean sourced.

As a result, several isoflavones manufacturers like Cargill, Inc. are constantly putting hard work on research and developing functional food ingredients containing isoflavones while the products are being awarded with GRAS (Generally Recognized as Safe) certification.

Competitive Landscape

Key isoflavones manufacturers are focusing on product growth strategies, and product launches, while paving the way for business expansion with end-to-end traceability and total authenticity for isoflavones production for specific industry applications. As consumers focus on increased sustainability with improved nutritional profile and cleaner label product in recent times, key isoflavones brands are ensuring product growth with sustainable strategies.

For Instance,

  • On September, 2019, Frutarom Health, a US-based healthy nutrients manufacturer and division of International Flavors & Fragrances Inc., released a new range of organic soy ingredients with naturally rich isoflavones content, named as Organic SoyLife Complex, which has been granted the organic certification, BE-BIO-01, by Certisys.

Get the data you need at a Fraction of the cost

Personalize your report by choosing insights you need
and save 40%!

Scope of Report

Attribute Details
Market Size Value in 2022 USD 1.4 Billion
Market Forecast Value in 2032 USD 2.3 Billion
Global Growth Rate ~5.5% CAGR
Forecast Period 2022 to 2032
Historical Data Available for 2017 to 2021
Market Analysis MT for Volume and USD Million for Value
Key Regions Covered North America, Latin America, Europe, East Asia, South Asia, Oceania and MEA
Key Countries Covered United States, Canada, Brazil, Mexico, Argentina, Chile, Peru, Germany, France, Italy, Spain, UK, Netherlands, Belgium, Nordic, Russia, China, Japan, South Korea, India, Thailand, Malaysia, Indonesia, Singapore, Australia, New Zealand, GCC Countries, South Africa, Central Africa, North Africa, and others
Key Market Segments Covered Nature, Form, Source, Application, and Regions
Key Companies Profiled
  • Cargill, Inc.
  • Archer Daniels Midland Company
  • BASF SE
  • International Flavors and Fragrances
  • NutraScience Labs
  • Otsuka Pharmaceutical Co., Ltd.
  • Frutarom Industries Ltd.
  • Fujicco Co., Ltd.
  • Parchem Fine & Specialty Chemicals
  • FUJIFILM Wako Pure Chemical Corporation
  • Others
Pricing Available upon Request

Isoflavones Market Segmentation

By Nature:

  • Organic
  • Conventional

By Form:

  • Powder
  • Liquid
  • Wax

By Source:

  • Soybean
  • Peanut
  • Chickpea
  • Clover
  • Others

By Application:

  • Food & Beverages
  • Nutraceuticals & Dietary Supplements
  • Pharmaceuticals
  • Cosmetics & Personal Care
  • Others

By Region:

  • North America
  • Latin America
  • Europe
  • East Asia
  • South Asia
  • Oceania
  • Middle east and Africa

Frequently Asked Questions

How much worth is the Isoflavones industry?

The Isoflavones market is estimated to reach sales nearly USD 1.4 Bn by 2022.

At what CAGR is the market poised to expand through 2032?

Isoflavones market revenue is expected to increase at a CAGR of around 5.5% during the period 2022-2032.

How was the performance of Isoflavones been over the past half-decade?

Isoflavones sales increased a CAGR of around 4.6% over the past half-decade.

What will be the market for Isoflavones worth in 2032?

The global Isoflavones market value will be around USD 2.3 Bn in 2032.

Who are the key players operating in the market?

Cargill, Inc., Archer Daniels Midland Company, BASF SE, International Flavors and Fragrances, and NutraScience Labs are expected to be the top players driving the market growth.

Which are the top countries driving the Isoflavones market demand?

Top countries driving the Isoflavones demand are the U.S., Germany, Japan, UK, and China.

What are the benefits of isoflavones?

The potential health benefits include protection against diseases, such as osteoporosis, cardiovascular disease, loss of cognitive function, and hormone-dependent cancer.

What foods are high in isoflavones??

Soy and its by-products, some herbs (alfalfa and red clover), legume seeds (beans, lentils, and peas) are some of the rich sources of isoflavones. Small amounts of isoflavones can be found in other plant products, such as potatoes, cereals, and other vegetables and fruits, along with meat, milk, and beer.

Table of Content

1. Market Overview

    1.1. Market Coverage / Taxonomy

    1.2. Market Definition / Scope / Limitations

2. The Massive Impact of the Crisis

    2.1. Global Market Forecast Scenario Comparison of Annual Growth Rates for short Term (2022-2026) and Long Term (2027-2032)

        2.1.1. Optimistic Scenario

            2.1.1.1. China

            2.1.1.2. US

            2.1.1.3. India

            2.1.1.4. Euro Zone

            2.1.1.5. Asia Pacific 

            2.1.1.6. Rest of the World

        2.1.2. Likely Scenario

            2.1.2.1. China

            2.1.2.2. US

            2.1.2.3. India

            2.1.2.4. Euro Zone

            2.1.2.5. Asia Pacific 

            2.1.2.6. Rest of the World

        2.1.3. Pessimistic Scenario

            2.1.3.1. China

            2.1.3.2. US

            2.1.3.3. India

            2.1.3.4. Euro Zone

            2.1.3.5. Asia Pacific 

            2.1.3.6. Rest of the World

    2.2. Key Factors Impacting the Market

   Note: Market Assessment shall be Provided for Likely Scenario

3. Market Dynamics

    3.1. Drivers

        3.1.1. Supply Side Drivers

        3.1.2. Demand Side drivers

        3.1.3. Economic Side Drivers

    3.2. Restraints

    3.3. Opportunity

    3.4. Market trends By Region

    3.5. Product Launches

    3.6. Product Claims & Nutritional Information Scan by Buyers

    3.7. Macro-Economic Factors

    3.8. Forecast Factors - Relevance & Impact

    3.9. Consumers Survey Analysis

4. Key Regulations

    4.1. Packaging & Labelling Regulations

    4.2. Certifications and Certifying Agency Overview

    4.3. Import/Export Policies

5. Global Market Demand Analysis 2017-2021 and Forecast, 2022-2032

    5.1. Historical Market Volume (Metric Tons) Analysis, 2017-2021

    5.2. Current and Future Market Volume (Metric Tons) Projections, 2022-2032

    5.3. Y-o-Y Growth Trend Analysis

6. Global Market - Pricing Analysis

    6.1. Regional Pricing Analysis (USD/Metric Tons) By Nature (2017,2022,2032)

        6.1.1. Organic

        6.1.2. Conventional

    6.2. Pricing Break-up (2017,2022,2032)

        6.2.1. Producer Level Pricing

        6.2.2. Distributor Level Pricing

        6.2.3. Retailer Level Pricing

    6.3. Global Average Pricing Analysis Benchmark

7. Global Market Demand (Size in USD Mn) Analysis 2017-2021 and Forecast, 2022-2032

    7.1. Historical Market Value (USD Mn) Analysis, 2017-2021

    7.2. Current and Future Market Value (USD Mn) Projections, 2022-2032

        7.2.1. Y-o-Y Growth Trend Analysis

        7.2.2. Absolute $ Opportunity Analysis

8. Global Market Analysis 2017-2021 and Forecast 2022-2032, By Nature 

    8.1. Introduction / Key Findings

    8.2. Historical Market Size (USD Mn) and Volume Analysis By Nature, 2017-2021

    8.3. Current and Future Market Size (USD Mn) and Volume Analysis and Forecast By Nature, 2022-2032

        8.3.1. Organic

        8.3.2. Conventional

    8.4. Market Attractiveness Analysis By Nature 

9. Global Market Analysis 2017-2021 and Forecast 2022-2032, By Form 

    9.1. Introduction / Key Findings

    9.2. Historical Market Size (USD Mn) and Volume Analysis By Form, 2017-2021

    9.3. Current and Future Market Size (USD Mn) and Volume Analysis and Forecast By Form, 2022-2032

        9.3.1. Powder

        9.3.2. Liquid

        9.3.3. Wax

    9.4. Market Attractiveness Analysis By Form 

10. Global Market Analysis 2017-2021 and Forecast 2022-2032, By Source 

    10.1. Introduction / Key Findings

    10.2. Historical Market Size (USD Mn) and Volume Analysis By Source, 2017-2021

    10.3. Current and Future Market Size (USD Mn) and Volume Analysis and Forecast By Source, 2022-2032

        10.3.1. Soybean

        10.3.2. Peanut

        10.3.3. Chickpea

        10.3.4. Clover

        10.3.5. Others

    10.4. Market Attractiveness Analysis By Source 

11. Global Market Analysis 2017-2021 and Forecast 2022-2032, By Application 

    11.1. Introduction / Key Findings

    11.2. Historical Market Size (USD Mn) and Volume Analysis By Application, 2017-2021

    11.3. Current and Future Market Size (USD Mn) and Volume Analysis and Forecast By Application, 2022-2032

        11.3.1. Food & Beverages

        11.3.2. Nutraceuticals & Dietary Supplements

        11.3.3. Pharmaceuticals

        11.3.4. Cosmetics & Personal Care

        11.3.5. Others

    11.4. Market Attractiveness Analysis By Application

12. Global Market Analysis 2017-2021 and Forecast 2022-2032, By Region

    12.1. Introduction

    12.2. Historical Market Size (USD Mn) and Volume Analysis By Region, 2017-2021

    12.3. Current Market Size (USD Mn) and Volume Analysis and Forecast By Region, 2022-2032

        12.3.1. North America

        12.3.2. Latin America

        12.3.3. Europe

        12.3.4. East Asia

        12.3.5. South Asia

        12.3.6. Oceania

        12.3.7. Middle East and Africa (MEA)

    12.4. Market Attractiveness Analysis By Region

13. North America Market Analysis 2017-2021 and Forecast 2022-2032

    13.1. Introduction

    13.2. Pricing Analysis

    13.3. Historical Market Size (USD Mn) and Volume Trend Analysis By Market Taxonomy, 2017-2021

    13.4. Market Size (USD Mn) and Volume Forecast By Market Taxonomy, 2022-2032

        13.4.1.  By Country

            13.4.1.1. U.S.

            13.4.1.2. Canada

        13.4.2. By Nature

        13.4.3. By form

        13.4.4. By Source

        13.4.5. By Application

    13.5. Market Attractiveness Analysis

        13.5.1. By Nature

        13.5.2. By form

        13.5.3. By Source

        13.5.4. By Application

    13.6. Market Trends

    13.7. Key Market Participants - Intensity Mapping

    13.8. Drivers and Restraints - Impact Analysis

14. Latin America Market Analysis 2017-2021 and Forecast 2022-2032

    14.1. Introduction

    14.2. Pricing Analysis

    14.3. Historical Market Size (USD Mn) and Volume Trend Analysis By Market Taxonomy, 2017-2021

    14.4. Market Size (USD Mn) and Volume Forecast By Market Taxonomy, 2022-2032

        14.4.1.  By Country

            14.4.1.1. Brazil

            14.4.1.2. Mexico

            14.4.1.3. Argentina

            14.4.1.4. Peru

            14.4.1.5. Chile

            14.4.1.6. Rest of Latin America

        14.4.2. By Nature

        14.4.3. By form

        14.4.4. By Source

        14.4.5. By Application

    14.5. Market Attractiveness Analysis

        14.5.1. By Nature

        14.5.2. By form

        14.5.3. By Source

        14.5.4. By Application

    14.6. Market Trends

    14.7. Key Market Participants - Intensity Mapping

    14.8. Drivers and Restraints - Impact Analysis

15. Europe Market Analysis 2017-2021 and Forecast 2022-2032

    15.1. Introduction

    15.2. Pricing Analysis

    15.3. Historical Market Size (USD Mn) and Volume Trend Analysis By Market Taxonomy, 2017-2021

    15.4. Market Size (USD Mn) and Volume Forecast By Market Taxonomy, 2022-2032

        15.4.1.  By Country

            15.4.1.1. Germany

            15.4.1.2. France

            15.4.1.3. Italy

            15.4.1.4. Spain

            15.4.1.5. UK

            15.4.1.6. Netherlands

            15.4.1.7. Nordic

            15.4.1.8. Russia

            15.4.1.9. Belgium

            15.4.1.10. Rest of Europe

        15.4.2. By Nature

        15.4.3. By form

        15.4.4. By Source

        15.4.5. By Application

    15.5. Market Attractiveness Analysis

        15.5.1. By Nature

        15.5.2. By form

        15.5.3. By Source

        15.5.4. By Application

    15.6. Market Trends

    15.7. Key Market Participants - Intensity Mapping

    15.8. Drivers and Restraints - Impact Analysis

16. East Asia Market Analysis 2017-2021 and Forecast 2022-2032

    16.1. Introduction

    16.2. Pricing Analysis

    16.3. Historical Market Size (USD Mn) and Volume Trend Analysis By Market Taxonomy, 2017-2021

    16.4. Market Size (USD Mn) and Volume Forecast By Market Taxonomy, 2022-2032

        16.4.1.  By Country

            16.4.1.1. China

            16.4.1.2. Japan

            16.4.1.3. South Korea

        16.4.2. By Nature

        16.4.3. By form

        16.4.4. By Source

        16.4.5. By Application

    16.5. Market Attractiveness Analysis

        16.5.1. By Nature

        16.5.2. By form

        16.5.3. By Source

        16.5.4. By Application

    16.6. Market Trends

    16.7. Key Market Participants - Intensity Mapping

    16.8. Drivers and Restraints - Impact Analysis

17. South Asia Market Analysis 2017-2021 and Forecast 2022-2032

    17.1. Introduction

    17.2. Pricing Analysis

    17.3. Historical Market Size (USD Mn) and Volume Trend Analysis By Market Taxonomy, 2017-2021

    17.4. Market Size (USD Mn) and Volume Forecast By Market Taxonomy, 2022-2032

        17.4.1.  By Country

            17.4.1.1. India

            17.4.1.2. Thailand

            17.4.1.3. Malaysia

            17.4.1.4. Indonesia

            17.4.1.5. Singapore

            17.4.1.6. Rest of South Asia

        17.4.2. By Nature

        17.4.3. By form

        17.4.4. By Source

        17.4.5. By Application

    17.5. Market Attractiveness Analysis

        17.5.1. By Nature

        17.5.2. By form

        17.5.3. By Source

        17.5.4. By Application

    17.6. Market Trends

    17.7. Key Market Participants - Intensity Mapping

    17.8. Drivers and Restraints - Impact Analysis

18. Oceania Market Analysis 2017-2021 and Forecast 2022-2032

    18.1. Introduction

    18.2. Pricing Analysis

    18.3. Historical Market Size (USD Mn) and Volume Trend Analysis By Market Taxonomy, 2017-2021

    18.4. Market Size (USD Mn) and Volume Forecast By Market Taxonomy, 2022-2032

        18.4.1.  By Country

            18.4.1.1. Australia

            18.4.1.2. New Zealand

        18.4.2. By Nature

        18.4.3. By form

        18.4.4. By Source

        18.4.5. By Application

    18.5. Market Attractiveness Analysis

        18.5.1. By Nature

        18.5.2. By form

        18.5.3. By Source

        18.5.4. By Application

    18.6. Market Trends

    18.7. Key Market Participants - Intensity Mapping

    18.8. Drivers and Restraints - Impact Analysis

19. Middle East and Africa Market Analysis 2017-2021 and Forecast 2022-2032

    19.1. Introduction

    19.2. Pricing Analysis

    19.3. Historical Market Size (USD Mn) and Volume Trend Analysis By Market Taxonomy, 2017-2021

    19.4. Market Size (USD Mn) and Volume Forecast By Market Taxonomy, 2022-2032

        19.4.1.  By Country

            19.4.1.1. GCC Countries

            19.4.1.2. South Africa

            19.4.1.3. North Africa

            19.4.1.4. Central Africa

            19.4.1.5. Rest of MEA

        19.4.2. By Nature

        19.4.3. By form

        19.4.4. By Source

        19.4.5. By Application

    19.5. Market Attractiveness Analysis

        19.5.1. By Nature

        19.5.2. By form

        19.5.3. By Source

        19.5.4. By Application

    19.6. Market Trends

    19.7. Key Market Participants - Intensity Mapping

    19.8. Drivers and Restraints - Impact Analysis

20. Key Countries Market Analysis 2017-2021 and Forecast 2022-2032

    20.1. U.S.

        20.1.1. Pricing Analysis (2017, 2022, 2032)

        20.1.2. Market Value and Volume Analysis 2017-2021 and Forecast 2022-2032

            20.1.2.1. By Nature

            20.1.2.2. By form

            20.1.2.3. By Source

            20.1.2.4. By Application

    20.2. Canada

        20.2.1. Pricing Analysis (2017, 2022, 2032)

        20.2.2. Market Value and Volume Analysis 2017-2021 and Forecast 2022-2032

            20.2.2.1. By Nature

            20.2.2.2. By form

            20.2.2.3. By Source

            20.2.2.4. By Application

    20.3. Brazil

        20.3.1. Pricing Analysis (2017, 2022, 2032)

        20.3.2. Market Value and Volume Analysis 2017-2021 and Forecast 2022-2032

            20.3.2.1. By Nature

            20.3.2.2. By form

            20.3.2.3. By Source

            20.3.2.4. By Application

    20.4. Mexico

        20.4.1. Pricing Analysis (2017, 2022, 2032)

        20.4.2. Market Value and Volume Analysis 2017-2021 and Forecast 2022-2032

            20.4.2.1. By Nature

            20.4.2.2. By form

            20.4.2.3. By Source

            20.4.2.4. By Application

    20.5. Argentina

        20.5.1. Pricing Analysis (2017, 2022, 2032)

        20.5.2. Market Value and Volume Analysis 2017-2021 and Forecast 2022-2032

            20.5.2.1. By Nature

            20.5.2.2. By form

            20.5.2.3. By Source

            20.5.2.4. By Application

    20.6. Peru

        20.6.1. Pricing Analysis (2017, 2022, 2032)

        20.6.2. Market Value and Volume Analysis 2017-2021 and Forecast 2022-2032

            20.6.2.1. By Nature

            20.6.2.2. By form

            20.6.2.3. By Source

            20.6.2.4. By Application

    20.7. Chile

        20.7.1. Pricing Analysis (2017, 2022, 2032)

        20.7.2. Market Value and Volume Analysis 2017-2021 and Forecast 2022-2032

            20.7.2.1. By Nature

            20.7.2.2. By form

            20.7.2.3. By Source

            20.7.2.4. By Application

    20.8. Germany

        20.8.1. Pricing Analysis (2017, 2022, 2032)

        20.8.2. Market Value and Volume Analysis 2017-2021 and Forecast 2022-2032

            20.8.2.1. By Nature

            20.8.2.2. By form

            20.8.2.3. By Source

            20.8.2.4. By Application

    20.9. Italy

        20.9.1. Pricing Analysis (2017, 2022, 2032)

        20.9.2. Market Value and Volume Analysis 2017-2021 and Forecast 2022-2032

            20.9.2.1. By Nature

            20.9.2.2. By form

            20.9.2.3. By Source

            20.9.2.4. By Application

    20.10. France

        20.10.1. Pricing Analysis (2017, 2022, 2032)

        20.10.2. Market Value and Volume Analysis 2017-2021 and Forecast 2022-2032

            20.10.2.1. By Nature

            20.10.2.2. By form

            20.10.2.3. By Source

            20.10.2.4. By Application

    20.11. U.K.

        20.11.1. Pricing Analysis (2017, 2022, 2032)

        20.11.2. Market Value and Volume Analysis 2017-2021 and Forecast 2022-2032

            20.11.2.1. By Nature

            20.11.2.2. By form

            20.11.2.3. By Source

            20.11.2.4. By Application

    20.12. Spain

        20.12.1. Pricing Analysis (2017, 2022, 2032)

        20.12.2. Market Value and Volume Analysis 2017-2021 and Forecast 2022-2032

            20.12.2.1. By Nature

            20.12.2.2. By form

            20.12.2.3. By Source

            20.12.2.4. By Application

    20.13. Netherlands

        20.13.1. Pricing Analysis (2017, 2022, 2032)

        20.13.2. Market Value and Volume Analysis 2017-2021 and Forecast 2022-2032

            20.13.2.1. By Nature

            20.13.2.2. By form

            20.13.2.3. By Source

            20.13.2.4. By Application

    20.14. Russia

        20.14.1. Pricing Analysis (2017, 2022, 2032)

        20.14.2. Market Value and Volume Analysis 2017-2021 and Forecast 2022-2032

            20.14.2.1. By Nature

            20.14.2.2. By form

            20.14.2.3. By Source

            20.14.2.4. By Application

    20.15. Nordic

        20.15.1. Pricing Analysis (2017, 2022, 2032)

        20.15.2. Market Value and Volume Analysis 2017-2021 and Forecast 2022-2032

            20.15.2.1. By Nature

            20.15.2.2. By form

            20.15.2.3. By Source

            20.15.2.4. By Application

    20.16. Belgium

        20.16.1. Pricing Analysis (2017, 2022, 2032)

        20.16.2. Market Value and Volume Analysis 2017-2021 and Forecast 2022-2032

            20.16.2.1. By Nature

            20.16.2.2. By form

            20.16.2.3. By Source

            20.16.2.4. By Application

    20.17. China

        20.17.1. Pricing Analysis (2017, 2022, 2032)

        20.17.2. Market Value and Volume Analysis 2017-2021 and Forecast 2022-2032

            20.17.2.1. By Nature

            20.17.2.2. By form

            20.17.2.3. By Source

            20.17.2.4. By Application

    20.18. Japan

        20.18.1. Pricing Analysis (2017, 2022, 2032)

        20.18.2. Market Value and Volume Analysis 2017-2021 and Forecast 2022-2032

            20.18.2.1. By Nature

            20.18.2.2. By form

            20.18.2.3. By Source

            20.18.2.4. By Application

    20.19. South Korea

        20.19.1. Pricing Analysis (2017, 2022, 2032)

        20.19.2. Market Value and Volume Analysis 2017-2021 and Forecast 2022-2032

            20.19.2.1. By Nature

            20.19.2.2. By form

            20.19.2.3. By Source

            20.19.2.4. By Application

    20.20. India

        20.20.1. Pricing Analysis (2017, 2022, 2032)

        20.20.2. Market Value and Volume Analysis 2017-2021 and Forecast 2022-2032

            20.20.2.1. By Nature

            20.20.2.2. By form

            20.20.2.3. By Source

            20.20.2.4. By Application

    20.21. Thailand

        20.21.1. Pricing Analysis (2017, 2022, 2032)

        20.21.2. Market Value and Volume Analysis 2017-2021 and Forecast 2022-2032

            20.21.2.1. By Nature

            20.21.2.2. By form

            20.21.2.3. By Source

            20.21.2.4. By Application

    20.22. Malaysia

        20.22.1. Pricing Analysis (2017, 2022, 2032)

        20.22.2. Market Value and Volume Analysis 2017-2021 and Forecast 2022-2032

            20.22.2.1. By Nature

            20.22.2.2. By form

            20.22.2.3. By Source

            20.22.2.4. By Application

    20.23. Indonesia

        20.23.1. Pricing Analysis (2017, 2022, 2032)

        20.23.2. Market Value and Volume Analysis 2017-2021 and Forecast 2022-2032

            20.23.2.1. By Nature

            20.23.2.2. By form

            20.23.2.3. By Source

            20.23.2.4. By Application

    20.24. Singapore

        20.24.1. Pricing Analysis (2017, 2022, 2032)

        20.24.2. Market Value and Volume Analysis 2017-2021 and Forecast 2022-2032

            20.24.2.1. By Nature

            20.24.2.2. By form

            20.24.2.3. By Source

            20.24.2.4. By Application

    20.25. Australia

        20.25.1. Pricing Analysis (2017, 2022, 2032)

        20.25.2. Market Value and Volume Analysis 2017-2021 and Forecast 2022-2032

            20.25.2.1. By Nature

            20.25.2.2. By form

            20.25.2.3. By Source

            20.25.2.4. By Application

    20.26. New Zealand

        20.26.1. Pricing Analysis (2017, 2022, 2032)

        20.26.2. Market Value and Volume Analysis 2017-2021 and Forecast 2022-2032

            20.26.2.1. By Nature

            20.26.2.2. By form

            20.26.2.3. By Source

            20.26.2.4. By Application

    20.27. GCC Countries

        20.27.1. Pricing Analysis (2017, 2022, 2032)

        20.27.2. Market Value and Volume Analysis 2017-2021 and Forecast 2022-2032

            20.27.2.1. By Nature

            20.27.2.2. By form

            20.27.2.3. By Source

            20.27.2.4. By Application

    20.28. North Africa

        20.28.1. Pricing Analysis (2017, 2022, 2032)

        20.28.2. Market Value and Volume Analysis 2017-2021 and Forecast 2022-2032

            20.28.2.1. By Nature

            20.28.2.2. By form

            20.28.2.3. By Source

            20.28.2.4. By Application

    20.29. Central Africa

        20.29.1. Pricing Analysis (2017, 2022, 2032)

        20.29.2. Market Value and Volume Analysis 2017-2021 and Forecast 2022-2032

            20.29.2.1. By Nature

            20.29.2.2. By form

            20.29.2.3. By Source

            20.29.2.4. By Application

    20.30. South Africa

        20.30.1. Pricing Analysis (2017, 2022, 2032)

        20.30.2. Market Value and Volume Analysis 2017-2021 and Forecast 2022-2032

            20.30.2.1. By Nature

            20.30.2.2. By form

            20.30.2.3. By Source

            20.30.2.4. By Application

21. Market Structure Analysis

    21.1. Market Analysis by Tier of Companies 

    21.2. Company Share Analysis of Top Players

        21.2.1. By Nature

        21.2.2. By Region

    21.3. Market Presence Analysis

        21.3.1. By Regional Footprint of Players

        21.3.2. Product Footprint by Players

        21.3.3. Channel Footprint by Players

22. Competition Analysis

    22.1. Competition Dashboard

    22.2. Competition Deep Dive (Tentative List)

        22.2.1. Cargill, Inc.

            22.2.1.1. Overview

            22.2.1.2. Product Portfolio

            22.2.1.3. Profitability by Market Segments (Product/Channel/Region)

            22.2.1.4. Sales Footprint

            22.2.1.5. Strategy Overview

                22.2.1.5.1. Marketing Strategy

                22.2.1.5.2. Product Strategy

        22.2.2. Archer-Daniels-Midland Co.

            22.2.2.1. Overview

            22.2.2.2. Product Portfolio

            22.2.2.3. Profitability by Market Segments (Product/Channel/Region)

            22.2.2.4. Sales Footprint

            22.2.2.5. Strategy Overview

                22.2.2.5.1. Marketing Strategy

                22.2.2.5.2. Product Strategy

        22.2.3. BASF SE

            22.2.3.1. Overview

            22.2.3.2. Product Portfolio

            22.2.3.3. Profitability by Market Segments (Product/Channel/Region)

            22.2.3.4. Sales Footprint

            22.2.3.5. Strategy Overview

                22.2.3.5.1. Marketing Strategy

                22.2.3.5.2. Product Strategy

        22.2.4. International Flavors and Fragrances

            22.2.4.1. Overview

            22.2.4.2. Product Portfolio

            22.2.4.3. Profitability by Market Segments (Product/Channel/Region)

            22.2.4.4. Sales Footprint

            22.2.4.5. Strategy Overview

                22.2.4.5.1. Marketing Strategy

                22.2.4.5.2. Product Strategy

        22.2.5. NutraScience Labs

            22.2.5.1. Overview

            22.2.5.2. Product Portfolio

            22.2.5.3. Profitability by Market Segments (Product/Channel/Region)

            22.2.5.4. Sales Footprint

            22.2.5.5. Strategy Overview

                22.2.5.5.1. Marketing Strategy

                22.2.5.5.2. Product Strategy

        22.2.6. Otsuka Pharmaceutical Co., Ltd.

            22.2.6.1. Overview

            22.2.6.2. Product Portfolio

            22.2.6.3. Profitability by Market Segments (Product/Channel/Region)

            22.2.6.4. Sales Footprint

            22.2.6.5. Strategy Overview

                22.2.6.5.1. Marketing Strategy

                22.2.6.5.2. Product Strategy

        22.2.7. Frutarom Industries Ltd.

            22.2.7.1. Overview

            22.2.7.2. Product Portfolio

            22.2.7.3. Profitability by Market Segments (Product/Channel/Region)

            22.2.7.4. Sales Footprint

            22.2.7.5. Strategy Overview

                22.2.7.5.1. Marketing Strategy

                22.2.7.5.2. Product Strategy

        22.2.8. Fujicco Co., Ltd.

            22.2.8.1. Overview

            22.2.8.2. Product Portfolio

            22.2.8.3. Profitability by Market Segments (Product/Channel/Region)

            22.2.8.4. Sales Footprint

            22.2.8.5. Strategy Overview

                22.2.8.5.1. Marketing Strategy

                22.2.8.5.2. Product Strategy

        22.2.9. Parchem Fine & Specialty Chemicals

            22.2.9.1. Overview

            22.2.9.2. Product Portfolio

            22.2.9.3. Profitability by Market Segments (Product/Channel/Region)

            22.2.9.4. Sales Footprint

            22.2.9.5. Strategy Overview

                22.2.9.5.1. Marketing Strategy

                22.2.9.5.2. Product Strategy

        22.2.10. FUJIFILM Wako Pure Chemical Corporation

            22.2.10.1. Overview

            22.2.10.2. Product Portfolio

            22.2.10.3. Profitability by Market Segments (Product/Channel/Region)

            22.2.10.4. Sales Footprint

            22.2.10.5. Strategy Overview

                22.2.10.5.1. Marketing Strategy

                22.2.10.5.2. Product Strategy

        22.2.11. Other Players (On Additional Requests) 

            22.2.11.1. Overview

            22.2.11.2. Product Portfolio

            22.2.11.3. Profitability by Market Segments (Product/Channel/Region)

            22.2.11.4. Sales Footprint

            22.2.11.5. Strategy Overview

                22.2.11.5.1. Marketing Strategy

                22.2.11.5.2. Product Strategy

23. Value Chain Analysis

    23.1. Operating margins at each node of supply chain

    23.2. List of Active Market Participants

        23.2.1. Product Manufacturers

        23.2.2. Key Brands

24. Assumptions and Acronyms Used

25. Research Methodology

List of Tables

Table 1: Global Market Value (US$ Mn) and Forecast by Region, 2017–2021

Table 2: Global Market Value (US$ Mn) and Forecast by Region, 2022–2032

Table 3: Global Market Volume (Metric Tons) and Forecast by Region, 2017–2021

Table 4: Global Market Volume (Metric Tons) and Forecast by Region, 2022–2032

Table 5: Global Market Value (US$ Mn) and Forecast by Nature, 2017–2021

Table 6: Global Market Value (US$ Mn) and Forecast by Nature, 2022–2032

Table 7: Global Market Volume (Metric Tons) and Forecast by Nature, 2017–2021

Table 8: Global Market Volume (Metric Tons) and Forecast by Nature, 2022–2032

Table 9: Global Market Value (US$ Mn) and Forecast by Form, 2017–2021

Table 10: Global Market Value (US$ Mn) and Forecast by Form, 2022–2032

Table 11: Global Market Volume (Metric Tons) and Forecast by Form, 2017–2021

Table 12: Global Market Volume (Metric Tons) and Forecast by Form, 2022–2032

Table 13: Global Market Value (US$ Mn) and Forecast by Source, 2017–2021

Table 14: Global Market Value (US$ Mn) and Forecast by Source, 2022–2032

Table 15: Global Market Volume (Metric Tons) and Forecast by Source, 2017–2021

Table 16: Global Market Volume (Metric Tons) and Forecast by Source, 2022–2032

Table 17: Global Market Value (US$ Mn) and Forecast by Application, 2017–2021

Table 18: Global Market Value (US$ Mn) and Forecast by Application, 2022–2032

Table 19: Global Market Volume (Metric Tons) and Forecast by Application, 2017–2021

Table 20: Global Market Volume (Metric Tons) and Forecast by Application, 2022–2032

Table 21: North America Market Value (US$ Mn) and Forecast by Country, 2017–2021

Table 22: North America Market Value (US$ Mn) and Forecast by Country, 2022–2032

Table 23: North America Market Volume (Metric Tons) and Forecast by Country, 2017–2021

Table 24: North America Market Volume (Metric Tons) and Forecast by Country, 2022–2032

Table 25: North America Market Value (US$ Mn) and Forecast by Nature, 2017–2021

Table 26: North America Market Value (US$ Mn) and Forecast by Nature, 2022–2032

Table 27: North America Market Volume (Metric Tons) and Forecast by Nature, 2017–2021

Table 28: North America Market Volume (Metric Tons) and Forecast by Nature, 2022–2032

Table 29: North America Market Value (US$ Mn) and Forecast by Form, 2017–2021

Table 30: North America Market Value (US$ Mn) and Forecast by Form, 2022–2032

Table 31: North America Market Volume (Metric Tons) and Forecast by Form, 2017–2021

Table 32: North America Market Volume (Metric Tons) and Forecast by Form, 2022–2032

Table 33: North America Market Value (US$ Mn) and Forecast by Source, 2017–2021

Table 34: North America Market Value (US$ Mn) and Forecast by Source, 2022–2032

Table 35: North America Market Volume (Metric Tons) and Forecast by Source, 2017–2021

Table 36: North America Market Volume (Metric Tons) and Forecast by Source, 2022–2032

Table 37: North America Market Value (US$ Mn) and Forecast by Application, 2017–2021

Table 38: North America Market Value (US$ Mn) and Forecast by Application, 2022–2032

Table 39: North America Market Volume (Metric Tons) and Forecast by Application, 2017–2021

Table 40: North America Market Volume (Metric Tons) and Forecast by Application, 2022–2032

Table 41: Latin America Market Value (US$ Mn) and Forecast by Country, 2017–2021

Table 42: Latin America Market Value (US$ Mn) and Forecast by Country, 2022–2032

Table 43: Latin America Market Volume (Metric Tons) and Forecast by Country, 2017–2021

Table 44: Latin America Market Volume (Metric Tons) and Forecast by Country, 2022–2032

Table 45: Latin America Market Value (US$ Mn) and Forecast by Nature, 2017–2021

Table 46: Latin America Market Value (US$ Mn) and Forecast by Nature, 2022–2032

Table 47: Latin America Market Volume (Metric Tons) and Forecast by Nature, 2017–2021

Table 48: Latin America Market Volume (Metric Tons) and Forecast by Nature, 2022–2032

Table 49: Latin America Market Value (US$ Mn) and Forecast by Form, 2017–2021

Table 50: Latin America Market Value (US$ Mn) and Forecast by Form, 2022–2032

Table 51: Latin America Market Volume (Metric Tons) and Forecast by Form, 2017–2021

Table 52: Latin America Market Volume (Metric Tons) and Forecast by Form, 2022–2032

Table 53: Latin America Market Value (US$ Mn) and Forecast by Source, 2017–2021

Table 54: Latin America Market Value (US$ Mn) and Forecast by Source, 2022–2032

Table 55: Latin America Market Volume (Metric Tons) and Forecast by Source, 2017–2021

Table 56: Latin America Market Volume (Metric Tons) and Forecast by Source, 2022–2032

Table 57: Latin America Market Value (US$ Mn) and Forecast by Application, 2017–2021

Table 58: Latin America Market Value (US$ Mn) and Forecast by Application, 2022–2032

Table 59: Latin America Market Volume (Metric Tons) and Forecast by Application, 2017–2021

Table 60: Latin America Market Volume (Metric Tons) and Forecast by Application, 2022–2032

Table 61: Europe Market Value (US$ Mn) and Forecast by Country, 2017–2021

Table 62: Europe Market Value (US$ Mn) and Forecast by Country, 2022–2032

Table 63: Europe Market Volume (Metric Tons) and Forecast by Country, 2017–2021

Table 64: Europe Market Volume (Metric Tons) and Forecast by Country, 2022–2032

Table 65: Europe Market Value (US$ Mn) and Forecast by Nature, 2017–2021

Table 66: Europe Market Value (US$ Mn) and Forecast by Nature, 2022–2032

Table 67: Europe Market Volume (Metric Tons) and Forecast by Nature, 2017–2021

Table 68: Europe Market Volume (Metric Tons) and Forecast by Nature, 2022–2032

Table 69: Europe Market Value (US$ Mn) and Forecast by Form, 2017–2021

Table 70: Europe Market Value (US$ Mn) and Forecast by Form, 2022–2032

Table 71: Europe Market Volume (Metric Tons) and Forecast by Form, 2017–2021

Table 72: Europe Market Volume (Metric Tons) and Forecast by Form, 2022–2032

Table 73: Europe Market Value (US$ Mn) and Forecast by Source, 2017–2021

Table 74: Europe Market Value (US$ Mn) and Forecast by Source, 2022–2032

Table 75: Europe Market Volume (Metric Tons) and Forecast by Source, 2017–2021

Table 76: Europe Market Volume (Metric Tons) and Forecast by Source, 2022–2032

Table 77: Europe Market Value (US$ Mn) and Forecast by Application, 2017–2021

Table 78: Europe Market Value (US$ Mn) and Forecast by Application, 2022–2032

Table 79: Europe Market Volume (Metric Tons) and Forecast by Application, 2017–2021

Table 80: Europe Market Volume (Metric Tons) and Forecast by Application, 2022–2032

Table 81: East Asia Market Value (US$ Mn) and Forecast by Country, 2017–2021

Table 82: East Asia Market Value (US$ Mn) and Forecast by Country, 2022–2032

Table 83: East Asia Market Volume (Metric Tons) and Forecast by Country, 2017–2021

Table 84: East Asia Market Volume (Metric Tons) and Forecast by Country, 2022–2032

Table 85: East Asia Market Value (US$ Mn) and Forecast by Nature, 2017–2021

Table 86: East Asia Market Value (US$ Mn) and Forecast by Nature, 2022–2032

Table 87: East Asia Market Volume (Metric Tons) and Forecast by Nature, 2017–2021

Table 88: East Asia Market Volume (Metric Tons) and Forecast by Nature, 2022–2032

Table 89: East Asia Market Value (US$ Mn) and Forecast by Form, 2017–2021

Table 90: East Asia Market Value (US$ Mn) and Forecast by Form, 2022–2032

Table 91: East Asia Market Volume (Metric Tons) and Forecast by Form, 2017–2021

Table 92: East Asia Market Volume (Metric Tons) and Forecast by Form, 2022–2032

Table 93: East Asia Market Value (US$ Mn) and Forecast by Source, 2017–2021

Table 94: East Asia Market Value (US$ Mn) and Forecast by Source, 2022–2032

Table 95: East Asia Market Volume (Metric Tons) and Forecast by Source, 2017–2021

Table 96: East Asia Market Volume (Metric Tons) and Forecast by Source, 2022–2032

Table 97: East Asia Market Value (US$ Mn) and Forecast by Application, 2017–2021

Table 98: East Asia Market Value (US$ Mn) and Forecast by Application, 2022–2032

Table 99: East Asia Market Volume (Metric Tons) and Forecast by Application, 2017–2021

Table 100: East Asia Market Volume (Metric Tons) and Forecast by Application, 2022–2032

Table 101: South Asia Market Value (US$ Mn) and Forecast by Country, 2017–2021

Table 102: South Asia Market Value (US$ Mn) and Forecast by Country, 2022–2032

Table 103: South Asia Market Volume (Metric Tons) and Forecast by Country, 2017–2021

Table 104: South Asia Market Volume (Metric Tons) and Forecast by Country, 2022–2032

Table 105: South Asia Market Value (US$ Mn) and Forecast by Nature, 2017–2021

Table 106: South Asia Market Value (US$ Mn) and Forecast by Nature, 2022–2032

Table 107: South Asia Market Volume (Metric Tons) and Forecast by Nature, 2017–2021

Table 108: South Asia Market Volume (Metric Tons) and Forecast by Nature, 2022–2032

Table 109: South Asia Market Value (US$ Mn) and Forecast by Form, 2017–2021

Table 110: South Asia Market Value (US$ Mn) and Forecast by Form, 2022–2032

Table 111: South Asia Market Volume (Metric Tons) and Forecast by Form, 2017–2021

Table 112: South Asia Market Volume (Metric Tons) and Forecast by Form, 2022–2032

Table 113: South Asia Market Value (US$ Mn) and Forecast by Source, 2017–2021

Table 114: South Asia Market Value (US$ Mn) and Forecast by Source, 2022–2032

Table 115: South Asia Market Volume (Metric Tons) and Forecast by Source, 2017–2021

Table 116: South Asia Market Volume (Metric Tons) and Forecast by Source, 2022–2032

Table 117: South Asia Market Value (US$ Mn) and Forecast by Application, 2017–2021

Table 118: South Asia Market Value (US$ Mn) and Forecast by Application, 2022–2032

Table 119: South Asia Market Volume (Metric Tons) and Forecast by Application, 2017–2021

Table 120: South Asia Market Volume (Metric Tons) and Forecast by Application, 2022–2032

Table 121: Oceania Market Value (US$ Mn) and Forecast by Country, 2017–2021

Table 122: Oceania Market Value (US$ Mn) and Forecast by Country, 2022–2032

Table 123: Oceania Market Volume (Metric Tons) and Forecast by Country, 2017–2021

Table 124: Oceania Market Volume (Metric Tons) and Forecast by Country, 2022–2032

Table 125: Oceania Market Value (US$ Mn) and Forecast by Nature, 2017–2021

Table 126: Oceania Market Value (US$ Mn) and Forecast by Nature, 2022–2032

Table 127: Oceania Market Volume (Metric Tons) and Forecast by Nature, 2017–2021

Table 128: Oceania Market Volume (Metric Tons) and Forecast by Nature, 2022–2032

Table 129: Oceania Market Value (US$ Mn) and Forecast by Form, 2017–2021

Table 130: Oceania Market Value (US$ Mn) and Forecast by Form, 2022–2032

Table 131: Oceania Market Volume (Metric Tons) and Forecast by Form, 2017–2021

Table 132: Oceania Market Volume (Metric Tons) and Forecast by Form, 2022–2032

Table 133: Oceania Market Value (US$ Mn) and Forecast by Source, 2017–2021

Table 134: Oceania Market Value (US$ Mn) and Forecast by Source, 2022–2032

Table 135: Oceania Market Volume (Metric Tons) and Forecast by Source, 2017–2021

Table 136: Oceania Market Volume (Metric Tons) and Forecast by Source, 2022–2032

Table 137: Oceania Market Value (US$ Mn) and Forecast by Application, 2017–2021

Table 138: Oceania Market Value (US$ Mn) and Forecast by Application, 2022–2032

Table 139: Oceania Market Volume (Metric Tons) and Forecast by Application, 2017–2021

Table 140: Oceania Market Volume (Metric Tons) and Forecast by Application, 2022–2032

Table 141: MEA Market Value (US$ Mn) and Forecast by Country, 2017–2021

Table 142: MEA Market Value (US$ Mn) and Forecast by Country, 2022–2032

Table 143: MEA Market Volume (Metric Tons) and Forecast by Country, 2017–2021

Table 144: MEA Market Volume (Metric Tons) and Forecast by Country, 2022–2032

Table 145: MEA Market Value (US$ Mn) and Forecast by Nature, 2017–2021

Table 146: MEA Market Value (US$ Mn) and Forecast by Nature, 2022–2032

Table 147: MEA Market Volume (Metric Tons) and Forecast by Nature, 2017–2021

Table 148: MEA Market Volume (Metric Tons) and Forecast by Nature, 2022–2032

Table 149: MEA Market Value (US$ Mn) and Forecast by Form, 2017–2021

Table 150: MEA Market Value (US$ Mn) and Forecast by Form, 2022–2032

Table 151: MEA Market Volume (Metric Tons) and Forecast by Form, 2017–2021

Table 152: MEA Market Volume (Metric Tons) and Forecast by Form, 2022–2032

Table 153: MEA Market Value (US$ Mn) and Forecast by Source, 2017–2021

Table 154: MEA Market Value (US$ Mn) and Forecast by Source, 2022–2032

Table 155: MEA Market Volume (Metric Tons) and Forecast by Source, 2017–2021

Table 156: MEA Market Volume (Metric Tons) and Forecast by Source, 2022–2032

Table 157: MEA Market Value (US$ Mn) and Forecast by Application, 2017–2021

Table 158: MEA Market Value (US$ Mn) and Forecast by Application, 2022–2032

Table 159: MEA Market Volume (Metric Tons) and Forecast by Application, 2017–2021

Table 160: MEA Market Volume (Metric Tons) and Forecast by Application, 2022–2032

List of Charts

Figure 1: Global Market Value (US$ Mn) and Volume (MT) Forecast, 2022-2032

Figure 2: Global Market Absolute $ Opportunity (US$ Mn), 2022-2032

Figure 3: Global Market Value (US$ Mn) and % Growth by Region, 2022 & 2032

Figure 4: Global Market Y-o-Y Growth Rate by Region, 2022-2032

Figure 5: Global Market Value (US$ Mn) and % Growth by Nature, 2022 & 2032

Figure 6: Global Market Y-o-Y Growth Rate by Nature, 2022-2032

Figure 7: Global Market Value (US$ Mn) and % Growth by Form, 2022 & 2032

Figure 8: Global Market Y-o-Y Growth Rate by Form, 2022-2032

Figure 9: Global Market Value (US$ Mn) and % Growth by Source, 2022 & 2032

Figure 10: Global Market Y-o-Y Growth Rate by Source, 2022-2032

Figure 11: Global Market Value (US$ Mn) and % Growth by Application, 2022 & 2032

Figure 12: Global Market Y-o-Y Growth Rate by Application, 2022-2032

Figure 13: Global Market Attractiveness Analysis by Region, 2022-2032

Figure 14: Global Market Attractiveness Analysis by Nature, 2022-2032

Figure 15: Global Market Attractiveness Analysis by Form, 2022-2032

Figure 16: Global Market Attractiveness Analysis by Source, 2022-2032

Figure 17: Global Market Attractiveness Analysis by Application, 2022-2032

Figure 18: North America Market Value (US$ Mn) and Volume (MT) Forecast, 2022-2032

Figure 19: North America Market Absolute $ Opportunity (US$ Mn), 2022-2032

Figure 20: North America Market Value (US$ Mn) and % Growth by Country, 2022 & 2032

Figure 21: North America Market Y-o-Y Growth Rate by Country, 2022-2032

Figure 22: North America Market Value (US$ Mn) and % Growth by Nature, 2022 & 2032

Figure 23: North America Market Y-o-Y Growth Rate by Nature, 2022-2032

Figure 24: North America Market Value (US$ Mn) and % Growth by Form, 2022 & 2032

Figure 25: North America Market Y-o-Y Growth Rate by Form, 2022-2032

Figure 26: North America Market Value (US$ Mn) and % Growth by Source, 2022 & 2032

Figure 27: North America Market Y-o-Y Growth Rate by Source, 2022-2032

Figure 28: North America Market Value (US$ Mn) and % Growth by Application, 2022 & 2032

Figure 29: North America Market Y-o-Y Growth Rate by Application, 2022-2032

Figure 30: North America Market Attractiveness Analysis by Country, 2022-2032

Figure 31: North America Market Attractiveness Analysis by Nature, 2022-2032

Figure 32: North America Market Attractiveness Analysis by Form, 2022-2032

Figure 33: North America Market Attractiveness Analysis by Source, 2022-2032

Figure 34: North America Market Attractiveness Analysis by Application, 2022-2032

Figure 35: Latin America Market Value (US$ Mn) and Volume (MT) Forecast, 2022-2032

Figure 36: Latin America Market Absolute $ Opportunity (US$ Mn), 2022-2032

Figure 37: Latin America Market Value (US$ Mn) and % Growth by Country, 2022 & 2032

Figure 38: Latin America Market Y-o-Y Growth Rate by Country, 2022-2032

Figure 39: Latin America Market Value (US$ Mn) and % Growth by Nature, 2022 & 2032

Figure 40: Latin America Market Y-o-Y Growth Rate by Nature, 2022-2032

Figure 41: Latin America Market Value (US$ Mn) and % Growth by Form, 2022 & 2032

Figure 42: Latin America Market Y-o-Y Growth Rate by Form, 2022-2032

Figure 43: Latin America Market Value (US$ Mn) and % Growth by Source, 2022 & 2032

Figure 44: Latin America Market Y-o-Y Growth Rate by Source, 2022-2032

Figure 45: Latin America Market Value (US$ Mn) and % Growth by Application, 2022 & 2032

Figure 46: Latin America Market Y-o-Y Growth Rate by Application, 2022-2032

Figure 47: Latin America Market Attractiveness Analysis by Country, 2022-2032

Figure 48: Latin America Market Attractiveness Analysis by Nature, 2022-2032

Figure 49: Latin America Market Attractiveness Analysis by Form, 2022-2032

Figure 50: Latin America Market Attractiveness Analysis by Source, 2022-2032

Figure 51: Latin America Market Attractiveness Analysis by Application, 2022-2032

Figure 52: Europe Market Value (US$ Mn) and Volume (MT) Forecast, 2022-2032

Figure 53: Europe Market Absolute $ Opportunity (US$ Mn), 2022-2032

Figure 54: Europe Market Value (US$ Mn) and % Growth by Country, 2022 & 2032

Figure 55: Europe Market Y-o-Y Growth Rate by Country, 2022-2032

Figure 56: Europe Market Value (US$ Mn) and % Growth by Nature, 2022 & 2032

Figure 57: Europe Market Y-o-Y Growth Rate by Nature, 2022-2032

Figure 58: Europe Market Value (US$ Mn) and % Growth by Form, 2022 & 2032

Figure 59: Europe Market Y-o-Y Growth Rate by Form, 2022-2032

Figure 60: Europe Market Value (US$ Mn) and % Growth by Source, 2022 & 2032

Figure 61: Europe Market Y-o-Y Growth Rate by Source, 2022-2032

Figure 62: Europe Market Value (US$ Mn) and % Growth by Application, 2022 & 2032

Figure 63: Europe Market Y-o-Y Growth Rate by Application, 2022-2032

Figure 64: Europe Market Attractiveness Analysis by Country, 2022-2032

Figure 65: Europe Market Attractiveness Analysis by Nature, 2022-2032

Figure 66: Europe Market Attractiveness Analysis by Form, 2022-2032

Figure 67: Europe Market Attractiveness Analysis by Source, 2022-2032

Figure 68: Europe Market Attractiveness Analysis by Application, 2022-2032

Figure 69: East Asia Market Value (US$ Mn) and Volume (MT) Forecast, 2022-2032

Figure 70: East Asia Market Absolute $ Opportunity (US$ Mn), 2022-2032

Figure 71: East Asia Market Value (US$ Mn) and % Growth by Country, 2022 & 2032

Figure 72: East Asia Market Y-o-Y Growth Rate by Country, 2022-2032

Figure 73: East Asia Market Value (US$ Mn) and % Growth by Nature, 2022 & 2032

Figure 74: East Asia Market Y-o-Y Growth Rate by Nature, 2022-2032

Figure 75: East Asia Market Value (US$ Mn) and % Growth by Form, 2022 & 2032

Figure 76: East Asia Market Y-o-Y Growth Rate by Form, 2022-2032

Figure 77: East Asia Market Value (US$ Mn) and % Growth by Source, 2022 & 2032

Figure 78: East Asia Market Y-o-Y Growth Rate by Source, 2022-2032

Figure 79: East Asia Market Value (US$ Mn) and % Growth by Application, 2022 & 2032

Figure 80: East Asia Market Y-o-Y Growth Rate by Application, 2022-2032

Figure 81: East Asia Market Attractiveness Analysis by Country, 2022-2032

Figure 82: East Asia Market Attractiveness Analysis by Nature, 2022-2032

Figure 83: East Asia Market Attractiveness Analysis by Form, 2022-2032

Figure 84: East Asia Market Attractiveness Analysis by Source, 2022-2032

Figure 85: East Asia Market Attractiveness Analysis by Application, 2022-2032

Figure 86: South Asia Market Value (US$ Mn) and Volume (MT) Forecast, 2022-2032

Figure 87: South Asia Market Absolute $ Opportunity (US$ Mn), 2022-2032

Figure 88: South Asia Market Value (US$ Mn) and % Growth by Country, 2022 & 2032

Figure 89: South Asia Market Y-o-Y Growth Rate by Country, 2022-2032

Figure 90: South Asia Market Value (US$ Mn) and % Growth by Nature, 2022 & 2032

Figure 91: South Asia Market Y-o-Y Growth Rate by Nature, 2022-2032

Figure 92: South Asia Market Value (US$ Mn) and % Growth by Form, 2022 & 2032

Figure 93: South Asia Market Y-o-Y Growth Rate by Form, 2022-2032

Figure 94: South Asia Market Value (US$ Mn) and % Growth by Source, 2022 & 2032

Figure 95: South Asia Market Y-o-Y Growth Rate by Source, 2022-2032

Figure 96: South Asia Market Value (US$ Mn) and % Growth by Application, 2022 & 2032

Figure 97: South Asia Market Y-o-Y Growth Rate by Application, 2022-2032

Figure 98: South Asia Market Attractiveness Analysis by Country, 2022-2032

Figure 99: South Asia Market Attractiveness Analysis by Nature, 2022-2032

Figure 100: South Asia Market Attractiveness Analysis by Form, 2022-2032

Figure 101: South Asia Market Attractiveness Analysis by Source, 2022-2032

Figure 102: South Asia Market Attractiveness Analysis by Application, 2022-2032

Figure 103: Oceania Market Value (US$ Mn) and Volume (MT) Forecast, 2022-2032

Figure 104: Oceania Market Absolute $ Opportunity (US$ Mn), 2022-2032

Figure 105: Oceania Market Value (US$ Mn) and % Growth by Country, 2022 & 2032

Figure 106: Oceania Market Y-o-Y Growth Rate by Country, 2022-2032

Figure 107: Oceania Market Value (US$ Mn) and % Growth by Nature, 2022 & 2032

Figure 108: Oceania Market Y-o-Y Growth Rate by Nature, 2022-2032

Figure 109: Oceania Market Value (US$ Mn) and % Growth by Form, 2022 & 2032

Figure 110: Oceania Market Y-o-Y Growth Rate by Form, 2022-2032

Figure 111: Oceania Market Value (US$ Mn) and % Growth by Source, 2022 & 2032

Figure 112: Oceania Market Y-o-Y Growth Rate by Source, 2022-2032

Figure 113: Oceania Market Value (US$ Mn) and % Growth by Application, 2022 & 2032

Figure 114: Oceania Market Y-o-Y Growth Rate by Application, 2022-2032

Figure 115: Oceania Market Attractiveness Analysis by Country, 2022-2032

Figure 116: Oceania Market Attractiveness Analysis by Nature, 2022-2032

Figure 117: Oceania Market Attractiveness Analysis by Form, 2022-2032

Figure 118: Oceania Market Attractiveness Analysis by Source, 2022-2032

Figure 119: Oceania Market Attractiveness Analysis by Application, 2022-2032

Figure 120: MEA Market Value (US$ Mn) and Volume (MT) Forecast, 2022-2032

Figure 121: MEA Market Absolute $ Opportunity (US$ Mn), 2022-2032

Figure 122: MEA Market Value (US$ Mn) and % Growth by Country, 2022 & 2032

Figure 123: MEA Market Y-o-Y Growth Rate by Country, 2022-2032

Figure 124: MEA Market Value (US$ Mn) and % Growth by Nature, 2022 & 2032

Figure 125: MEA Market Y-o-Y Growth Rate by Nature, 2022-2032

Figure 126: MEA Market Value (US$ Mn) and % Growth by Form, 2022 & 2032

Figure 127: MEA Market Y-o-Y Growth Rate by Form, 2022-2032

Figure 128: MEA Market Value (US$ Mn) and % Growth by Source, 2022 & 2032

Figure 129: MEA Market Y-o-Y Growth Rate by Source, 2022-2032

Figure 130: MEA Market Value (US$ Mn) and % Growth by Application, 2022 & 2032

Figure 131: MEA Market Y-o-Y Growth Rate by Application, 2022-2032

Figure 132: MEA Market Attractiveness Analysis by Country, 2022-2032

Figure 133: MEA Market Attractiveness Analysis by Nature, 2022-2032

Figure 134: MEA Market Attractiveness Analysis by Form, 2022-2032

Figure 135: MEA Market Attractiveness Analysis by Source, 2022-2032

Figure 136: MEA Market Attractiveness Analysis by Application, 2022-2032

Recommendations

Food and Beverage

Flavonoid Market

Published : April 2024

Food and Beverage

Flavored Water Market

Published : May 2023

Food and Beverage

Soy Isoflavones Market

Published : October 2022

Food and Beverage

Isoflavones Market

Published : June 2022

Explore Food and Beverage Insights

View Reports