
- Market Size (2026)
- USD 7.3 Bn
- Forecast (2036)
- USD 230.4 Bn
- CAGR (2026 to 2036)
- 41.1%
How big is the LoRaWAN Market in 2026?
The global LoRaWAN market is estimated at USD 7.34 billion in 2026, compared with USD 5.2 billion in 2025, and is forecast to reach USD 230.42 billion by 2036, expanding at a CAGR of 41.1% from 2026 to 2036.
Demand for low-power wide-area network solutions is supported by utility investments in remote metering and the replacement of manual data collection systems. Hardware accounts for the largest market share by component at 41.6% in 2026, while private networks contribute 39.5% by deployment model and smart gas and water metering holds 21.7% by application. Utilities are increasingly adopting connected meters to reduce field visits and identify abnormal consumption before it results in substantial water losses. The scale of these investments is reflected in Aarhus Vand's smart water metering programme in Denmark. In August 2026, Netmore announced a partnership with Aarhus Vand and Kamstrup to deploy approximately 69,000 digitally connected water meters across Aarhus Municipality. The agreement followed a successful pilot involving approximately 1,000 households, where network connectivity and meter communication were validated. The deployment will continue through 2030, with Eltel responsible for coordinating installations across different districts. Netmore will establish and manage the LoRaWAN network while Kamstrup supplies the digital metering technology. The project is expected to eliminate manual meter readings and improve the early identification of leaks and abnormal water consumption. The multi-year programme also provides equipment suppliers and network operators with commercial opportunities extending beyond initial hardware installation.
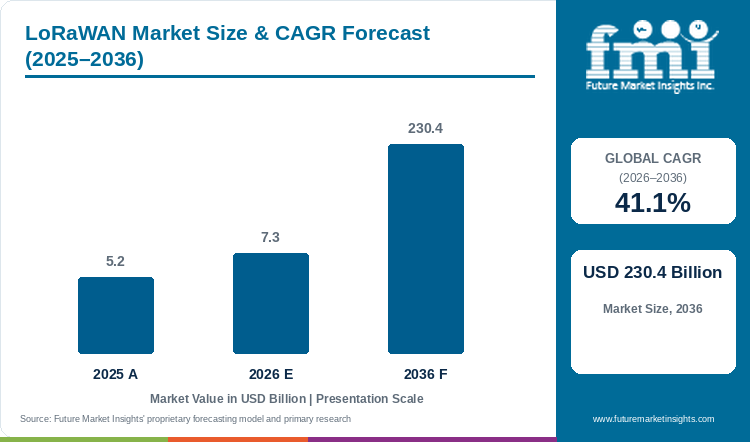
The installed base also supports a wider replacement and service market. The LoRa Alliance reported 150 million deployed LoRaWAN devices in September 2026, compared with 125 million announced in December 2025. These are cumulative deployment indicators, while FMI's forecast measures annual market revenue. FMI finds that a larger installed fleet creates work in device management and application integration even when a functioning endpoint does not need immediate replacement.
Key Market Trends & Insights
- The LoRa Alliance reported more than 695 certified devices and close to 1,000 marketplace products in September 2026. The expanding choice gives buyers more alternatives, but makes the exact certification profile and application compatibility material to selection.
- Kinéis and Netmore announced a satellite and terrestrial connectivity partnership in September 2026. The commercial opening is continuity outside terrestrial coverage; an announced combined offer does not establish that every existing LoRaWAN endpoint can connect directly to a satellite.
- Microchip's RN2483 listing distinguishes versions supporting different LoRaWAN releases and warns that software is supplied as-is with limited support. A module's availability therefore needs to be assessed alongside maintenance responsibility over the life of the finished device.
Regional Highlights
- In Europe, Cologne-based 1NCE opened access to Netmore's LoRaWAN services through its platform in March 2026. Combining cellular and LoRaWAN access through one software environment gives regional product developers another way to serve mixed coverage requirements.
- In South Asia, the April 2026 Water in India conference brought gateway, metering and radio suppliers into the same utility discussion. The Alliance's event account shows a supply chain addressing water management together rather than treating connectivity as an isolated equipment purchase.
Table 1: LoRaWAN Market Size and Forecast (USD billion and CAGR percentage), 2025 to 2036
| Market size and forecast | Value |
|---|---|
| Market size in 2025 | USD 5.2 billion |
| Estimated market size in 2026 | USD 7.34 billion |
| Projected market size by 2036 | USD 230.42 billion |
| CAGR from 2026 to 2036 | 41.1% |
| Added revenue from 2026 to 2036 | USD 223.08 billion |
| Market size forecast for 2035 | USD 163.3 billion |
Source: Future Market Insights, LoRaWAN Market Report, 2026 to 2036.
Analyst Perspective
“A connected meter is useful only when its reading reaches the utility's application reliably. Device counts show installed reach; they do not state the annual equipment, network or service revenue earned from those deployments.”
- Sudip Saha, Principal Consultant, FMI
How is the LoRaWAN Market segmented?
- By Component: Hardware, Software and Services.
- By Deployment Model: Private network segment, Public networks and Hybrid networks.
- By Application: Smart gas and water metering, Asset tracking, Smart buildings, Smart parking, Precision agriculture, Smart waste management, Livestock monitoring and Others.
- By End Use: Utilities, Healthcare, Agriculture, Logistics and transportation, Manufacturing, Consumer electronics, Government and public sector, and Others.
- By Region: North America, Latin America, Western Europe, Eastern Europe, East Asia, South Asia and Pacific, and Middle East and Africa.
Why does hardware lead by component?
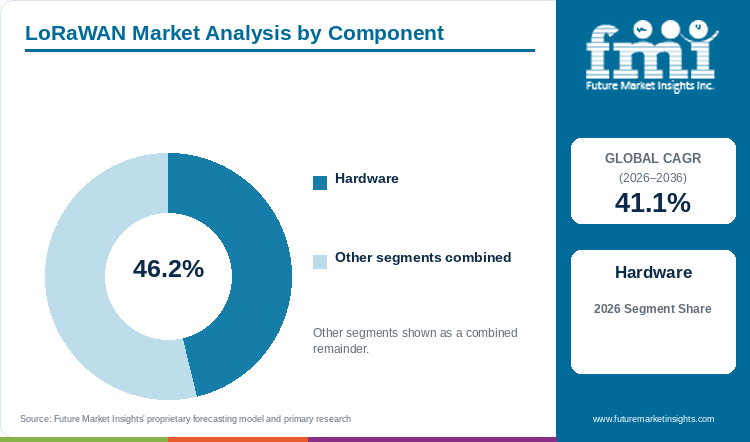
Hardware accounts for 46.2% of the LoRaWAN Market by component in FMI's 2026 assessment.
The initial sale requires equipment at the measurement point and a path from that device to a gateway. Kerlink's Netze BW reference describes a Baden-Württemberg network with up to 3,000 Wirnet iStation gateways planned to support municipalities' applications. The quantity is a deployment target, not a statement that every gateway has been installed. It shows why a regional network can generate substantial equipment orders before the operator collects several years of service revenue.
FMI finds that hardware selection also fixes part of the maintenance task. Microchip integrates a radio, controller and LoRaWAN stack in its RN2483 module, while its current support notice leaves software maintenance primarily with the user. A low module price does not by itself remove the cost of maintaining the finished endpoint. Suppliers can defend hardware revenue by pairing the correct regional radio and firmware profile with a device that the customer can support in the field.
Table 2: LoRaWAN Market Leading Component Share, 2026
| Leading Share | 2026 market share |
|---|---|
| Hardware | 46.2% |
| All Other Segments Combined Share | 53.8% |
Source: Future Market Insights, LoRaWAN Market Report, 2026 to 2036.
Why does the private network segment lead by deployment model?
The private network segment accounts for 39.5% of the LoRaWAN Market by deployment model in FMI's 2026 assessment.
A site owner can place gateways where its own devices need them and decide who operates the servers. That control is useful when coverage priorities differ from a public operator's footprint. ZENNER describes a German managed-service arrangement in which the customer can retain ownership of the infrastructure while ZENNER Connect runs the network. FMI classifies the network by the dedicated deployment arrangement rather than assuming that outsourcing operations makes every network public.
The private model still needs a commercial reason to bear local equipment and operating costs. A building or industrial site with several measurement tasks can spread those costs across its own sensors. Netmore's January 2026 acquisition of Actility brought on-premise network capabilities into a business that also operates carrier networks. FMI finds that suppliers increasingly need to support both arrangements, because ownership, coverage and administration can differ even when the same radio standard carries the data.
Table 3: LoRaWAN Market Leading Deployment Model Share, 2026
| Leading Share | 2026 market share |
|---|---|
| Private network segment | 39.5% |
| All Other Segments Combined Share | 60.5% |
Source: Future Market Insights, LoRaWAN Market Report, 2026 to 2036.
What supports smart gas and water metering as the leading application?
Smart gas and water metering accounts for 21.7% of the LoRaWAN Market by application in FMI's 2026 assessment.
Metering provides a repeated task that the customer can measure: obtaining a usable reading without visiting every meter. The LoRa Alliance's 2025 review identifies utilities as the largest deployment vertical, led by smart water. That industry observation supports the application's importance, while FMI's percentage describes revenue across the application categories rather than a share of all installed endpoints.
The route to revenue is often staged. Eltel's July 2026 Aarhus Vand announcement assigns it planning, appointments, installation and documentation, with replacement proceeding area by area to 2030. FMI finds that this separates the work of connecting a meter from the work of replacing it at the property. Network operators, meter manufacturers and installation contractors can all participate, but their revenues and delivery obligations differ. Suppliers that fit the utility's installation schedule can convert a network award into recurring orders.
Table 4: LoRaWAN Market Leading Application Share, 2026
| Leading Share | 2026 market share |
|---|---|
| Smart gas and water metering | 21.7% |
| All Other Segments Combined Share | 78.3% |
Source: Future Market Insights, LoRaWAN Market Report, 2026 to 2036.
What are the key drivers restraints and opportunities?
FMI separates the decision to install devices from the work of operating them and the opportunity to reuse the network for another task. Each creates a different source of revenue.
Driver
Avoiding repeated manual readings supports utility spending. Netmore states that the Aarhus project will collect consumption data remotely and help identify unusually high consumption. The commercial driver is the recurring operational task replaced across the meter fleet. A larger network order follows when a utility accepts that data in its customer and leakage processes, rather than simply when a radio test succeeds.
Restraint
Radio coverage and application integration can delay the benefit of an installed sensor. The LoRaWAN architecture sends endpoint messages through gateways and network servers; it does not remove the need to connect the readings to a working application. FMI finds that a buyer can own functioning radio hardware and still lack usable meter records if payload interpretation, device identity or system integration is incomplete.
Opportunity
An existing network can support additional measurement tasks without repeating every part of the installation. At Europa-Park in Germany, ZENNER's water-level monitoring case uses ultrasonic sensors reporting every 30 minutes. The opportunity is to add a defined task to an available local network. It depends on suitable coverage and an operating use for the data, rather than on adding sensors without a responsible user.
How do spectrum and certification rules affect purchasing?
Regional radio profiles matter to the equipment order. The Alliance's 1.0.4 reference implementation lists validation for profiles including EU868, IN865 and US915. A customer cannot assume that a module configured for one region is ready for another. FMI finds that the purchase specification needs the intended operating region and protocol version as well as certification, which reduces the risk of selecting compatible-looking equipment that requires replacement or reconfiguration.
What limits reliable technical operation?
An endpoint needs a usable radio path and an operating server chain. The Alliance describes gateways relaying messages to a central network server over IP connections. Gateway power, backhaul and local radio conditions therefore remain part of the delivery obligation. FMI finds that a successful pilot should be extended to the difficult installation points and the intended reporting schedule before the buyer assumes that the whole device fleet will deliver the same result.
Where can LoRaWAN suppliers win additional business?
The opening is to provide one operating view across different network types while retaining the equipment needed at each site. 1NCE's March 2026 integration of Netmore access gives its customers cellular and LoRaWAN options through its software platform. FMI finds that a supplier can win by reducing the customer's administration work across those connections. A combined platform is valuable when it simplifies a real mixed network; it does not erase differences in coverage, radio capability or service terms.
LoRaWAN Market by Country (2026 to 2036)
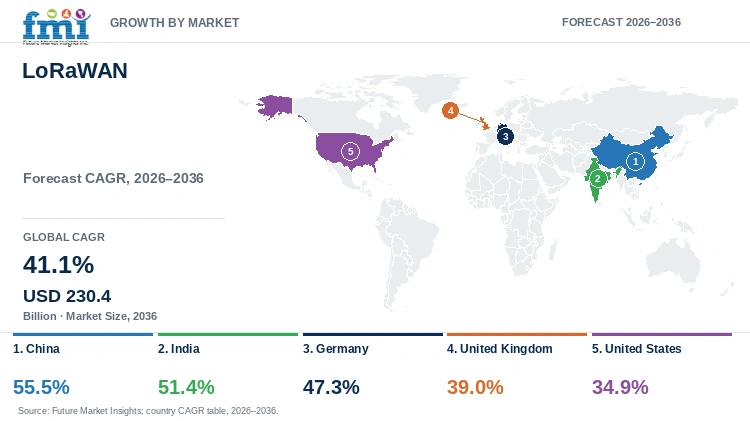
Table 5: LoRaWAN Market Country CAGR Comparison, 2026 to 2036
| Country | CAGR |
|---|---|
| China | 55.5% |
| India | 51.4% |
| Germany | 47.3% |
| United Kingdom | 39.0% |
| United States | 34.9% |
Source: Future Market Insights, LoRaWAN Market Report, 2026 to 2036.
What shapes LoRaWAN demand in China?
China's national connected-device targets give LoRaWAN suppliers a strong competing technology to address. The Ministry of Industry and Information Technology's mobile-IoT policy targets more than 3.6 billion connections by 2027, with 4G and 5G accounting for 95%, and explicitly includes NB-IoT in the cellular development programme. Those targets concern mobile IoT and cannot be counted as LoRaWAN installations. A large national device total therefore says little about the LoRaWAN orders available to an equipment supplier or network operator.
Dedicated industrial sites, buildings and monitoring tasks offer a more specific route to business. An enterprise may want to position its own gateways and control its equipment and server arrangement; the Alliance documents private as well as public network options. These selective applications underpin FMI's forecast of a 55.5% CAGR for China from 2026 to 2036, from a smaller LoRaWAN base within the wider connected-device economy. The rate does not imply that LoRaWAN leads the country's low-power connectivity market. Each project must offer an operating benefit sufficient to justify the choice alongside the national cellular programme.
Implementation will determine whether those opportunities become repeat orders. The radio configuration has to suit the site, an installer must test the actual locations, and the customer's application must be able to use intermittent sensor readings. Suppliers that make that combination repeatable can extend a working project to other sites. A utility or municipality adding connected devices still has to choose its communications route; neither that purchasing activity nor a government cellular target independently validates the LoRaWAN revenue forecast.
What supports LoRaWAN demand in India?
Who owns the gateways, and who keeps them working, is a material purchasing decision for Indian utilities connecting dispersed assets. The LoRa Alliance's account of the April 2026 Water in India conference describes private ownership as one option and brings metering, gateway and radio suppliers into the same discussion. It records a purchasing model being discussed, rather than a national count of LoRaWAN meters already commissioned. A utility with suitable sites and field staff can retain infrastructure control; a managed arrangement can place more operating responsibility with a supplier.
Either arrangement needs reliable power, backhaul and a route from device data into the utility's system. Low endpoint prices do not settle these costs, particularly when maintenance requires long journeys between installations. Equipment configuration adds another execution requirement: the Alliance's 1.0.4 reference implementation includes IN865 among its validated regional profiles. Importers and integrators need to match endpoints and gateways to the intended local configuration before installing a fleet. Delivering devices to a warehouse leaves both the radio path and the eventual maintenance task unresolved.
For a utility, the return comes from usable readings across its deployed estate. FMI's 51.4% CAGR forecast for India from 2026 to 2036 rests on projects that combine the meter, communications path and operating arrangement into that practical service while controlling installation and maintenance costs. A repeatable field installation and a defined response to failed readings give suppliers a stronger proposition than an inexpensive sensor alone. These capabilities let a buyer assess whether an initial installation can be extended without transferring an undefined service burden to its own staff.
What sustains LoRaWAN demand in Germany?
Municipalities can add monitoring tasks through Germany's local network infrastructure, creating work beyond the initial gateway order. Kerlink's Netze BW reference identifies ZENNER and a Baden-Württemberg deployment targeting up to 3,000 gateways. The figure is a target, not a completed installation count. It identifies the operating partners and the infrastructure through which municipalities can add applications, giving the German demand argument a local basis rather than relying on a water-meter award elsewhere in Europe. Industrial sites can likewise assess whether one network can serve several monitoring tasks.
Owning that infrastructure does not require a customer to undertake every operating function. ZENNER's German managed-service offer allows customers to retain ownership while ZENNER Connect runs the network. Municipal customers can use their locations and field access while assigning network-management work to a specialist. The operator then has a service opportunity after the equipment sale. Contracts still need to allocate responsibility for device identities, data and maintenance; outsourcing operation does not remove those obligations from the project.
A smaller application shows what further network use can deliver. At Europa-Park in Rust, water-level sensors report every 30 minutes to replace manual monitoring. This demonstrates an additional workload for a local network without establishing a national adoption percentage. Extending such working applications across customers and sites supports FMI's German forecast of a 47.3% CAGR from 2026 to 2036. Gateway capacity becomes commercially useful when it carries a repeatable operational task for an identified user; broad smart-city claims alone do not provide the same route to revenue.
What drives LoRaWAN demand in the United Kingdom?
A British water-meter award creates several commercial milestones before it produces usable readings. Severn Trent selected Netmore in September 2025 for network services supporting one million smart meters across more than 20 counties, specifying a dual LoRaWAN and NB-IoT network. The programme cannot be presented as one million LoRaWAN-only endpoints. Its technology mix and installation timing determine which equipment and services are purchased, and when participants in the supply chain earn revenue.
Water companies also have other communications routes available. United Utilities reported installing more than 200,000 smart meters during its 2025/26 financial year. That is evidence of an active local metering programme, not a LoRaWAN device count. The comparison matters because the utility buys a reliable reading service and can select a technology or combine technologies to meet its field requirements. A LoRaWAN supplier must demonstrate that its coverage and integration meet those requirements rather than treating wider smart-meter spending as an automatic order book.
Successful execution of the programmes available to LoRaWAN underlies FMI's 39.0% CAGR forecast for the United Kingdom from 2026 to 2036. Network coverage must align with meter-replacement crews, readings must reach the correct customer record, and difficult installation points need support before the next area is opened. An offer that places these activities under clear responsibility gives the utility a practical basis for expanding a rollout. Announced contracts support a pipeline of potential work, while a meter delivered, a meter installed and a meter producing usable data remain different measures of progress.
What supports LoRaWAN demand in the United States?
US utility districts can buy a communications service alongside compatible meters instead of funding every network function internally. The LoRa Alliance's North American water-metering resource describes high-density public LoRaWAN networks using Neptune and Senet equipment and services. This offers a practical network-as-a-service route for districts seeking remote readings across urban and rural service areas: a specialist provides communications while the utility retains responsibility for its water operations. The purchasing decision therefore includes service performance as well as the meter itself.
Responsibility becomes clearest when a reading fails. The provider needs to prove coverage at the actual meter locations and define how missed readings are identified and repaired. A regional coverage map helps with planning, but a below-ground installation may still require additional infrastructure or another configuration. The value of the arrangement depends on who resolves that problem and how quickly usable data returns. Separating meter performance, radio performance and data-system performance in delivery commitments gives a district a clearer basis for moving from a pilot to a full rollout.
FMI forecasts a 34.9% CAGR for the United States from 2026 to 2036, the lowest of the five profiled countries but still substantial expansion from the current market base. Repeatable utility projects and additional monitoring uses on deployed networks provide the growth route. Device certification can broaden a utility's equipment choices, while network and application integration remain local responsibilities. Suppliers that combine those choices with explicit service commitments can help customers extend a working network without leaving failures between the equipment, communications and application providers unresolved.
Who are the notable companies in the LoRaWAN Market?
Netmore, Actility, Kerlink and Orange represent different commercial roles in the LoRaWAN chain. FMI finds that network operation, platform software and gateway supply must be compared separately even when they are sold in the same project.
Netmore acquired Actility in January 2026, bringing ThingPark platform capabilities and an established operator ecosystem into its network business. Actility therefore remains relevant as a platform and product name within the combined group; it should not be treated as an unrelated competitor when discussing that transaction. Orange is identified in the acquisition announcement as a long-standing ThingPark partner operating a large public LoRaWAN network. A platform relationship can connect two firms commercially without making their customer contracts or geographic coverage identical.
Kerlink supplies gateways, with its Netze BW reference identifying the equipment role in a German deployment involving ZENNER. Microchip occupies the endpoint-module stage, where the embedded radio and software profile affect the finished device design. FMI finds that these roles create different sources of revenue: equipment at installation, software and network management during operation, and application integration when the customer starts using the data. Buyers gain from knowing which participant is responsible for each stage. None of the device counts or selected contracts in this report supplies a comparable company revenue-share ranking.
Key Developments in the LoRaWAN Market
- On 26 January 2026, Netmore announced its acquisition of Paris-based Actility, including Abeeway. The announcement combined operator-network capabilities with ThingPark platforms and reported more than 14 million contracted IoT devices across the combined networks; contracted devices are distinct from devices already active.
Key Players in the LoRaWAN Market
- Netmore Group
- Actility
- Kerlink
- Orange
- Microchip Technology
- ZENNER
- Kamstrup
LoRaWAN Market Report Scope
Table 6: Report Scope for the LoRaWAN Market, 2026 to 2036
| Coverage field | Report scope |
|---|---|
| Market definition | Revenue associated with LoRaWAN hardware, software and services for the applications and end uses listed below. |
| Market boundaries | Excludes unrelated cellular and satellite revenue; mixed-technology awards are not counted wholly as LoRaWAN deployment evidence. |
| Quantitative units | USD billion for market revenue; percentages for segment shares and country CAGRs. |
| Forecast period | 2026 to 2036, with 2025 as the preceding reference year and the 2035 forecast also shown. |
| Component coverage | Endpoints, modules and gateways within hardware; network and related software; deployment and operating services. |
| Deployment coverage | Private, public and hybrid network arrangements, distinct from the application being served. |
| Application and end-use coverage | Metering, tracking, buildings and other listed applications across utilities, industry and the other named customer sectors. |
| Geographic coverage | Seven regions with the nested country and subregion roster below. |
| Countries profiled | China, India, Germany, United Kingdom and United States; these profiles do not limit the global market total. |
| Competitive coverage | Verified product roles, network contracts and acquisition status; no numerical company-share ranking. |
Source: Future Market Insights, LoRaWAN Market Report, 2026 to 2036.
LoRaWAN Market Research Methodology
This assessment uses FMI's value series and country forecasts. The 2026 segment mix is assessed against the preceding FMI mix and current evidence on deployment models, utility applications and equipment demand. Secondary research reviews Alliance specifications, government policy, company product records and named network projects. Installed, contracted and active device counts remain separate from annual revenue, and mixed-technology programmes are not treated as LoRaWAN-only fleets. No new primary interviews or customer survey are claimed.
LoRaWAN Market by Segments
LoRaWAN Market segmented by Component:
- Hardware
- Software
- Services
LoRaWAN Market segmented by Deployment Model:
- Private network segment
- Public networks
- Hybrid networks
LoRaWAN Market segmented by Application:
- Smart gas and water metering
- Asset tracking
- Smart buildings
- Smart parking
- Precision agriculture
- Smart waste management
- Livestock monitoring
- Others
LoRaWAN Market segmented by End Use:
- Utilities
- Healthcare
- Agriculture
- Logistics and transportation
- Manufacturing
- Consumer electronics
- Government and public sector
- Others
LoRaWAN Market by Region
- North America
- United States
- Canada
- Latin America
- Brazil
- Mexico
- Argentina
- Chile
- Western Europe
- Germany
- France
- United Kingdom
- Italy
- Spain
- Benelux
- Nordics
- Eastern Europe
- Poland
- Czech Republic
- Romania
- Hungary
- East Asia
- China
- Japan
- South Korea
- Taiwan
- South Asia and Pacific
- India
- Singapore
- Other ASEAN countries
- Australia and New Zealand
- Middle East and Africa
- GCC Countries
- South Africa
- Türkiye
- Israel
Research Sources and Bibliography
- [1] Netmore Group. Aarhus Vand Selects Netmore for Smart Meter Network. 25 August 2026.
- [2] LoRa Alliance. 150 Million LoRaWAN Devices Deployed Globally. 22 September 2026.
- [3] LoRa Alliance. 125 Million LoRaWAN End Devices Deployed Globally. 10 December 2025.
- [4] Kinéis. Kinéis and Netmore Join Forces to Bridge IoT Connectivity Gaps Worldwide. 3 September 2026.
- [5] Microchip Technology. RN2483 product listing, firmware versions and software support notice. Accessed 31 October 2026.
- [6] 1NCE. 1NCE and Netmore Combine Cellular and LoRaWAN Access to Deliver Global IoT Coverage. 11 March 2026.
- [7] Kerlink, Ripple Metering and Semtech, LoRa Alliance blog. No Wires, No Waste: What the Water in India Conference Revealed About LoRaWAN. 19 August 2026.
- [8] Kerlink. Netze BW deployment reference. Accessed 31 October 2026.
- [9] ZENNER. LoRaWAN Network Operation, managed services in Germany. Accessed 31 October 2026.
- [10] Actility. Netmore Acquires Actility to Lead Global Transformation of Massive IoT. 26 January 2026.
- [11] LoRa Alliance. LoRaWAN Enters Its Next Growth Phase as Massive IoT Scales Globally, 2025 End of Year Report release. 17 February 2026.
- [12] Eltel Networks Denmark. Eltel Helps Aarhus Vand Roll Out 69,000 Digital Water Meters. 3 July 2026.
- [13] LoRa Alliance. About LoRaWAN, architecture and network options. Accessed 31 October 2026.
- [14] LoRa Alliance and ZENNER. LoRaWAN Success Story: Europa-Park in Rust, Germany. 18 August 2026.
- [15] LoRa Alliance. LoRaWAN 1.0.4 Specification Package. Accessed 31 October 2026.
- [16] Ministry of Industry and Information Technology, China. Notice on Advancing Mobile Internet of Things Development. September 2024.
- [17] Netmore Group, published by LoRa Alliance. Severn Trent Selects Netmore for One Million Smart Water Meters. 2 September 2025.
- [18] United Utilities Group. Preliminary Full Year Results 2025/26. 30 April 2026.
- [19] LoRa Alliance. The Evolution of Smart Water Metering in North America: Deploying LoRaWAN AMI with Neptune and Senet. Accessed 31 October 2026.
Table of Content
- Key Takeaways
- Market Size and CAGR
- Top Growth Driver
- Fastest Growing Segment
- Leading Region
- Key Companies
- Emerging Opportunities
- Executive Summary
- Global Market Outlook
- Demand-side Trends
- Supply-side Trends
- Technology Roadmap Analysis
- Analysis and Recommendations
- Analyst Perspective (What is happening? Why now? What should investors know?)
- Key Questions Answered
- How large is the market?
- What is the CAGR?
- What are key trends?
- Which region dominates?
- Who are the leaders?
Read More...
- Market Overview
- Market Coverage / Taxonomy
- Market Definition / Scope / Limitations
- Research Methodology
- Chapter Orientation
- Analytical Lens and Working Hypotheses
- Market Structure, Signals, and Trend Drivers
- Benchmarking and Cross-market Comparability
- Market Sizing, Forecasting, and Opportunity Mapping
- Research Design and Evidence Framework
- Desk Research Programme (Secondary Evidence)
- Expert Input and Fieldwork (Primary Evidence)
- Tooling, Models, and Reference Databases
- Data Engineering and Model Build
- Quality Assurance and Audit Trail
- Market Background
- Market Dynamics (Drivers, Restraints, Opportunity, Trends)
- Scenario Forecast (Optimistic, Likely, Conservative)
- Impact Analysis
- AI Impact
- Sustainability Impact
- Regulatory Impact
- Technology Impact
- Consumer / Buyer Analysis
- Purchase Drivers
- Adoption Barriers
- Buyer Journey
- Opportunity Map Analysis
- Product Life Cycle Analysis
- Supply Chain Analysis
- Investment Feasibility Matrix
- Value Chain Analysis
- PESTLE and Porter's Analysis
- Regulatory Landscape
- Regional Parent Market Outlook
- Production and Consumption Statistics
- Import and Export Statistics
- Global Market Analysis and Forecast, 2021 to 2036
- Historical Market Size Value (USD Billion) Analysis, 2021 to 2025
- Current and Future Market Size Value (USD Billion) Projections, 2026 to 2036
- Y-o-Y Growth Trend Analysis
- Absolute $ Opportunity Analysis
- Global Market Pricing Analysis, 2021 to 2036
- Global Market Analysis and Forecast, By Component, 2021 to 2036
- Introduction / Key Findings
- Historical Market Size Value (USD Billion) Analysis By Component, 2021 to 2025
- Current and Future Market Size Value (USD Billion) Analysis and Forecast By Component, 2026 to 2036
- Hardware
- Software
- Services
- Y-o-Y Growth Trend Analysis By Component, 2021 to 2025
- Absolute $ Opportunity Analysis By Component, 2026 to 2036
- Global Market Analysis and Forecast, By Deployment Model, 2021 to 2036
- Introduction / Key Findings
- Historical Market Size Value (USD Billion) Analysis By Deployment Model, 2021 to 2025
- Current and Future Market Size Value (USD Billion) Analysis and Forecast By Deployment Model, 2026 to 2036
- Private network segment
- Public networks
- Hybrid networks
- Y-o-Y Growth Trend Analysis By Deployment Model, 2021 to 2025
- Absolute $ Opportunity Analysis By Deployment Model, 2026 to 2036
- Global Market Analysis and Forecast, By Application, 2021 to 2036
- Introduction / Key Findings
- Historical Market Size Value (USD Billion) Analysis By Application, 2021 to 2025
- Current and Future Market Size Value (USD Billion) Analysis and Forecast By Application, 2026 to 2036
- Smart gas and water metering
- Asset tracking
- Smart buildings
- Smart parking
- Precision agriculture
- Smart waste management
- Livestock monitoring
- Others
- Y-o-Y Growth Trend Analysis By Application, 2021 to 2025
- Absolute $ Opportunity Analysis By Application, 2026 to 2036
- Global Market Analysis and Forecast, By End Use, 2021 to 2036
- Introduction / Key Findings
- Historical Market Size Value (USD Billion) Analysis By End Use, 2021 to 2025
- Current and Future Market Size Value (USD Billion) Analysis and Forecast By End Use, 2026 to 2036
- Utilities
- Healthcare
- Agriculture
- Logistics and transportation
- Manufacturing
- Consumer electronics
- Government and public sector
- Others
- Y-o-Y Growth Trend Analysis By End Use, 2021 to 2025
- Absolute $ Opportunity Analysis By End Use, 2026 to 2036
- Global Market Analysis and Forecast, By Region, 2021 to 2036
- Introduction
- Historical Market Size Value (USD Billion) Analysis By Region, 2021 to 2025
- Current Market Size Value (USD Billion) Analysis and Forecast By Region, 2026 to 2036
- North America
- Latin America
- Western Europe
- Eastern Europe
- East Asia
- South Asia and Pacific
- Middle East and Africa
- Market Attractiveness Analysis By Region
- North America Market Analysis and Forecast, By Country, 2021 to 2036
- Historical Market Size Value (USD Billion) Trend Analysis By Market Taxonomy, 2021 to 2025
- Market Size Value (USD Billion) Forecast By Market Taxonomy, 2026 to 2036
- By Country
- United States
- Canada
- By Component
- By Deployment Model
- By Application
- By End Use
- By Country
- Market Attractiveness Analysis
- By Country
- By Component
- By Deployment Model
- By Application
- By End Use
- Key Takeaways
- Latin America Market Analysis and Forecast, By Country
- Historical Market Size Value (USD Billion) Trend Analysis By Market Taxonomy, 2021 to 2025
- Market Size Value (USD Billion) Forecast By Market Taxonomy, 2026 to 2036
- By Country
- Brazil
- Mexico
- Argentina
- Chile
- By Component
- By Deployment Model
- By Application
- By End Use
- By Country
- Market Attractiveness Analysis
- By Country
- By Component
- By Deployment Model
- By Application
- By End Use
- Key Takeaways
- Western Europe Market Analysis and Forecast, By Country
- Historical Market Size Value (USD Billion) Trend Analysis By Market Taxonomy, 2021 to 2025
- Market Size Value (USD Billion) Forecast By Market Taxonomy, 2026 to 2036
- By Country
- Germany
- France
- United Kingdom
- Italy
- Spain
- Benelux
- Nordics
- By Component
- By Deployment Model
- By Application
- By End Use
- By Country
- Market Attractiveness Analysis
- By Country
- By Component
- By Deployment Model
- By Application
- By End Use
- Key Takeaways
- Eastern Europe Market Analysis and Forecast, By Country
- Historical Market Size Value (USD Billion) Trend Analysis By Market Taxonomy, 2021 to 2025
- Market Size Value (USD Billion) Forecast By Market Taxonomy, 2026 to 2036
- By Country
- Poland
- Czech Republic
- Romania
- Hungary
- By Component
- By Deployment Model
- By Application
- By End Use
- By Country
- Market Attractiveness Analysis
- By Country
- By Component
- By Deployment Model
- By Application
- By End Use
- Key Takeaways
- East Asia Market Analysis and Forecast, By Country
- Historical Market Size Value (USD Billion) Trend Analysis By Market Taxonomy, 2021 to 2025
- Market Size Value (USD Billion) Forecast By Market Taxonomy, 2026 to 2036
- By Country
- China
- Japan
- South Korea
- Taiwan
- By Component
- By Deployment Model
- By Application
- By End Use
- By Country
- Market Attractiveness Analysis
- By Country
- By Component
- By Deployment Model
- By Application
- By End Use
- Key Takeaways
- South Asia and Pacific Market Analysis and Forecast, By Country
- Historical Market Size Value (USD Billion) Trend Analysis By Market Taxonomy, 2021 to 2025
- Market Size Value (USD Billion) Forecast By Market Taxonomy, 2026 to 2036
- By Country
- India
- Singapore
- Other ASEAN countries
- Australia and New Zealand
- By Component
- By Deployment Model
- By Application
- By End Use
- By Country
- Market Attractiveness Analysis
- By Country
- By Component
- By Deployment Model
- By Application
- By End Use
- Key Takeaways
- Middle East and Africa Market Analysis and Forecast, By Country
- Historical Market Size Value (USD Billion) Trend Analysis By Market Taxonomy, 2021 to 2025
- Market Size Value (USD Billion) Forecast By Market Taxonomy, 2026 to 2036
- By Country
- GCC Countries
- South Africa
- Türkiye
- Israel
- By Component
- By Deployment Model
- By Application
- By End Use
- By Country
- Market Attractiveness Analysis
- By Country
- By Component
- By Deployment Model
- By Application
- By End Use
- Key Takeaways
- Key Countries Market Analysis
- United States
- Pricing Analysis
- Market Share Analysis, 2025
- By Component
- By Deployment Model
- By Application
- By End Use
- Canada
- Pricing Analysis
- Market Share Analysis, 2025
- By Component
- By Deployment Model
- By Application
- By End Use
- Mexico
- Pricing Analysis
- Market Share Analysis, 2025
- By Component
- By Deployment Model
- By Application
- By End Use
- Brazil
- Pricing Analysis
- Market Share Analysis, 2025
- By Component
- By Deployment Model
- By Application
- By End Use
- Chile
- Pricing Analysis
- Market Share Analysis, 2025
- By Component
- By Deployment Model
- By Application
- By End Use
- Germany
- Pricing Analysis
- Market Share Analysis, 2025
- By Component
- By Deployment Model
- By Application
- By End Use
- United Kingdom
- Pricing Analysis
- Market Share Analysis, 2025
- By Component
- By Deployment Model
- By Application
- By End Use
- Italy
- Pricing Analysis
- Market Share Analysis, 2025
- By Component
- By Deployment Model
- By Application
- By End Use
- Spain
- Pricing Analysis
- Market Share Analysis, 2025
- By Component
- By Deployment Model
- By Application
- By End Use
- France
- Pricing Analysis
- Market Share Analysis, 2025
- By Component
- By Deployment Model
- By Application
- By End Use
- India
- Pricing Analysis
- Market Share Analysis, 2025
- By Component
- By Deployment Model
- By Application
- By End Use
- Australia and New Zealand
- Pricing Analysis
- Market Share Analysis, 2025
- By Component
- By Deployment Model
- By Application
- By End Use
- China
- Pricing Analysis
- Market Share Analysis, 2025
- By Component
- By Deployment Model
- By Application
- By End Use
- Japan
- Pricing Analysis
- Market Share Analysis, 2025
- By Component
- By Deployment Model
- By Application
- By End Use
- South Korea
- Pricing Analysis
- Market Share Analysis, 2025
- By Component
- By Deployment Model
- By Application
- By End Use
- Poland
- Pricing Analysis
- Market Share Analysis, 2025
- By Component
- By Deployment Model
- By Application
- By End Use
- Hungary
- Pricing Analysis
- Market Share Analysis, 2025
- By Component
- By Deployment Model
- By Application
- By End Use
- Türkiye
- Pricing Analysis
- Market Share Analysis, 2025
- By Component
- By Deployment Model
- By Application
- By End Use
- South Africa
- Pricing Analysis
- Market Share Analysis, 2025
- By Component
- By Deployment Model
- By Application
- By End Use
- United States
- Market Structure Analysis
- Competition Dashboard
- Competition Benchmarking
- Market Share Analysis of Top Players
- By Regional
- By Component
- By Deployment Model
- By Application
- By End Use
- Emerging Startups
- Innovation Benchmarking
- Competition Analysis
- Competition Deep Dive
- Netmore Group
- Overview
- Product Portfolio
- Profitability by Market Segments
- Sales Footprint
- Strategy Overview
- Marketing Strategy
- Product Strategy
- Channel Strategy
- Actility
- Kerlink
- Orange
- Microchip Technology
- Kamstrup
- ZENNER
- Netmore Group
- Case Studies
- Success Stories
- Recent Developments
- Competition Deep Dive
- Assumptions & Acronyms Used
List of Tables
- Table 1: Global Market Value (USD Billion) Forecast by Region, 2021 to 2036
- Table 2: Global Market Value (USD Billion) Forecast by Component, 2021 to 2036
- Table 3: Global Market Value (USD Billion) Forecast by Deployment Model, 2021 to 2036
- Table 4: Global Market Value (USD Billion) Forecast by Application, 2021 to 2036
- Table 5: Global Market Value (USD Billion) Forecast by End Use, 2021 to 2036
- Table 6: North America Market Value (USD Billion) Forecast by Country, 2021 to 2036
- Table 7: North America Market Value (USD Billion) Forecast by Component, 2021 to 2036
- Table 8: North America Market Value (USD Billion) Forecast by Deployment Model, 2021 to 2036
- Table 9: North America Market Value (USD Billion) Forecast by Application, 2021 to 2036
- Table 10: North America Market Value (USD Billion) Forecast by End Use, 2021 to 2036
- Table 11: Latin America Market Value (USD Billion) Forecast by Country, 2021 to 2036
- Table 12: Latin America Market Value (USD Billion) Forecast by Component, 2021 to 2036
- Table 13: Latin America Market Value (USD Billion) Forecast by Deployment Model, 2021 to 2036
- Table 14: Latin America Market Value (USD Billion) Forecast by Application, 2021 to 2036
- Table 15: Latin America Market Value (USD Billion) Forecast by End Use, 2021 to 2036
- Table 16: Western Europe Market Value (USD Billion) Forecast by Country, 2021 to 2036
- Table 17: Western Europe Market Value (USD Billion) Forecast by Component, 2021 to 2036
- Table 18: Western Europe Market Value (USD Billion) Forecast by Deployment Model, 2021 to 2036
- Table 19: Western Europe Market Value (USD Billion) Forecast by Application, 2021 to 2036
- Table 20: Western Europe Market Value (USD Billion) Forecast by End Use, 2021 to 2036
- Table 21: Eastern Europe Market Value (USD Billion) Forecast by Country, 2021 to 2036
- Table 22: Eastern Europe Market Value (USD Billion) Forecast by Component, 2021 to 2036
- Table 23: Eastern Europe Market Value (USD Billion) Forecast by Deployment Model, 2021 to 2036
- Table 24: Eastern Europe Market Value (USD Billion) Forecast by Application, 2021 to 2036
- Table 25: Eastern Europe Market Value (USD Billion) Forecast by End Use, 2021 to 2036
- Table 26: East Asia Market Value (USD Billion) Forecast by Country, 2021 to 2036
- Table 27: East Asia Market Value (USD Billion) Forecast by Component, 2021 to 2036
- Table 28: East Asia Market Value (USD Billion) Forecast by Deployment Model, 2021 to 2036
- Table 29: East Asia Market Value (USD Billion) Forecast by Application, 2021 to 2036
- Table 30: East Asia Market Value (USD Billion) Forecast by End Use, 2021 to 2036
- Table 31: South Asia and Pacific Market Value (USD Billion) Forecast by Country, 2021 to 2036
- Table 32: South Asia and Pacific Market Value (USD Billion) Forecast by Component, 2021 to 2036
- Table 33: South Asia and Pacific Market Value (USD Billion) Forecast by Deployment Model, 2021 to 2036
- Table 34: South Asia and Pacific Market Value (USD Billion) Forecast by Application, 2021 to 2036
- Table 35: South Asia and Pacific Market Value (USD Billion) Forecast by End Use, 2021 to 2036
- Table 36: Middle East and Africa Market Value (USD Billion) Forecast by Country, 2021 to 2036
- Table 37: Middle East and Africa Market Value (USD Billion) Forecast by Component, 2021 to 2036
- Table 38: Middle East and Africa Market Value (USD Billion) Forecast by Deployment Model, 2021 to 2036
- Table 39: Middle East and Africa Market Value (USD Billion) Forecast by Application, 2021 to 2036
- Table 40: Middle East and Africa Market Value (USD Billion) Forecast by End Use, 2021 to 2036
List of Figures
- Figure 1: Global Market Pricing Analysis
- Figure 2: Global Market Value (USD Billion) Forecast 2021-2036
- Figure 3: Global Market Value Share and BPS Analysis by Component, 2026 and 2036
- Figure 4: Global Market Y-o-Y Growth Comparison by Component, 2026-2036
- Figure 5: Global Market Attractiveness Analysis by Component
- Figure 6: Global Market Value Share and BPS Analysis by Deployment Model, 2026 and 2036
- Figure 7: Global Market Y-o-Y Growth Comparison by Deployment Model, 2026-2036
- Figure 8: Global Market Attractiveness Analysis by Deployment Model
- Figure 9: Global Market Value Share and BPS Analysis by Application, 2026 and 2036
- Figure 10: Global Market Y-o-Y Growth Comparison by Application, 2026-2036
- Figure 11: Global Market Attractiveness Analysis by Application
- Figure 12: Global Market Value Share and BPS Analysis by End Use, 2026 and 2036
- Figure 13: Global Market Y-o-Y Growth Comparison by End Use, 2026-2036
- Figure 14: Global Market Attractiveness Analysis by End Use
- Figure 15: Global Market Value (USD Billion) Share and BPS Analysis by Region, 2026 and 2036
- Figure 16: Global Market Y-o-Y Growth Comparison by Region, 2026-2036
- Figure 17: Global Market Attractiveness Analysis by Region
- Figure 18: North America Market Incremental Dollar Opportunity, 2026-2036
- Figure 19: Latin America Market Incremental Dollar Opportunity, 2026-2036
- Figure 20: Western Europe Market Incremental Dollar Opportunity, 2026-2036
- Figure 21: Eastern Europe Market Incremental Dollar Opportunity, 2026-2036
- Figure 22: East Asia Market Incremental Dollar Opportunity, 2026-2036
- Figure 23: South Asia and Pacific Market Incremental Dollar Opportunity, 2026-2036
- Figure 24: Middle East and Africa Market Incremental Dollar Opportunity, 2026-2036
- Figure 25: North America Market Value Share and BPS Analysis by Country, 2026 and 2036
- Figure 26: North America Market Value Share and BPS Analysis by Component, 2026 and 2036
- Figure 27: North America Market Y-o-Y Growth Comparison by Component, 2026-2036
- Figure 28: North America Market Attractiveness Analysis by Component
- Figure 29: North America Market Value Share and BPS Analysis by Deployment Model, 2026 and 2036
- Figure 30: North America Market Y-o-Y Growth Comparison by Deployment Model, 2026-2036
- Figure 31: North America Market Attractiveness Analysis by Deployment Model
- Figure 32: North America Market Value Share and BPS Analysis by Application, 2026 and 2036
- Figure 33: North America Market Y-o-Y Growth Comparison by Application, 2026-2036
- Figure 34: North America Market Attractiveness Analysis by Application
- Figure 35: North America Market Value Share and BPS Analysis by End Use, 2026 and 2036
- Figure 36: North America Market Y-o-Y Growth Comparison by End Use, 2026-2036
- Figure 37: North America Market Attractiveness Analysis by End Use
- Figure 38: Latin America Market Value Share and BPS Analysis by Country, 2026 and 2036
- Figure 39: Latin America Market Value Share and BPS Analysis by Component, 2026 and 2036
- Figure 40: Latin America Market Y-o-Y Growth Comparison by Component, 2026-2036
- Figure 41: Latin America Market Attractiveness Analysis by Component
- Figure 42: Latin America Market Value Share and BPS Analysis by Deployment Model, 2026 and 2036
- Figure 43: Latin America Market Y-o-Y Growth Comparison by Deployment Model, 2026-2036
- Figure 44: Latin America Market Attractiveness Analysis by Deployment Model
- Figure 45: Latin America Market Value Share and BPS Analysis by Application, 2026 and 2036
- Figure 46: Latin America Market Y-o-Y Growth Comparison by Application, 2026-2036
- Figure 47: Latin America Market Attractiveness Analysis by Application
- Figure 48: Latin America Market Value Share and BPS Analysis by End Use, 2026 and 2036
- Figure 49: Latin America Market Y-o-Y Growth Comparison by End Use, 2026-2036
- Figure 50: Latin America Market Attractiveness Analysis by End Use
- Figure 51: Western Europe Market Value Share and BPS Analysis by Country, 2026 and 2036
- Figure 52: Western Europe Market Value Share and BPS Analysis by Component, 2026 and 2036
- Figure 53: Western Europe Market Y-o-Y Growth Comparison by Component, 2026-2036
- Figure 54: Western Europe Market Attractiveness Analysis by Component
- Figure 55: Western Europe Market Value Share and BPS Analysis by Deployment Model, 2026 and 2036
- Figure 56: Western Europe Market Y-o-Y Growth Comparison by Deployment Model, 2026-2036
- Figure 57: Western Europe Market Attractiveness Analysis by Deployment Model
- Figure 58: Western Europe Market Value Share and BPS Analysis by Application, 2026 and 2036
- Figure 59: Western Europe Market Y-o-Y Growth Comparison by Application, 2026-2036
- Figure 60: Western Europe Market Attractiveness Analysis by Application
- Figure 61: Western Europe Market Value Share and BPS Analysis by End Use, 2026 and 2036
- Figure 62: Western Europe Market Y-o-Y Growth Comparison by End Use, 2026-2036
- Figure 63: Western Europe Market Attractiveness Analysis by End Use
- Figure 64: Eastern Europe Market Value Share and BPS Analysis by Country, 2026 and 2036
- Figure 65: Eastern Europe Market Value Share and BPS Analysis by Component, 2026 and 2036
- Figure 66: Eastern Europe Market Y-o-Y Growth Comparison by Component, 2026-2036
- Figure 67: Eastern Europe Market Attractiveness Analysis by Component
- Figure 68: Eastern Europe Market Value Share and BPS Analysis by Deployment Model, 2026 and 2036
- Figure 69: Eastern Europe Market Y-o-Y Growth Comparison by Deployment Model, 2026-2036
- Figure 70: Eastern Europe Market Attractiveness Analysis by Deployment Model
- Figure 71: Eastern Europe Market Value Share and BPS Analysis by Application, 2026 and 2036
- Figure 72: Eastern Europe Market Y-o-Y Growth Comparison by Application, 2026-2036
- Figure 73: Eastern Europe Market Attractiveness Analysis by Application
- Figure 74: Eastern Europe Market Value Share and BPS Analysis by End Use, 2026 and 2036
- Figure 75: Eastern Europe Market Y-o-Y Growth Comparison by End Use, 2026-2036
- Figure 76: Eastern Europe Market Attractiveness Analysis by End Use
- Figure 77: East Asia Market Value Share and BPS Analysis by Country, 2026 and 2036
- Figure 78: East Asia Market Value Share and BPS Analysis by Component, 2026 and 2036
- Figure 79: East Asia Market Y-o-Y Growth Comparison by Component, 2026-2036
- Figure 80: East Asia Market Attractiveness Analysis by Component
- Figure 81: East Asia Market Value Share and BPS Analysis by Deployment Model, 2026 and 2036
- Figure 82: East Asia Market Y-o-Y Growth Comparison by Deployment Model, 2026-2036
- Figure 83: East Asia Market Attractiveness Analysis by Deployment Model
- Figure 84: East Asia Market Value Share and BPS Analysis by Application, 2026 and 2036
- Figure 85: East Asia Market Y-o-Y Growth Comparison by Application, 2026-2036
- Figure 86: East Asia Market Attractiveness Analysis by Application
- Figure 87: East Asia Market Value Share and BPS Analysis by End Use, 2026 and 2036
- Figure 88: East Asia Market Y-o-Y Growth Comparison by End Use, 2026-2036
- Figure 89: East Asia Market Attractiveness Analysis by End Use
- Figure 90: South Asia and Pacific Market Value Share and BPS Analysis by Country, 2026 and 2036
- Figure 91: South Asia and Pacific Market Value Share and BPS Analysis by Component, 2026 and 2036
- Figure 92: South Asia and Pacific Market Y-o-Y Growth Comparison by Component, 2026-2036
- Figure 93: South Asia and Pacific Market Attractiveness Analysis by Component
- Figure 94: South Asia and Pacific Market Value Share and BPS Analysis by Deployment Model, 2026 and 2036
- Figure 95: South Asia and Pacific Market Y-o-Y Growth Comparison by Deployment Model, 2026-2036
- Figure 96: South Asia and Pacific Market Attractiveness Analysis by Deployment Model
- Figure 97: South Asia and Pacific Market Value Share and BPS Analysis by Application, 2026 and 2036
- Figure 98: South Asia and Pacific Market Y-o-Y Growth Comparison by Application, 2026-2036
- Figure 99: South Asia and Pacific Market Attractiveness Analysis by Application
- Figure 100: South Asia and Pacific Market Value Share and BPS Analysis by End Use, 2026 and 2036
- Figure 101: South Asia and Pacific Market Y-o-Y Growth Comparison by End Use, 2026-2036
- Figure 102: South Asia and Pacific Market Attractiveness Analysis by End Use
- Figure 103: Middle East and Africa Market Value Share and BPS Analysis by Country, 2026 and 2036
- Figure 104: Middle East and Africa Market Value Share and BPS Analysis by Component, 2026 and 2036
- Figure 105: Middle East and Africa Market Y-o-Y Growth Comparison by Component, 2026-2036
- Figure 106: Middle East and Africa Market Attractiveness Analysis by Component
- Figure 107: Middle East and Africa Market Value Share and BPS Analysis by Deployment Model, 2026 and 2036
- Figure 108: Middle East and Africa Market Y-o-Y Growth Comparison by Deployment Model, 2026-2036
- Figure 109: Middle East and Africa Market Attractiveness Analysis by Deployment Model
- Figure 110: Middle East and Africa Market Value Share and BPS Analysis by Application, 2026 and 2036
- Figure 111: Middle East and Africa Market Y-o-Y Growth Comparison by Application, 2026-2036
- Figure 112: Middle East and Africa Market Attractiveness Analysis by Application
- Figure 113: Middle East and Africa Market Value Share and BPS Analysis by End Use, 2026 and 2036
- Figure 114: Middle East and Africa Market Y-o-Y Growth Comparison by End Use, 2026-2036
- Figure 115: Middle East and Africa Market Attractiveness Analysis by End Use
- Figure 116: Global Market - Tier Structure Analysis
- Figure 117: Global Market - Company Share Analysis
Frequently Asked Questions
What is the size and forecast of the LoRaWAN Market?
The market is estimated at USD 7.34 billion in 2026, compared with USD 5.2 billion in 2025, and is forecast to reach USD 230.42 billion by 2036 at a 41.1% CAGR.
Which component leads the LoRaWAN Market?
Hardware holds 46.2% by component in FMI's 2026 assessment.
Which deployment model and application lead the LoRaWAN Market?
The private network segment holds 39.5% by deployment model, while smart gas and water metering holds 21.7% by application in FMI's 2026 assessment.
Which profiled country grows fastest in the LoRaWAN Market?
China leads at 55.5%, followed by India at 51.4%, Germany at 47.3%, the United Kingdom at 39.0% and the United States at 34.9% for 2026 to 2036.
Does a mixed-technology meter contract measure LoRaWAN installations?
Its full meter count cannot be treated that way. Severn Trent's one-million-meter programme specifies both LoRaWAN and NB-IoT, so the technology allocation matters. [17]
Preview the report firsthand - request a free sample
Get SampleGet the brochure for pricing and purchase details.
Get PDF
