Malignant Pleural Effusion Market
Market Insights on Malignant Pleural Effusion covering sales outlook, demand forecast & up-to-date key trends
Malignant Pleural Effusion Market by Treatment, Diagnosis, End-Users & Region – Forecast 2023–2033
Malignant Pleural Effusion Market Snapshot (2023-2033)
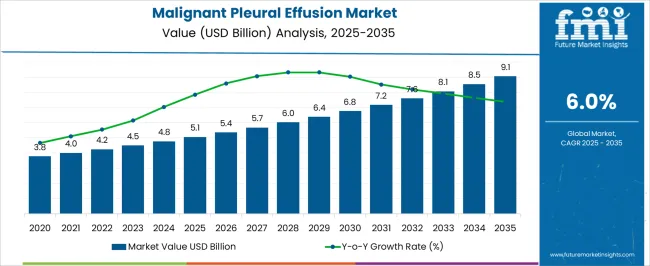
The global malignant pleural effusion market is expected to garner a market value of US$ 4.5 Billion in 2023 and is expected to accumulate a market value of US$ 8.06 Billion by registering a CAGR of 6% in the forecast period 2023-2033. The increasing incidence of pleural effusion disease and rising awareness of advancement in pleural effusions treatment with different types of techniques in the current market works as a driver for the market. The market for Malignant Pleural Effusion registered a CAGR of 4% in the historical period 2018-2022.
Clinical examinations and procedures are carried out to diagnose the condition, which aids medical professionals in making additional decisions about medicine, testing, and recuperation and is expected to accelerate market expansion throughout the projection period. Recent epidemiological data from WHO suggests that approximately more than one million pleural effusions are diagnosed in the United States each year.
Report Attribute |
Details |
Expected Market Value (2023) |
US$ 4.5 Billion |
Anticipated Forecast Value (2033) |
US$ 8.06 Billion |
Projected Growth Rate (2023-2033) |
6% CAGR |
Let us know your requirement to get
100% FREE customization
2018-2022 Malignant Pleural Effusion Market Demand Analysis vs. Forecast 2023-2033
According to market research and competitive intelligence provider Future Market Insights- the market for Malignant Pleural Effusion reflected a value of 4% during the historical period, 2018-2022. Various factors such as awareness in wellness and health, the diagnostics, and pathology segment are improving in the developing countries nowadays which grows the therapeutics market. The research and development activities in the field like emerging novel therapeutics, increasing the efficacy of medicine as well as treatment.
Selling campaigns initiated by the global players is growing the market progressively. Increasing focus by government organizations and private agencies like WHO and pharmaceutical companies to create awareness of pleural effusions is fuelling the market growth. Thus, the market for Malignant Pleural Effusion is expected to register a CAGR of 6% in the forecast period 2023-2033.
Which are Some Prominent Drivers of the Malignant Pleural Effusion Market?
Increasing Incidence of Malignant Pleural Effusion disease post covid-19 pandemic to push the market growth
The increasing prevalence of Malignant Pleural Effusion disease is one of the biggest drivers of the market. After The covid-19 pandemic hit the world, various research was conducted to find a correlation between Covid-19 infection and pleural effusion.
For instance, the article “Prevalence and Clinical Outcomes of Pleural Effusion in Covid-19 Patients: A Systematic Review and Meta-Analysis” published in January 2022 showed that pleural effusion is related to the risk and prognosis of Covid-19 disease.
Pleural effusion can be used as a prognostic indicator to assess the likelihood of poorer outcomes in Covid-19 patients; as a result, the researchers of the above-mentioned research article advised that hospitalized Covid-19 patients with pleural effusion be handled promptly. Considering these in depth studies, the pandemic showed a considerable impact on the market studied.
Find your sweet spots for generating winning opportunities in this market.
Talk to AnalystWhat are the Challenges Faced by the Malignant Pleural Effusion Market?
Expensive Cost of Treatment to restrict Market Growth
The expensive treatment of Malignant Pleural Effusion, less awareness of Malignant Pleural Effusion disease, and insubstantial treatment options are hampering the market growth.
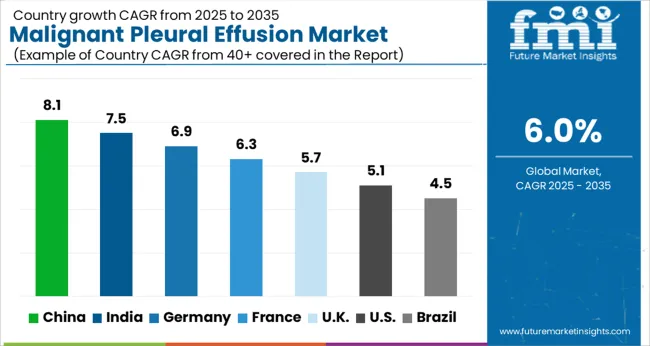
Region-Wise Insights
How is the Market for Malignant Pleural Effusion Turning Out in the Asia Pacific Region?
Improvement in healthcare spending propelling growth of Malignant Pleural Effusion in Asia Pacific
The Asia Pacific is expected to exhibit the fastest growth rate of all regions over the forecast period, with a CAGR of 5% during the forecast period. The growth is owed to increased awareness, significant increases in healthcare spending, and a rising frequency of malignant pleural effusion in the region.
Asia Pacific is an emerging market due to the increase in point of care approach to health & care. Increasing number of hospitals in India and China makes a promising market for Pleural effusions treatment market worldwide.
What are the Factors Boosting the Market for Malignant Pleural Effusion in North America?
High Prevalence of various diseases shaping landscape for Malignant Pleural Effusion in North America
North America is anticipated to acquire a market share of about 45% in the forecast period. This growth is attributable to the rising prevalence of pleural effusions in the region. An article published by WebMD LLC in October 2021 stated that approximately 1.5 million pleural effusions are diagnosed in the United States every year and in industrialized countries, the estimated prevalence of pleural effusion is 320 cases per 100,000 people.
This ever widening burden of the condition on the healthcare facilities is creating demand for the treatment globally, expected to fuel the market growth during the analysis period. Furthermore, the rising geriatric population is leading to an increase in the prevalence of various diseases, growing the health and economic burden.
As per the American Heart Association data updated in April 2022, nearly 115 million people have hypertension, 100 million have obesity, 92 million have prediabetes, 26 million have diabetes, and 125 million have atherosclerotic cardiovascular diseases (CVD) in the United States, which are known to be the risk factors for the development of heart failure. Thus, the high burden of various diseases creates the risk of pleural effusions among the target population in the United States.

A unified Market Research Subscription Platform, built for today's disparate research needs.
Start-Up in the Malignant Pleural Effusion Market
Key start-up players in the Malignant Pleural Effusion market are-
- SensoriumLab is a Polish company that offers a user-friendly and non-invasive diagnostic system for assessment of pleural effusion (water on lungs). The device makes it possible to monitor patients remotely, and the monitoring can even be handled by non-professionals.
- BIORIDIS is a biotech company founded in Bologna, Italy in 2016 that is working to reduce costs, increase productivity and improve technical performance in biomedical R&D and molecular diagnostics. The company’s objective is the development, production and marketing of innovative kits for nucleic acid (DNA, RNA) analysis for biomedical R&D and molecular diagnostics application, especially for small RNAs (e.g. microRNAs).
- BrainScan Sp. z o. o. is a Polish start-up using artificial intelligence to improve the efficiency of interpretations of Brain CT Scans. Company provides automatic search for similar computed tomography (CT) or magnetic resonance imaging (MRI) scans in large data sets. It searches for medical cases that are similar to a given scan or region of interest.
Market Competition
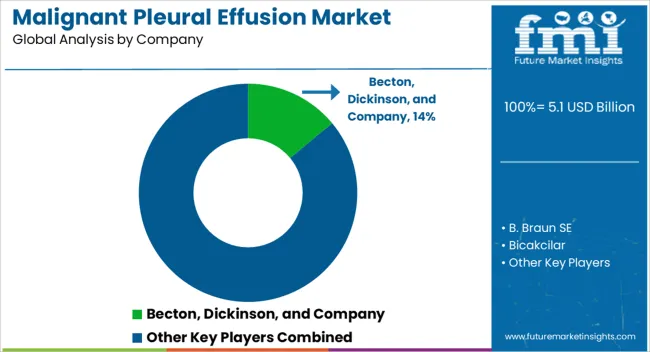
Key players in the Malignant Pleural Effusion market are Allakos, iCo Therapeutics, Akari Therapeutics, and Santen.
- In September 2021, BDR Pharma launched BIAPENEM to treat patients with intra-abdominal infections, lower respiratory infections, or complicated urinary tract infections. Biapenem is widely distributed and penetrates well into various tissues (e.g. lung tissue) and body fluids (e.g. sputum, pleural effusion, abdominal cavity fluid).
- In April 2022, the study titled “IFN-γ Combined with T Cells in the Treatment of Refractory Malignant Pleural Effusion and Ascites” was registered in ClinicalTrials.gov for Malignant Pleural Effusion.
Report Scope
Report Attribute |
Details |
Market Value in 2023 |
US$ 4.5 Billion |
Market Value in 2033 |
US$ 8.06 Billion |
Growth Rate |
CAGR of 6% from 2023 to 2033 |
Base Year for Estimation |
2022 |
Historical Data |
2018-2022 |
Forecast Period |
2023-2033 |
Quantitative Units |
Revenue in US$ Million and CAGR from 2023-2033 |
Report Coverage |
Revenue Forecast, Volume Forecast, Company Ranking, Competitive Landscape, Growth Factors, Trends and Pricing Analysis |
Segments Covered |
|
Regions Covered |
|
Key Countries Profiled |
|
Key Companies Profiled |
|
Customization |
Available Upon Request |
Key Segments Profiled in the Malignant Pleural Effusion Industry Survey
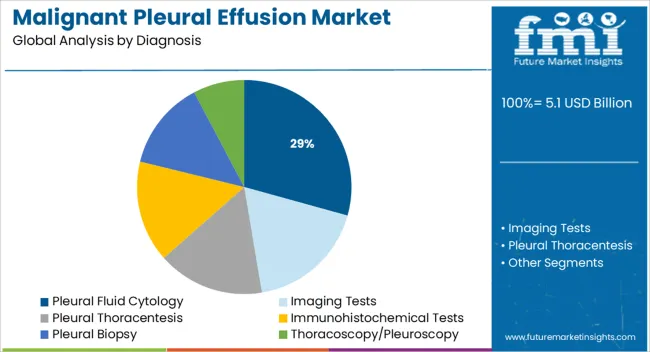
By Diagnosis:
- Imaging Tests
- Pleural Thoracentesis
- Pleural Fluid Cytology
- Immunohistochemical Tests
- Pleural Biopsy
- Thoracoscopy/Pleuroscopy
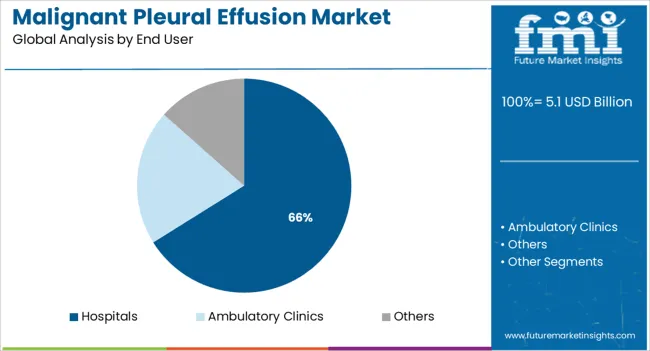
By End User:
- Hospitals
- Ambulatory Clinics
- Others
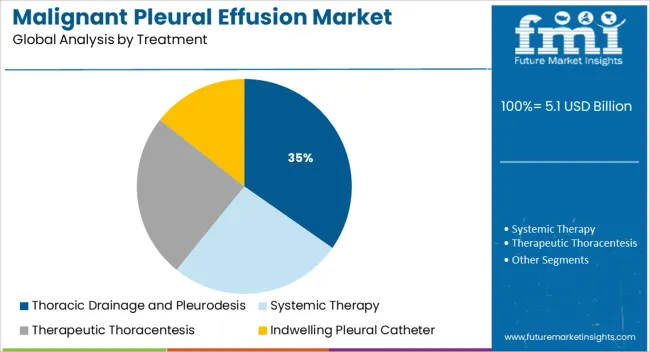
By Treatment:
- Systemic Therapy
- Therapeutic Thoracentesis
- Thoracic Drainage and Pleurodesis
- Indwelling Pleural Catheter
By Region:
- North America
- Latin America
- Western Europe
- Eastern Europe
- Asia Pacific
- MEA
Frequently Asked Questions
From 2017-2022, the Malignant Pleural Effusion market grew at CAGR of 4%.
The global Malignant Pleural Effusion market is expected to grow with a 6% CAGR during 2023-2033.
As of 2033, the Malignant Pleural Effusion market is expected to reach US$ 8.06 Billion
According to the FMI analysis, hospitals account for the largest market share.
North America is expected to possess 45% market share for the Malignant Pleural Effusion market.
The Asia Pacific market is predicted to increase significantly throughout the forecast period, with a CAGR of 5% during the forecast period.
Table of Content
1. Executive Summary
1.1. Global Market Outlook
1.2. Demand-side Trends
1.3. Supply-side Trends
1.4. Technology Roadmap Analysis
1.5. Analysis and Recommendations
2. Market Overview
2.1. Market Coverage / Taxonomy
2.2. Market Definition / Scope / Limitations
3. Market Background
3.1. Market Dynamics
3.1.1. Drivers
3.1.2. Restraints
3.1.3. Opportunity
3.1.4. Trends
3.2. Scenario Forecast
3.2.1. Demand in Optimistic Scenario
3.2.2. Demand in Likely Scenario
3.2.3. Demand in Conservative Scenario
3.3. Opportunity Map Analysis
3.4. Investment Feasibility Matrix
3.5. PESTLE and Porter’s Analysis
3.6. Regulatory Landscape
3.6.1. By Key Regions
3.6.2. By Key Countries
3.7. Regional Parent Market Outlook
4. Global Market Analysis 2018-2022 and Forecast, 2023-2033
4.1. Historical Market Size Value (US$ Mn) Analysis, 2018-2022
4.2. Current and Future Market Size Value (US$ Mn) Projections, 2023-2033
4.2.1. Y-o-Y Growth Trend Analysis
4.2.2. Absolute $ Opportunity Analysis
5. Global Market Analysis 2018-2022 and Forecast 2023-2033, By Diagnosis
5.1. Introduction / Key Findings
5.2. Historical Market Size Value (US$ Mn) Analysis By Diagnosis, 2018-2022
5.3. Current and Future Market Size Value (US$ Mn) Analysis and Forecast By Diagnosis, 2023-2033
5.3.1. Imaging Tests
5.3.2. Pleural Thoracocentesis
5.3.3. Pleural Fluid Cytology
5.3.4. Immunohistochemical Tests
5.3.5. Pleural Biopsy
5.3.6. Thoracoscopy/Pleuroscopy
5.4. Y-o-Y Growth Trend Analysis By Diagnosis, 2018-2022
5.5. Absolute $ Opportunity Analysis By Diagnosis, 2023-2033
6. Global Market Analysis 2018-2022 and Forecast 2023-2033, By Treatment
6.1. Introduction / Key Findings
6.2. Historical Market Size Value (US$ Mn) Analysis By Treatment, 2018-2022
6.3. Current and Future Market Size Value (US$ Mn) Analysis and Forecast By Treatment, 2023-2033
6.3.1. Systemic Therapy
6.3.2. Therapeutic Thoracentesis
6.3.3. Thoracic Drainage and Pleurodesis
6.3.4. Indwelling Pleural Catheter
6.4. Y-o-Y Growth Trend Analysis By Treatment, 2018-2022
6.5. Absolute $ Opportunity Analysis By Treatment, 2023-2033
7. Global Market Analysis 2018-2022 and Forecast 2023-2033, By End User
7.1. Introduction / Key Findings
7.2. Historical Market Size Value (US$ Mn) Analysis By End User , 2018-2022
7.3. Current and Future Market Size Value (US$ Mn) Analysis and Forecast By End User , 2023-2033
7.3.1. Hospitals
7.3.2. Ambulatory Clinics
7.3.3. Others
7.4. Y-o-Y Growth Trend Analysis By End User , 2018-2022
7.5. Absolute $ Opportunity Analysis By End User , 2023-2033
8. Global Market Analysis 2018-2022 and Forecast 2023-2033, By Region
8.1. Introduction
8.2. Historical Market Size Value (US$ Mn) Analysis By Region, 2018-2022
8.3. Current Market Size Value (US$ Mn) Analysis and Forecast By Region, 2023-2033
8.3.1. North America
8.3.2. Latin America
8.3.3. Western Europe
8.3.4. Eastern Europe
8.3.5. APAC
8.3.6. MEA
8.4. Market Attractiveness Analysis By Region
9. North America Market Analysis 2018-2022 and Forecast 2023-2033, By Country
9.1. Historical Market Size Value (US$ Mn) Trend Analysis By Market Taxonomy, 2018-2022
9.2. Market Size Value (US$ Mn) Forecast By Market Taxonomy, 2023-2033
9.2.1. By Country
9.2.1.1. U.S.
9.2.1.2. Canada
9.2.2. By Diagnosis
9.2.3. By Treatment
9.2.4. By End User
9.3. Market Attractiveness Analysis
9.3.1. By Country
9.3.2. By Diagnosis
9.3.3. By Treatment
9.3.4. By End User
9.4. Key Takeaways
10. Latin America Market Analysis 2018-2022 and Forecast 2023-2033, By Country
10.1. Historical Market Size Value (US$ Mn) Trend Analysis By Market Taxonomy, 2018-2022
10.2. Market Size Value (US$ Mn) Forecast By Market Taxonomy, 2023-2033
10.2.1. By Country
10.2.1.1. Brazil
10.2.1.2. Mexico
10.2.1.3. Rest of Latin America
10.2.2. By Diagnosis
10.2.3. By Treatment
10.2.4. By End User
10.3. Market Attractiveness Analysis
10.3.1. By Country
10.3.2. By Diagnosis
10.3.3. By Treatment
10.3.4. By End User
10.4. Key Takeaways
11. Western Europe Market Analysis 2018-2022 and Forecast 2023-2033, By Country
11.1. Historical Market Size Value (US$ Mn) Trend Analysis By Market Taxonomy, 2018-2022
11.2. Market Size Value (US$ Mn) Forecast By Market Taxonomy, 2023-2033
11.2.1. By Country
11.2.1.1. Benelux
11.2.1.2. France
11.2.1.3. Germany
11.2.1.4. Italy
11.2.1.5. Nordic
11.2.1.6. Spain
11.2.1.7. U.K.
11.2.1.8. Rest of Western Europe
11.2.2. By Diagnosis
11.2.3. By Treatment
11.2.4. By End User
11.3. Market Attractiveness Analysis
11.3.1. By Country
11.3.2. By Diagnosis
11.3.3. By Treatment
11.3.4. By End User
11.4. Key Takeaways
12. Eastern Europe Market Analysis 2018-2022 and Forecast 2023-2033, By Country
12.1. Historical Market Size Value (US$ Mn) Trend Analysis By Market Taxonomy, 2018-2022
12.2. Market Size Value (US$ Mn) Forecast By Market Taxonomy, 2023-2033
12.2.1. By Country
12.2.1.1. Poland
12.2.1.2. Russia
12.2.1.3. Rest of Eastern Europe
12.2.2. By Diagnosis
12.2.3. By Treatment
12.2.4. By End User
12.3. Market Attractiveness Analysis
12.3.1. By Country
12.3.2. By Diagnosis
12.3.3. By Treatment
12.3.4. By End User
12.4. Key Takeaways
13. APAC Market Analysis 2018-2022 and Forecast 2023-2033, By Country
13.1. Historical Market Size Value (US$ Mn) Trend Analysis By Market Taxonomy, 2018-2022
13.2. Market Size Value (US$ Mn) Forecast By Market Taxonomy, 2023-2033
13.2.1. By Country
13.2.1.1. India
13.2.1.2. Malaysia
13.2.1.3. Singapore
13.2.1.4. Thailand
13.2.1.5. Australia
13.2.1.6. New Zealand
13.2.1.7. Rest of APAC
13.2.2. By Diagnosis
13.2.3. By Treatment
13.2.4. By End User
13.3. Market Attractiveness Analysis
13.3.1. By Country
13.3.2. By Diagnosis
13.3.3. By Treatment
13.3.4. By End User
13.4. Key Takeaways
14. MEA Market Analysis 2018-2022 and Forecast 2023-2033, By Country
14.1. Historical Market Size Value (US$ Mn) Trend Analysis By Market Taxonomy, 2018-2022
14.2. Market Size Value (US$ Mn) Forecast By Market Taxonomy, 2023-2033
14.2.1. By Country
14.2.1.1. GCC Countries
14.2.1.2. South Africa
14.2.1.3. Israel
14.2.1.4. Rest of MEA
14.2.2. By Diagnosis
14.2.3. By Treatment
14.2.4. By End User
14.3. Market Attractiveness Analysis
14.3.1. By Country
14.3.2. By Diagnosis
14.3.3. By Treatment
14.3.4. By End User
14.4. Key Takeaways
15. Key Countries Market Analysis
15.1. U.S.
15.1.1. Pricing Analysis
15.1.2. Market Share Analysis, 2022
15.1.2.1. By Diagnosis
15.1.2.2. By Treatment
15.1.2.3. By End User
15.2. Canada
15.2.1. Pricing Analysis
15.2.2. Market Share Analysis, 2022
15.2.2.1. By Diagnosis
15.2.2.2. By Treatment
15.2.2.3. By End User
15.3. Brazil
15.3.1. Pricing Analysis
15.3.2. Market Share Analysis, 2022
15.3.2.1. By Diagnosis
15.3.2.2. By Treatment
15.3.2.3. By End User
15.4. Mexico
15.4.1. Pricing Analysis
15.4.2. Market Share Analysis, 2022
15.4.2.1. By Diagnosis
15.4.2.2. By Treatment
15.4.2.3. By End User
15.5. Benelux
15.5.1. Pricing Analysis
15.5.2. Market Share Analysis, 2022
15.5.2.1. By Diagnosis
15.5.2.2. By Treatment
15.5.2.3. By End User
15.6. France
15.6.1. Pricing Analysis
15.6.2. Market Share Analysis, 2022
15.6.2.1. By Diagnosis
15.6.2.2. By Treatment
15.6.2.3. By End User
15.7. Germany
15.7.1. Pricing Analysis
15.7.2. Market Share Analysis, 2022
15.7.2.1. By Diagnosis
15.7.2.2. By Treatment
15.7.2.3. By End User
15.8. Italy
15.8.1. Pricing Analysis
15.8.2. Market Share Analysis, 2022
15.8.2.1. By Diagnosis
15.8.2.2. By Treatment
15.8.2.3. By End User
15.9. Nordic
15.9.1. Pricing Analysis
15.9.2. Market Share Analysis, 2022
15.9.2.1. By Diagnosis
15.9.2.2. By Treatment
15.9.2.3. By End User
15.10. Spain
15.10.1. Pricing Analysis
15.10.2. Market Share Analysis, 2022
15.10.2.1. By Diagnosis
15.10.2.2. By Treatment
15.10.2.3. By End User
15.11. U.K.
15.11.1. Pricing Analysis
15.11.2. Market Share Analysis, 2022
15.11.2.1. By Diagnosis
15.11.2.2. By Treatment
15.11.2.3. By End User
15.12. Poland
15.12.1. Pricing Analysis
15.12.2. Market Share Analysis, 2022
15.12.2.1. By Diagnosis
15.12.2.2. By Treatment
15.12.2.3. By End User
15.13. Russia
15.13.1. Pricing Analysis
15.13.2. Market Share Analysis, 2022
15.13.2.1. By Diagnosis
15.13.2.2. By Treatment
15.13.2.3. By End User
15.14. India
15.14.1. Pricing Analysis
15.14.2. Market Share Analysis, 2022
15.14.2.1. By Diagnosis
15.14.2.2. By Treatment
15.14.2.3. By End User
15.15. Malaysia
15.15.1. Pricing Analysis
15.15.2. Market Share Analysis, 2022
15.15.2.1. By Diagnosis
15.15.2.2. By Treatment
15.15.2.3. By End User
15.16. Singapore
15.16.1. Pricing Analysis
15.16.2. Market Share Analysis, 2022
15.16.2.1. By Diagnosis
15.16.2.2. By Treatment
15.16.2.3. By End User
15.17. Thailand
15.17.1. Pricing Analysis
15.17.2. Market Share Analysis, 2022
15.17.2.1. By Diagnosis
15.17.2.2. By Treatment
15.17.2.3. By End User
15.18. Australia
15.18.1. Pricing Analysis
15.18.2. Market Share Analysis, 2022
15.18.2.1. By Diagnosis
15.18.2.2. By Treatment
15.18.2.3. By End User
15.19. New Zealand
15.19.1. Pricing Analysis
15.19.2. Market Share Analysis, 2022
15.19.2.1. By Diagnosis
15.19.2.2. By Treatment
15.19.2.3. By End User
15.20. GCC Countries
15.20.1. Pricing Analysis
15.20.2. Market Share Analysis, 2022
15.20.2.1. By Diagnosis
15.20.2.2. By Treatment
15.20.2.3. By End User
15.21. South Africa
15.21.1. Pricing Analysis
15.21.2. Market Share Analysis, 2022
15.21.2.1. By Diagnosis
15.21.2.2. By Treatment
15.21.2.3. By End User
15.22. Israel
15.22.1. Pricing Analysis
15.22.2. Market Share Analysis, 2022
15.22.2.1. By Diagnosis
15.22.2.2. By Treatment
15.22.2.3. By End User
16. Market Structure Analysis
16.1. Competition Dashboard
16.2. Competition Benchmarking
16.3. Market Share Analysis of Top Players
16.3.1. By Regional
16.3.2. By Diagnosis
16.3.3. By Treatment
16.3.4. By End User
17. Competition Analysis
17.1. Competition Deep Dive
17.1.1. B. Braun SE
17.1.1.1. Overview
17.1.1.2. Product Portfolio
17.1.1.3. Profitability by Market Segments
17.1.1.4. Sales Footprint
17.1.1.5. Strategy Overview
17.1.1.5.1. Marketing Strategy
17.1.2. Becton, Dickinson and Company
17.1.2.1. Overview
17.1.2.2. Product Portfolio
17.1.2.3. Profitability by Market Segments
17.1.2.4. Sales Footprint
17.1.2.5. Strategy Overview
17.1.2.5.1. Marketing Strategy
17.1.3. Bicakcilar
17.1.3.1. Overview
17.1.3.2. Product Portfolio
17.1.3.3. Profitability by Market Segments
17.1.3.4. Sales Footprint
17.1.3.5. Strategy Overview
17.1.3.5.1. Marketing Strategy
17.1.4. Biometrix
17.1.4.1. Overview
17.1.4.2. Product Portfolio
17.1.4.3. Profitability by Market Segments
17.1.4.4. Sales Footprint
17.1.4.5. Strategy Overview
17.1.4.5.1. Marketing Strategy
17.1.5. Cook Medical
17.1.5.1. Overview
17.1.5.2. Product Portfolio
17.1.5.3. Profitability by Market Segments
17.1.5.4. Sales Footprint
17.1.5.5. Strategy Overview
17.1.5.5.1. Marketing Strategy
17.1.6. Grena
17.1.6.1. Overview
17.1.6.2. Product Portfolio
17.1.6.3. Profitability by Market Segments
17.1.6.4. Sales Footprint
17.1.6.5. Strategy Overview
17.1.6.5.1. Marketing Strategy
17.1.7. Redax
17.1.7.1. Overview
17.1.7.2. Product Portfolio
17.1.7.3. Profitability by Market Segments
17.1.7.4. Sales Footprint
17.1.7.5. Strategy Overview
17.1.7.5.1. Marketing Strategy
17.1.8. Rocket Medical
17.1.8.1. Overview
17.1.8.2. Product Portfolio
17.1.8.3. Profitability by Market Segments
17.1.8.4. Sales Footprint
17.1.8.5. Strategy Overview
17.1.8.5.1. Marketing Strategy
17.1.9. Smith Medical
17.1.9.1. Overview
17.1.9.2. Product Portfolio
17.1.9.3. Profitability by Market Segments
17.1.9.4. Sales Footprint
17.1.9.5. Strategy Overview
17.1.9.5.1. Marketing Strategy
17.1.10. Taiho Pharmaceutical Co., Ltd
17.1.10.1. Overview
17.1.10.2. Product Portfolio
17.1.10.3. Profitability by Market Segments
17.1.10.4. Sales Footprint
17.1.10.5. Strategy Overview
17.1.10.5.1. Marketing Strategy
18. Assumptions & Acronyms Used
19. Research Methodology
Let us know your requirement to get
100% FREE customization
List of Tables
Table 1: Global Market Value (US$ Mn) Forecast by Region, 2018-2033
Table 2: Global Market Value (US$ Mn) Forecast by Diagnosis, 2018-2033
Table 3: Global Market Value (US$ Mn) Forecast by Treatment, 2018-2033
Table 4: Global Market Value (US$ Mn) Forecast by End User , 2018-2033
Table 5: North America Market Value (US$ Mn) Forecast by Country, 2018-2033
Table 6: North America Market Value (US$ Mn) Forecast by Diagnosis, 2018-2033
Table 7: North America Market Value (US$ Mn) Forecast by Treatment, 2018-2033
Table 8: North America Market Value (US$ Mn) Forecast by End User , 2018-2033
Table 9: Latin America Market Value (US$ Mn) Forecast by Country, 2018-2033
Table 10: Latin America Market Value (US$ Mn) Forecast by Diagnosis, 2018-2033
Table 11: Latin America Market Value (US$ Mn) Forecast by Treatment, 2018-2033
Table 12: Latin America Market Value (US$ Mn) Forecast by End User , 2018-2033
Table 13: Western Europe Market Value (US$ Mn) Forecast by Country, 2018-2033
Table 14: Western Europe Market Value (US$ Mn) Forecast by Diagnosis, 2018-2033
Table 15: Western Europe Market Value (US$ Mn) Forecast by Treatment, 2018-2033
Table 16: Western Europe Market Value (US$ Mn) Forecast by End User , 2018-2033
Table 17: Eastern Europe Market Value (US$ Mn) Forecast by Country, 2018-2033
Table 18: Eastern Europe Market Value (US$ Mn) Forecast by Diagnosis, 2018-2033
Table 19: Eastern Europe Market Value (US$ Mn) Forecast by Treatment, 2018-2033
Table 20: Eastern Europe Market Value (US$ Mn) Forecast by End User , 2018-2033
Table 21: APAC Market Value (US$ Mn) Forecast by Country, 2018-2033
Table 22: APAC Market Value (US$ Mn) Forecast by Diagnosis, 2018-2033
Table 23: APAC Market Value (US$ Mn) Forecast by Treatment, 2018-2033
Table 24: APAC Market Value (US$ Mn) Forecast by End User , 2018-2033
Table 25: MEA Market Value (US$ Mn) Forecast by Country, 2018-2033
Table 26: MEA Market Value (US$ Mn) Forecast by Diagnosis, 2018-2033
Table 27: MEA Market Value (US$ Mn) Forecast by Treatment, 2018-2033
Table 28: MEA Market Value (US$ Mn) Forecast by End User , 2018-2033
Find your sweet spots for generating winning opportunities in this market.
Talk to AnalystList of Charts
Figure 1: Global Market Value (US$ Mn) by Diagnosis, 2023-2033
Figure 2: Global Market Value (US$ Mn) by Treatment, 2023-2033
Figure 3: Global Market Value (US$ Mn) by End User , 2023-2033
Figure 4: Global Market Value (US$ Mn) by Region, 2023-2033
Figure 5: Global Market Value (US$ Mn) Analysis by Region, 2018-2033
Figure 6: Global Market Value Share (%) and BPS Analysis by Region, 2023-2033
Figure 7: Global Market Y-o-Y Growth (%) Projections by Region, 2023-2033
Figure 8: Global Market Value (US$ Mn) Analysis by Diagnosis, 2018-2033
Figure 9: Global Market Value Share (%) and BPS Analysis by Diagnosis, 2023-2033
Figure 10: Global Market Y-o-Y Growth (%) Projections by Diagnosis, 2023-2033
Figure 11: Global Market Value (US$ Mn) Analysis by Treatment, 2018-2033
Figure 12: Global Market Value Share (%) and BPS Analysis by Treatment, 2023-2033
Figure 13: Global Market Y-o-Y Growth (%) Projections by Treatment, 2023-2033
Figure 14: Global Market Value (US$ Mn) Analysis by End User , 2018-2033
Figure 15: Global Market Value Share (%) and BPS Analysis by End User , 2023-2033
Figure 16: Global Market Y-o-Y Growth (%) Projections by End User , 2023-2033
Figure 17: Global Market Attractiveness by Diagnosis, 2023-2033
Figure 18: Global Market Attractiveness by Treatment, 2023-2033
Figure 19: Global Market Attractiveness by End User , 2023-2033
Figure 20: Global Market Attractiveness by Region, 2023-2033
Figure 21: North America Market Value (US$ Mn) by Diagnosis, 2023-2033
Figure 22: North America Market Value (US$ Mn) by Treatment, 2023-2033
Figure 23: North America Market Value (US$ Mn) by End User , 2023-2033
Figure 24: North America Market Value (US$ Mn) by Country, 2023-2033
Figure 25: North America Market Value (US$ Mn) Analysis by Country, 2018-2033
Figure 26: North America Market Value Share (%) and BPS Analysis by Country, 2023-2033
Figure 27: North America Market Y-o-Y Growth (%) Projections by Country, 2023-2033
Figure 28: North America Market Value (US$ Mn) Analysis by Diagnosis, 2018-2033
Figure 29: North America Market Value Share (%) and BPS Analysis by Diagnosis, 2023-2033
Figure 30: North America Market Y-o-Y Growth (%) Projections by Diagnosis, 2023-2033
Figure 31: North America Market Value (US$ Mn) Analysis by Treatment, 2018-2033
Figure 32: North America Market Value Share (%) and BPS Analysis by Treatment, 2023-2033
Figure 33: North America Market Y-o-Y Growth (%) Projections by Treatment, 2023-2033
Figure 34: North America Market Value (US$ Mn) Analysis by End User , 2018-2033
Figure 35: North America Market Value Share (%) and BPS Analysis by End User , 2023-2033
Figure 36: North America Market Y-o-Y Growth (%) Projections by End User , 2023-2033
Figure 37: North America Market Attractiveness by Diagnosis, 2023-2033
Figure 38: North America Market Attractiveness by Treatment, 2023-2033
Figure 39: North America Market Attractiveness by End User , 2023-2033
Figure 40: North America Market Attractiveness by Country, 2023-2033
Figure 41: Latin America Market Value (US$ Mn) by Diagnosis, 2023-2033
Figure 42: Latin America Market Value (US$ Mn) by Treatment, 2023-2033
Figure 43: Latin America Market Value (US$ Mn) by End User , 2023-2033
Figure 44: Latin America Market Value (US$ Mn) by Country, 2023-2033
Figure 45: Latin America Market Value (US$ Mn) Analysis by Country, 2018-2033
Figure 46: Latin America Market Value Share (%) and BPS Analysis by Country, 2023-2033
Figure 47: Latin America Market Y-o-Y Growth (%) Projections by Country, 2023-2033
Figure 48: Latin America Market Value (US$ Mn) Analysis by Diagnosis, 2018-2033
Figure 49: Latin America Market Value Share (%) and BPS Analysis by Diagnosis, 2023-2033
Figure 50: Latin America Market Y-o-Y Growth (%) Projections by Diagnosis, 2023-2033
Figure 51: Latin America Market Value (US$ Mn) Analysis by Treatment, 2018-2033
Figure 52: Latin America Market Value Share (%) and BPS Analysis by Treatment, 2023-2033
Figure 53: Latin America Market Y-o-Y Growth (%) Projections by Treatment, 2023-2033
Figure 54: Latin America Market Value (US$ Mn) Analysis by End User , 2018-2033
Figure 55: Latin America Market Value Share (%) and BPS Analysis by End User , 2023-2033
Figure 56: Latin America Market Y-o-Y Growth (%) Projections by End User , 2023-2033
Figure 57: Latin America Market Attractiveness by Diagnosis, 2023-2033
Figure 58: Latin America Market Attractiveness by Treatment, 2023-2033
Figure 59: Latin America Market Attractiveness by End User , 2023-2033
Figure 60: Latin America Market Attractiveness by Country, 2023-2033
Figure 61: Western Europe Market Value (US$ Mn) by Diagnosis, 2023-2033
Figure 62: Western Europe Market Value (US$ Mn) by Treatment, 2023-2033
Figure 63: Western Europe Market Value (US$ Mn) by End User , 2023-2033
Figure 64: Western Europe Market Value (US$ Mn) by Country, 2023-2033
Figure 65: Western Europe Market Value (US$ Mn) Analysis by Country, 2018-2033
Figure 66: Western Europe Market Value Share (%) and BPS Analysis by Country, 2023-2033
Figure 67: Western Europe Market Y-o-Y Growth (%) Projections by Country, 2023-2033
Figure 68: Western Europe Market Value (US$ Mn) Analysis by Diagnosis, 2018-2033
Figure 69: Western Europe Market Value Share (%) and BPS Analysis by Diagnosis, 2023-2033
Figure 70: Western Europe Market Y-o-Y Growth (%) Projections by Diagnosis, 2023-2033
Figure 71: Western Europe Market Value (US$ Mn) Analysis by Treatment, 2018-2033
Figure 72: Western Europe Market Value Share (%) and BPS Analysis by Treatment, 2023-2033
Figure 73: Western Europe Market Y-o-Y Growth (%) Projections by Treatment, 2023-2033
Figure 74: Western Europe Market Value (US$ Mn) Analysis by End User , 2018-2033
Figure 75: Western Europe Market Value Share (%) and BPS Analysis by End User , 2023-2033
Figure 76: Western Europe Market Y-o-Y Growth (%) Projections by End User , 2023-2033
Figure 77: Western Europe Market Attractiveness by Diagnosis, 2023-2033
Figure 78: Western Europe Market Attractiveness by Treatment, 2023-2033
Figure 79: Western Europe Market Attractiveness by End User , 2023-2033
Figure 80: Western Europe Market Attractiveness by Country, 2023-2033
Figure 81: Eastern Europe Market Value (US$ Mn) by Diagnosis, 2023-2033
Figure 82: Eastern Europe Market Value (US$ Mn) by Treatment, 2023-2033
Figure 83: Eastern Europe Market Value (US$ Mn) by End User , 2023-2033
Figure 84: Eastern Europe Market Value (US$ Mn) by Country, 2023-2033
Figure 85: Eastern Europe Market Value (US$ Mn) Analysis by Country, 2018-2033
Figure 86: Eastern Europe Market Value Share (%) and BPS Analysis by Country, 2023-2033
Figure 87: Eastern Europe Market Y-o-Y Growth (%) Projections by Country, 2023-2033
Figure 88: Eastern Europe Market Value (US$ Mn) Analysis by Diagnosis, 2018-2033
Figure 89: Eastern Europe Market Value Share (%) and BPS Analysis by Diagnosis, 2023-2033
Figure 90: Eastern Europe Market Y-o-Y Growth (%) Projections by Diagnosis, 2023-2033
Figure 91: Eastern Europe Market Value (US$ Mn) Analysis by Treatment, 2018-2033
Figure 92: Eastern Europe Market Value Share (%) and BPS Analysis by Treatment, 2023-2033
Figure 93: Eastern Europe Market Y-o-Y Growth (%) Projections by Treatment, 2023-2033
Figure 94: Eastern Europe Market Value (US$ Mn) Analysis by End User , 2018-2033
Figure 95: Eastern Europe Market Value Share (%) and BPS Analysis by End User , 2023-2033
Figure 96: Eastern Europe Market Y-o-Y Growth (%) Projections by End User , 2023-2033
Figure 97: Eastern Europe Market Attractiveness by Diagnosis, 2023-2033
Figure 98: Eastern Europe Market Attractiveness by Treatment, 2023-2033
Figure 99: Eastern Europe Market Attractiveness by End User , 2023-2033
Figure 100: Eastern Europe Market Attractiveness by Country, 2023-2033
Figure 101: APAC Market Value (US$ Mn) by Diagnosis, 2023-2033
Figure 102: APAC Market Value (US$ Mn) by Treatment, 2023-2033
Figure 103: APAC Market Value (US$ Mn) by End User , 2023-2033
Figure 104: APAC Market Value (US$ Mn) by Country, 2023-2033
Figure 105: APAC Market Value (US$ Mn) Analysis by Country, 2018-2033
Figure 106: APAC Market Value Share (%) and BPS Analysis by Country, 2023-2033
Figure 107: APAC Market Y-o-Y Growth (%) Projections by Country, 2023-2033
Figure 108: APAC Market Value (US$ Mn) Analysis by Diagnosis, 2018-2033
Figure 109: APAC Market Value Share (%) and BPS Analysis by Diagnosis, 2023-2033
Figure 110: APAC Market Y-o-Y Growth (%) Projections by Diagnosis, 2023-2033
Figure 111: APAC Market Value (US$ Mn) Analysis by Treatment, 2018-2033
Figure 112: APAC Market Value Share (%) and BPS Analysis by Treatment, 2023-2033
Figure 113: APAC Market Y-o-Y Growth (%) Projections by Treatment, 2023-2033
Figure 114: APAC Market Value (US$ Mn) Analysis by End User , 2018-2033
Figure 115: APAC Market Value Share (%) and BPS Analysis by End User , 2023-2033
Figure 116: APAC Market Y-o-Y Growth (%) Projections by End User , 2023-2033
Figure 117: APAC Market Attractiveness by Diagnosis, 2023-2033
Figure 118: APAC Market Attractiveness by Treatment, 2023-2033
Figure 119: APAC Market Attractiveness by End User , 2023-2033
Figure 120: APAC Market Attractiveness by Country, 2023-2033
Figure 121: MEA Market Value (US$ Mn) by Diagnosis, 2023-2033
Figure 122: MEA Market Value (US$ Mn) by Treatment, 2023-2033
Figure 123: MEA Market Value (US$ Mn) by End User , 2023-2033
Figure 124: MEA Market Value (US$ Mn) by Country, 2023-2033
Figure 125: MEA Market Value (US$ Mn) Analysis by Country, 2018-2033
Figure 126: MEA Market Value Share (%) and BPS Analysis by Country, 2023-2033
Figure 127: MEA Market Y-o-Y Growth (%) Projections by Country, 2023-2033
Figure 128: MEA Market Value (US$ Mn) Analysis by Diagnosis, 2018-2033
Figure 129: MEA Market Value Share (%) and BPS Analysis by Diagnosis, 2023-2033
Figure 130: MEA Market Y-o-Y Growth (%) Projections by Diagnosis, 2023-2033
Figure 131: MEA Market Value (US$ Mn) Analysis by Treatment, 2018-2033
Figure 132: MEA Market Value Share (%) and BPS Analysis by Treatment, 2023-2033
Figure 133: MEA Market Y-o-Y Growth (%) Projections by Treatment, 2023-2033
Figure 134: MEA Market Value (US$ Mn) Analysis by End User , 2018-2033
Figure 135: MEA Market Value Share (%) and BPS Analysis by End User , 2023-2033
Figure 136: MEA Market Y-o-Y Growth (%) Projections by End User , 2023-2033
Figure 137: MEA Market Attractiveness by Diagnosis, 2023-2033
Figure 138: MEA Market Attractiveness by Treatment, 2023-2033
Figure 139: MEA Market Attractiveness by End User , 2023-2033
Figure 140: MEA Market Attractiveness by Country, 2023-2033
Need specific information?
Request CustomizationExplore Healthcare Insights
View Reports