Neural Processors Market Size, Share & Forecast 2025 to 2035

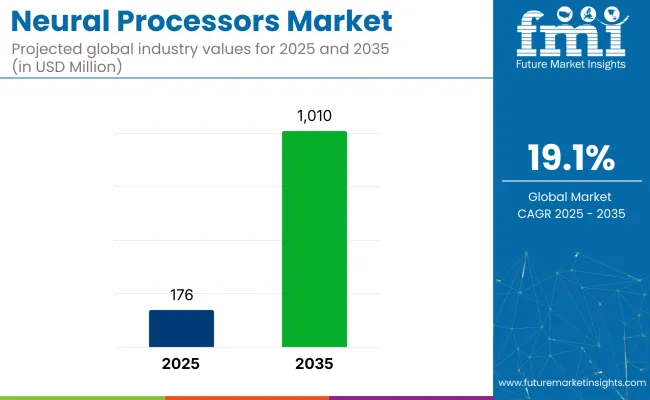
The global neural processors market is projected to increase from USD 176 million in 2025 to USD 1,010 million by 2035, registering a strong CAGR of 19.1%. This surge is being driven by the rising integration of dedicated AI hardware in smartphones, wearables, tablets, smart TVs, autonomous vehicles, and edge computing devices.
Quick Stats of the Neural Processors Market

  • Industry Value (2025): USD 176 million
  • Industry Forecast Value (2035): USD 1,010 million
  • Forecast CAGR: 19.1%
  • Leading Segment in 2035: Inference Operations (67% share)
  • Key Growth Region: America (United States)
  • Key Players: NVIDIA Corporation, Intel Corporation, Google (TPU), IBM Corporation, and Qualcomm Inc.

Neural Processors Market

Neural processing units (NPUs) are being used to accelerate machine learning inference tasks on-device, reducing latency, boosting power efficiency, and enhancing privacy by minimizing cloud dependency.

In a March 2025 interview with DIGITIMES, Amir Panush, CEO of Ceva, highlighted the company’s strategic focus on edge AI, stating, “Edge AI presents significant industry opportunities and will be a key growth engine for Ceva in the coming years.” This underscores Ceva’s commitment to advancing its neural processor technologies, emphasizing the growing importance of real-time AI applications at the edge for the company’s future growth and success.

The industry holds a specialized share within its parent markets. In the semiconductor market, it accounts for approximately 1-2%, as these processors are a niche segment of the broader semiconductor industry. Within the artificial intelligence (AI) market, the share is around 5-7%, driven by their critical role in accelerating AI computations.

In the machine learning market, the processors represent about 4-6%, as they are essential for running machine learning models efficiently. Within the edge computing market, the share is approximately 3-5%, as neural processors are used for real-time, on-device processing. In the consumer electronics market, their share is around 2-3%, with increasing adoption in devices like smartphones and smart speakers for AI-powered functionalities.

Analyzing Neural Processors Market by Top Investment Segments

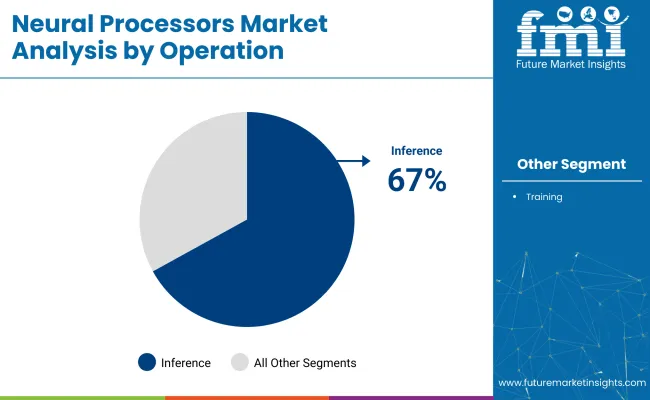
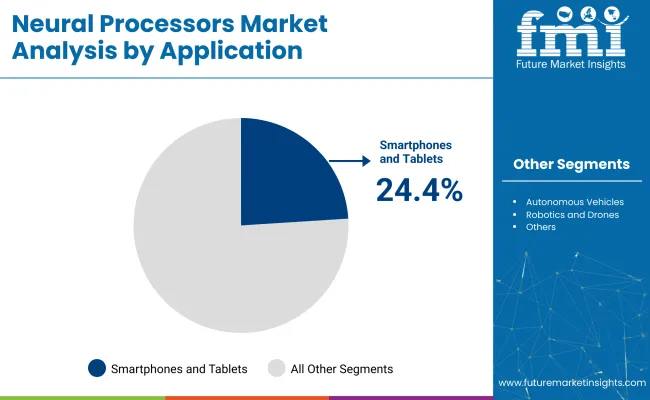
The industry is projected to grow, driven by inference-focused NPUs for edge AI and device-level intelligence. Inference operations will dominate with 67% industry share in 2025, while smartphones and tablets will lead the application segment with 24.4% industry share.

Inference operations dominate neural processor workloads with 67% share in 2025

Inference operations are expected to account for 67% of the neural processor industry in 2025, driven by the growing need for efficient AI model deployment at the edge. These tasks, such as facial recognition, speech-to-text, and noise suppression, are increasingly executed on-device to enhance privacy and reduce latency, eliminating the need for cloud infrastructure.

Chipmakers like NVIDIA, Qualcomm, and Intel are focusing on designing NPUs specialized for low-power inference applications across consumer and industrial sectors. For instance, Arm’s Ethos-U65 microNPU delivers sub-milliwatt AI performance for IoT endpoints, expanding edge deployment in smart cities and wearables. Cloud interoperability enables local inference while syncing with centralized models, solidifying inference as a core component of NPU design strategies.
  • Inference tasks executed on-device to enhance privacy and reduce latency
  • Leading chipmakers focusing on low-power NPUs for consumer and industrial applications
  • Cloud interoperability enables local inference while syncing with centralized models

Neural Processors Market Analysis By Operation

Smartphones and tablets remain the leading application segment with 24.4% share in 2025

Smartphones and tablets are projected to capture 24.4% of the industry in 2025, with growing integration of NPUs to power AI-driven features. These devices leverage NPUs for applications such as real-time language processing, intelligent photography, and device customization.

For example, Google’s Tensor G3 chip introduced in 2024 brought a triple-core TPU to Pixel smartphones, enhancing language processing and generative image editing. Major players like Apple, Samsung, and Xiaomi are continuously improving NPU performance with each hardware cycle.

According to Counterpoint Research, 89% of smartphones released in Q1 2025 are expected to include dedicated AI hardware, highlighting the increasing reliance on NPUs in mobile platforms. Tablets used for education and productivity also benefit from NPUs for enhanced UI responsiveness and offline AI capabilities.
  • NPUs drive real-time language processing and intelligent photography features
  • Increasing reliance on AI hardware in smartphones, with 89% adoption in 2025
  • Tablets leveraging NPUs for enhanced UI and offline AI capabilities

Neural Processors Market Analysis By Application

Top Neural Processors Market Dynamics

The neural processors market is expanding due to the growing demand for edge AI and on-device intelligence, especially in industries like smartphones and automotive. However, high development costs, architectural fragmentation, and geopolitical tensions are limiting industry scalability, particularly for new entrants and general-purpose devices.

Edge AI Growth and On-Device Intelligence are Fueling Neural Processor Adoption

The demand for neural processors is growing rapidly due to the increasing need for on-device artificial intelligence (AI) across industries like smartphones, automotive, healthcare, and consumer electronics. Edge computing is replacing cloud-based AI, enabling faster, real-time processing and enhanced privacy.

Neural Processing Units (NPUs) are integrated into chipsets to support features such as face unlock, voice recognition, predictive maintenance, and autonomous navigation. Companies like Apple, Google, and Huawei are leading innovations, and as 5G and IoT ecosystems mature, neural processors are becoming essential for seamless, low-latency AI applications.

  • The rise of edge computing and on-device AI is driving neural processor adoption.
  • NPUs enable real-time processing for applications like face unlock, voice recognition, and autonomous navigation.
  • 5G and IoT advancements are positioning neural processors as key enablers of low-latency, cloud-independent AI.

High Barriers to Entry and Architectural Fragmentation Limit Industry Scalability

Despite strong demand, the industry faces significant barriers to scalability due to high development costs and architectural fragmentation. Designing NPUs requires specialized knowledge of chip architecture and deep learning, which is concentrated in leading semiconductor firms. Startups struggle with the high cost of custom chip development and lack of standardized software frameworks.

Moreover, the industry’s fragmentation into different use cases-such as training versus inference-creates compatibility issues, slowing adoption. Geopolitical tensions, including export restrictions on advanced chips, further limit industry access.
  • The high cost of custom chip development and lack of standardized frameworks limit entry for new players.
  • Industry fragmentation into different processor types hinders broad adoption across general-purpose devices.
  • Geopolitical tensions, particularly USA export restrictions, are limiting access to advanced AI hardware in key regions.

Analyzing Top Countries Formulating, Distributing, and Supplying Neural Processors

Country Wise Analysis Of Neural Processors Market Cagr 2025 To 2035

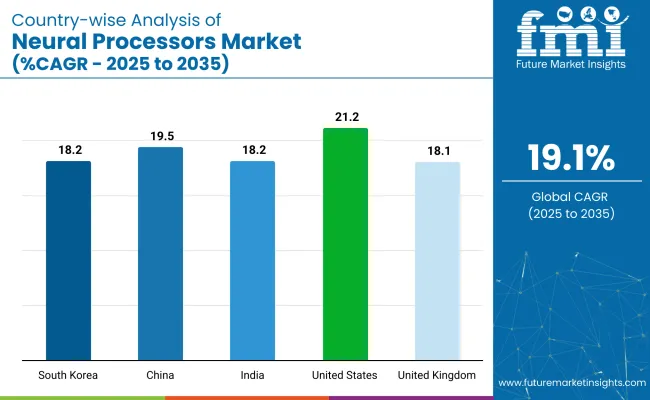
Countries CAGR (2025-2035)
United States 21.2%
China 19.5%
India 18.2%
South Korea 18.2%
United Kingdom 18.1%

The industry demand is projected to rise at a 19.1% CAGR from 2025 to 2035. Of the five profiled countries out of 40 covered, the United States leads at 21.2%, followed by China at 19.5% and India, South Korea, and the United Kingdom all at 18.2% or 18.1%. These rates translate to a growth premium of +11% for the United States, +2% for China, and -5% for India, South Korea, and the United Kingdom versus the baseline.

Divergence reflects local catalysts: strong investment in AI and machine learning technologies in the United States, rapid adoption of neural processors in China, and an increasing focus on AI research and development in India, South Korea, and the UK

Growth Analysis of Neural Processors Market in the United States

The industry in the United States is set to record a CAGR of 21.2% through 2035. Expansion is being powered by national leadership in AI algorithm development, domestic semiconductor capacity, and robust demand from defense, healthcare, and automotive AI applications.

Firms such as NVIDIA, AMD, Intel, and Google are commercializing NPUs for large language models, edge inference, and cloud AI workloads. Federal support through the CHIPS Act and AI R&D grants is sustaining innovation at both fabless and integrated device manufacturers. Integration of NPUs into autonomous navigation, surgical robotics, and smart defense platforms reinforces the USA lead in high-performance neural compute.

  • Defense programs are adopting embedded NPUs for vision-based targeting and swarm coordination.
  • Cloud hyperscalers are deploying custom inference chips optimized for LLM efficiency.
  • Public-private AI research labs are co-developing neural architectures for edge healthcare.

Future Outlook for Neural Processors Market in the United Kingdom

Sales of neural processors in the United Kingdom are projected to grow at a CAGR of 18.1% through 2035. Growth is anchored in chip-level AI innovation from startups and academic spinouts. Graphcore and Arm are advancing inference-first designs with high energy efficiency and dynamic workload adaptation.

The UK AI Strategy is channeling funding into compute hardware R&D, with Cambridge and Oxford leading processor architecture studies. NPUs are gaining adoption across NHS digital health pilots, financial algorithmic risk systems, and MOD AI readiness programs. The UK maintains a stronghold in Europe for custom AI silicon and low-latency edge chip deployment.

  • Defense simulation systems now incorporate British-designed NPUs for multi-modal data fusion.
  • University tech-transfer offices are licensing neuromorphic processor IP to startup fabs.
  • NHS trials include embedded AI chips in portable diagnostic imaging systems.

Demand Forecast for Neural Processors Market in China

Demand for neural processors in China is estimated to grow at a CAGR of 19.5% through 2035. Domestic chipmakers are scaling AI accelerators for robotics, surveillance, and autonomous logistics under national tech self-reliance policies. Cambricon, Huawei, and Alibaba are releasing chipsets tailored for AI inference workloads integrated with 5G and cloud platforms.

Fabrication capacity is expanding under MIIT guidelines, while local startups are developing NPU IP optimized for language processing, smart city infrastructure, and real-time video analytics. China is positioned as a volume producer and strategic user of AI compute solutions.

  • AI cloud service providers are deploying multi-node clusters of domestic NPUs for GenAI applications.
  • Surveillance infrastructure mandates include facial recognition NPUs for urban security grids.
  • Language translation and virtual assistant chips are embedded into national edtech platforms.

Analysis of Neural Processors Market in India

The industry in India is projected to grow at a CAGR of 18.2% through 2035. Edge AI adoption across finance, mobility, and agriculture is spurring demand for lightweight neural chips. Indian IT firms and startups are collaborating with global silicon providers to localize low-power inference accelerators.

Government-backed semiconductor programs and the India AI Mission are prioritizing regional chip design and embedded AI training platforms. Use cases span from speech recognition in local languages to medical image analysis in rural health programs. With policy support and rising R&D depth, India is becoming a regional base for affordable, scalable NPU production.

  • India Semiconductor Mission supports chip layout design centers for AI training hardware.
  • Fintech firms are deploying NPUs in secure biometric validation devices.
  • Agri-tech drones equipped with edge NPUs perform crop health diagnostics in real time.

Neural Processors Market Growth Outlook in South Korea

Sales of neural processors in South Korea are forecasted to grow at a CAGR of 18.2% through 2035. Major electronics players are embedding AI accelerators into consumer, automotive, and wearable platforms. Samsung and SK hynix are developing NPU-integrated SoCs with compute-memory fusion, enhancing real-time inference in smartphones and XR devices.

Government R&D support and digital export targets are expanding AI chip deployment in gaming, surveillance, and EV ecosystems. South Korea’s role in producing CE-certified smart semiconductors is growing, with export volumes rising in Asia and the EU.
  • Memory-NPU fusion chips are being scaled for mobile and IoT device manufacturers.
  • Smart factory controllers are integrating neural chips for visual inspection automation.
  • EV dashboards include neural processors for driver behavior modeling and fatigue detection.

Leading Neural Processor Suppliers

Neural Processors Market Analysis By Company

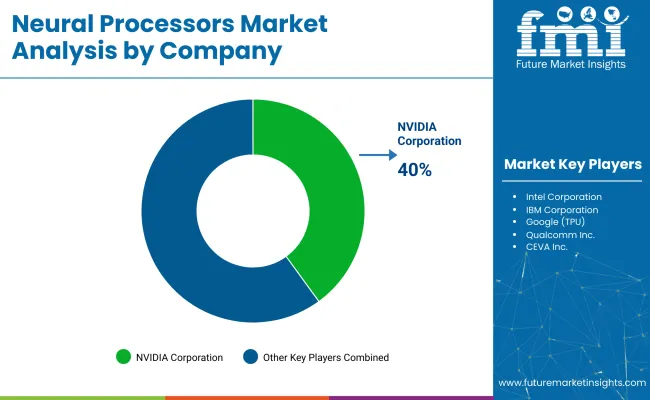
The global industry features a competitive landscape with dominant players, key players, and emerging players. Dominant players such as NVIDIA Corporation, Intel Corporation, and Google LLC lead the industry with extensive product portfolios, strong R&D capabilities, and robust distribution networks across AI, machine learning, and data center sectors.

Key players including IBM Corporation, Qualcomm Inc., and CEVA Inc. offer specialized solutions tailored to specific applications and regional industries. Emerging players, such as BrainChip Holdings Ltd., Graphcore Limited, and Teradeep Inc., focus on innovative technologies and cost-effective solutions, expanding their presence in the global industry.

Recent Neural Processor Industry News

  • In April 2023, AMD introduced its XDNA NPU microarchitecture, utilized in Ryzen AI and Alveo FPGAs. The new design emphasizes advancements in PC and edge inferencing, aiming to enhance performance in AI-driven applications and improve overall computational efficiency.
  • In April 2025, Google launched its TPU v7 “Ironwood,” featuring 256-chip clusters capable of delivering up to 4,614 TFLOP/s, nearly five times the performance of TPU v6. This advancement significantly boosts AI processing speeds for cloud-based and edge applications.
  • Between April and May 2025, Cerebras set new performance records with the deployment of its latest data centers. The company powered Meta’s LLaMA API and launched the Qwen3 model, delivering massive inference throughput for advanced AI applications.

Report Scope - Neural Processors Market

Report Attributes Details
Industry Size (2025) USD 176 million
Projected Industry Size (2035) USD 1,010 million
CAGR (2025 to 2035) 19.1%
Base Year for Estimation 2024
Historical Period 2020 to 2024
Projections Period 2025 to 2035
Quantitative Units USD million for value, units for volume
Operation Outlook (Segment 1) Training, Inference
Application Outlook (Segment 2) Smartphones and Tablets, Autonomous Vehicles, Robotics and Drones, Healthcare and Medical Devices, Smart Home Devices and IoT, Cloud and Data Center AI, Industrial Automation, Others
Regions Covered North America, Europe, Asia Pacific, Latin America, Middle East & Africa
Countries Covered United States, Canada, Mexico, United Kingdom, Germany, France, China, Japan, India, South Korea, Australia, Brazil, Saudi Arabia, United Arab Emirates, South Africa
Key Players influencing the Industry Intel Corporation, IBM Corporation, Google (TPU), Qualcomm Inc., CEVA Inc., NVIDIA Corporation, Advanced Micro Devices (AMD), BrainChip Holdings Ltd., Graphcore Limited
Additional Attributes Dollar sales by operation type and AI application; Surge in demand from autonomous systems and edge devices; Expansion of TPU and GPU chipsets for inference workloads; AI model complexity driving custom neural silicon; Regional AI semiconductor policy developments; Cloud AI chip deployment patterns and edge computing trends

Key Players in Neural Processors Market

  • Intel Corporation
  • IBM Corporation
  • Google (TPU)
  • Qualcomm Inc.
  • CEVA Inc.
  • NVIDIA Corporation
  • Advanced Micro Devices (AMD)
  • BrainChip Holdings Ltd.
  • Graphcore Limited
  • Teradeep Inc.

Neural Processors Markets Analyzed by Key Investment Segments

By Operation:

The industry is segmented by operation into training and inference.

By Application:

Based on application, the industry is categorized into smartphones and tablets, autonomous vehicles, robotics and drones, healthcare and medical devices, smart home devices and IoT, cloud and data center AI, industrial automation, and others.

By Region:

Geographically, the industry is analyzed across North America, Europe, Asia Pacific, Latin America, and the Middle East & Africa.

Table of Content

  1. Executive Summary
    • Global Market Outlook
    • Demand-side Trends
    • Supply-side Trends
    • Technology Roadmap Analysis
    • Analysis and Recommendations
  2. Market Overview
    • Market Coverage / Taxonomy
    • Market Definition / Scope / Limitations
  3. Market Background
    • Market Dynamics
      • Drivers
      • Restraints
      • Opportunity
      • Trends
    • Scenario Forecast
      • Demand in Optimistic Scenario
      • Demand in Likely Scenario
      • Demand in Conservative Scenario
    • Opportunity Map Analysis
    • Product Life Cycle Analysis
    • Supply Chain Analysis
      • Supply Side Participants and their Roles
        • Producers
        • Mid-Level Participants (Traders/ Agents/ Brokers)
        • Wholesalers and Distributors
      • Value Added and Value Created at Node in the Supply Chain
      • List of Raw Material Suppliers
      • List of Existing and Potential Buyer’s
    • Investment Feasibility Matrix
    • Value Chain Analysis
      • Profit Margin Analysis
      • Wholesalers and Distributors
      • Retailers
    • PESTLE and Porter’s Analysis
    • Regulatory Landscape
      • By Key Regions
      • By Key Countries
    • Regional Parent Market Outlook
    • Production and Consumption Statistics
    • Import and Export Statistics
  4. Global Market Analysis 2020 to 2024 and Forecast, 2025 to 2035
    • Historical Market Size Value (USD Million) & Volume (Units) Analysis, 2020 to 2024
    • Current and Future Market Size Value (USD Million) & Volume (Units) Projections, 2025 to 2035
      • Y-o-Y Growth Trend Analysis
      • Absolute $ Opportunity Analysis
  5. Global Market Pricing Analysis 2020 to 2024 and Forecast 2025 to 2035
  6. Global Market Analysis 2020 to 2024 and Forecast 2025 to 2035, By Operation
    • Introduction / Key Findings
    • Historical Market Size Value (USD Million) & Volume (Units) Analysis By Operation, 2020 to 2024
    • Current and Future Market Size Value (USD Million) & Volume (Units) Analysis and Forecast By Operation, 2025 to 2035
      • Training
      • Inference
    • Y-o-Y Growth Trend Analysis By Operation, 2020 to 2024
    • Absolute $ Opportunity Analysis By Operation, 2025 to 2035
  7. Global Market Analysis 2020 to 2024 and Forecast 2025 to 2035, By Application
    • Introduction / Key Findings
    • Historical Market Size Value (USD Million) & Volume (Units) Analysis By Application, 2020 to 2024
    • Current and Future Market Size Value (USD Million) & Volume (Units) Analysis and Forecast By Application, 2025 to 2035
      • Smartphones and Tablets
      • Autonomous Vehicles
      • Robotics and Drones
      • Healthcare and Medical Devices
      • Smart Home Devices and IoT
      • Cloud and Data Center AI
      • Industrial Automation
      • Others
    • Y-o-Y Growth Trend Analysis By Application, 2020 to 2024
    • Absolute $ Opportunity Analysis By Application, 2025 to 2035
  8. Global Market Analysis 2020 to 2024 and Forecast 2025 to 2035, By Region
    • Introduction
    • Historical Market Size Value (USD Million) & Volume (Units) Analysis By Region, 2020 to 2024
    • Current Market Size Value (USD Million) & Volume (Units) Analysis and Forecast By Region, 2025 to 2035
      • North America
      • Latin America
      • Western Europe
      • Eastern Europe
      • East Asia
      • South Asia & Pacific
      • Middle East and Africa
    • Market Attractiveness Analysis By Region
  9. North America Market Analysis 2020 to 2024 and Forecast 2025 to 2035, By Country
    • Historical Market Size Value (USD Million) & Volume (Units) Trend Analysis By Market Taxonomy, 2020 to 2024
    • Market Size Value (USD Million) & Volume (Units) Forecast By Market Taxonomy, 2025 to 2035
      • By Country
        • USA
        • Canada
        • Mexico
      • By Operation
      • By Application
    • Market Attractiveness Analysis
      • By Country
      • By Operation
      • By Application
    • Key Takeaways
  10. Latin America Market Analysis 2020 to 2024 and Forecast 2025 to 2035, By Country
    • Historical Market Size Value (USD Million) & Volume (Units) Trend Analysis By Market Taxonomy, 2020 to 2024
    • Market Size Value (USD Million) & Volume (Units) Forecast By Market Taxonomy, 2025 to 2035
      • By Country
        • Brazil
        • Argentina
        • Rest of LATAM
      • By Operation
      • By Application
    • Market Attractiveness Analysis
      • By Country
      • By Operation
      • By Application
    • Key Takeaways
  11. Western Europe Market Analysis 2020 to 2024 and Forecast 2025 to 2035, By Country
    • Historical Market Size Value (USD Million) & Volume (Units) Trend Analysis By Market Taxonomy, 2020 to 2024
    • Market Size Value (USD Million) & Volume (Units) Forecast By Market Taxonomy, 2025 to 2035
      • By Country
        • Germany
        • Italy
        • France
        • UK
        • Spain
        • BENELUX
        • Nordic
        • Rest of W.Europe
      • By Operation
      • By Application
    • Market Attractiveness Analysis
      • By Country
      • By Operation
      • By Application
    • Key Takeaways
  12. Eastern Europe Market Analysis 2020 to 2024 and Forecast 2025 to 2035, By Country
    • Historical Market Size Value (USD Million) & Volume (Units) Trend Analysis By Market Taxonomy, 2020 to 2024
    • Market Size Value (USD Million) & Volume (Units) Forecast By Market Taxonomy, 2025 to 2035
      • By Country
        • Russia
        • Hungary
        • Poland
        • Balkan & Baltics
        • Rest of E. Europe
      • By Operation
      • By Application
    • Market Attractiveness Analysis
      • By Country
      • By Operation
      • By Application
    • Key Takeaways
  13. East Asia Market Analysis 2020 to 2024 and Forecast 2025 to 2035, By Country
    • Historical Market Size Value (USD Million) & Volume (Units) Trend Analysis By Market Taxonomy, 2020 to 2024
    • Market Size Value (USD Million) & Volume (Units) Forecast By Market Taxonomy, 2025 to 2035
      • By Country
        • China
        • Japan
        • South Korea
      • By Operation
      • By Application
    • Market Attractiveness Analysis
      • By Country
      • By Operation
      • By Application
    • Key Takeaways
  14. South Asia & Pacific Market Analysis 2020 to 2024 and Forecast 2025 to 2035, By Country
    • Historical Market Size Value (USD Million) & Volume (Units) Trend Analysis By Market Taxonomy, 2020 to 2024
    • Market Size Value (USD Million) & Volume (Units) Forecast By Market Taxonomy, 2025 to 2035
      • By Country
        • India
        • Australia & New Zealand
        • ASEAN
        • Rest of SAP
      • By Operation
      • By Application
    • Market Attractiveness Analysis
      • By Country
      • By Operation
      • By Application
    • Key Takeaways
  15. Middle East and Africa Market Analysis 2020 to 2024 and Forecast 2025 to 2035, By Country
    • Historical Market Size Value (USD Million) & Volume (Units) Trend Analysis By Market Taxonomy, 2020 to 2024
    • Market Size Value (USD Million) & Volume (Units) Forecast By Market Taxonomy, 2025 to 2035
      • By Country
        • GCC Countries
        • Northern Africa
        • South Africa
        • Turkiye
        • Rest of MEA
      • By Operation
      • By Application
    • Market Attractiveness Analysis
      • By Country
      • By Operation
      • By Application
    • Key Takeaways
  16. Key Countries Market Analysis
    • USA
      • Pricing Analysis
      • Market Share Analysis, 2024
        • By Operation
        • By Application
    • Canada
      • Pricing Analysis
      • Market Share Analysis, 2024
        • By Operation
        • By Application
    • Brazil
      • Pricing Analysis
      • Market Share Analysis, 2024
        • By Operation
        • By Application
    • Mexico
      • Pricing Analysis
      • Market Share Analysis, 2024
        • By Operation
        • By Application
    • Argentina
      • Pricing Analysis
      • Market Share Analysis, 2024
        • By Operation
        • By Application
  17. Market Structure Analysis
    • Competition Dashboard
    • Competition Benchmarking
    • Market Share Analysis of Top Players
      • By Regional
      • By Operation
      • By Application
  18. Competition Analysis
    • Competition Deep Dive
      • Intel Corporation
        • Overview
        • Product Portfolio
        • Profitability by Market Segments (Product/Age /Sales Channel/Region)
        • Sales Footprint
        • Strategy Overview
          • Marketing Strategy
          • Product Strategy
          • Channel Strategy
      • IBM Corporation
        • Overview
        • Product Portfolio
        • Profitability by Market Segments (Product/Age /Sales Channel/Region)
        • Sales Footprint
        • Strategy Overview
          • Marketing Strategy
          • Product Strategy
          • Channel Strategy
      • Google (TPU)
        • Overview
        • Product Portfolio
        • Profitability by Market Segments (Product/Age /Sales Channel/Region)
        • Sales Footprint
        • Strategy Overview
          • Marketing Strategy
          • Product Strategy
          • Channel Strategy
      • Qualcomm Inc.
        • Overview
        • Product Portfolio
        • Profitability by Market Segments (Product/Age /Sales Channel/Region)
        • Sales Footprint
        • Strategy Overview
          • Marketing Strategy
          • Product Strategy
          • Channel Strategy
      • CEVA Inc.
        • Overview
        • Product Portfolio
        • Profitability by Market Segments (Product/Age /Sales Channel/Region)
        • Sales Footprint
        • Strategy Overview
          • Marketing Strategy
          • Product Strategy
          • Channel Strategy
      • NVIDIA Corporation
        • Overview
        • Product Portfolio
        • Profitability by Market Segments (Product/Age /Sales Channel/Region)
        • Sales Footprint
        • Strategy Overview
          • Marketing Strategy
          • Product Strategy
          • Channel Strategy
      • Advanced Micro Devices (AMD)
        • Overview
        • Product Portfolio
        • Profitability by Market Segments (Product/Age /Sales Channel/Region)
        • Sales Footprint
        • Strategy Overview
          • Marketing Strategy
          • Product Strategy
          • Channel Strategy
      • BrainChip Holdings Ltd.
        • Overview
        • Product Portfolio
        • Profitability by Market Segments (Product/Age /Sales Channel/Region)
        • Sales Footprint
        • Strategy Overview
          • Marketing Strategy
          • Product Strategy
          • Channel Strategy
      • Graphcore Limited
        • Overview
        • Product Portfolio
        • Profitability by Market Segments (Product/Age /Sales Channel/Region)
        • Sales Footprint
        • Strategy Overview
          • Marketing Strategy
          • Product Strategy
          • Channel Strategy
      • Teradeep Inc.
        • Overview
        • Product Portfolio
        • Profitability by Market Segments (Product/Age /Sales Channel/Region)
        • Sales Footprint
        • Strategy Overview
          • Marketing Strategy
          • Product Strategy
          • Channel Strategy
  19. Assumptions & Acronyms Used
  20. Research Methodology

List of Tables

  • Table 1: Global Market Value (USD Million) Forecast by Region, 2020 to 2035
  • Table 2: Global Market Volume (Units) Forecast by Region, 2020 to 2035
  • Table 3: Global Market Value (USD Million) Forecast by Operation, 2020 to 2035
  • Table 4: Global Market Volume (Units) Forecast by Operation, 2020 to 2035
  • Table 5: Global Market Value (USD Million) Forecast by Application, 2020 to 2035
  • Table 6: Global Market Volume (Units) Forecast by Application, 2020 to 2035
  • Table 7: North America Market Value (USD Million) Forecast by Country, 2020 to 2035
  • Table 8: North America Market Volume (Units) Forecast by Country, 2020 to 2035
  • Table 9: North America Market Value (USD Million) Forecast by Operation, 2020 to 2035
  • Table 10: North America Market Volume (Units) Forecast by Operation, 2020 to 2035
  • Table 11: North America Market Value (USD Million) Forecast by Application, 2020 to 2035
  • Table 12: North America Market Volume (Units) Forecast by Application, 2020 to 2035
  • Table 13: Latin America Market Value (USD Million) Forecast by Country, 2020 to 2035
  • Table 14: Latin America Market Volume (Units) Forecast by Country, 2020 to 2035
  • Table 15: Latin America Market Value (USD Million) Forecast by Operation, 2020 to 2035
  • Table 16: Latin America Market Volume (Units) Forecast by Operation, 2020 to 2035
  • Table 17: Latin America Market Value (USD Million) Forecast by Application, 2020 to 2035
  • Table 18: Latin America Market Volume (Units) Forecast by Application, 2020 to 2035
  • Table 19: Western Europe Market Value (USD Million) Forecast by Country, 2020 to 2035
  • Table 20: Western Europe Market Volume (Units) Forecast by Country, 2020 to 2035
  • Table 21: Western Europe Market Value (USD Million) Forecast by Operation, 2020 to 2035
  • Table 22: Western Europe Market Volume (Units) Forecast by Operation, 2020 to 2035
  • Table 23: Western Europe Market Value (USD Million) Forecast by Application, 2020 to 2035
  • Table 24: Western Europe Market Volume (Units) Forecast by Application, 2020 to 2035
  • Table 25: Eastern Europe Market Value (USD Million) Forecast by Country, 2020 to 2035
  • Table 26: Eastern Europe Market Volume (Units) Forecast by Country, 2020 to 2035
  • Table 27: Eastern Europe Market Value (USD Million) Forecast by Operation, 2020 to 2035
  • Table 28: Eastern Europe Market Volume (Units) Forecast by Operation, 2020 to 2035
  • Table 29: Eastern Europe Market Value (USD Million) Forecast by Application, 2020 to 2035
  • Table 30: Eastern Europe Market Volume (Units) Forecast by Application, 2020 to 2035
  • Table 31: East Asia Market Value (USD Million) Forecast by Country, 2020 to 2035
  • Table 32: East Asia Market Volume (Units) Forecast by Country, 2020 to 2035
  • Table 33: East Asia Market Value (USD Million) Forecast by Operation, 2020 to 2035
  • Table 34: East Asia Market Volume (Units) Forecast by Operation, 2020 to 2035
  • Table 35: East Asia Market Value (USD Million) Forecast by Application, 2020 to 2035
  • Table 36: East Asia Market Volume (Units) Forecast by Application, 2020 to 2035
  • Table 37: South Asia & Pacific Market Value (USD Million) Forecast by Country, 2020 to 2035
  • Table 38: South Asia & Pacific Market Volume (Units) Forecast by Country, 2020 to 2035
  • Table 39: South Asia & Pacific Market Value (USD Million) Forecast by Operation, 2020 to 2035
  • Table 40: South Asia & Pacific Market Volume (Units) Forecast by Operation, 2020 to 2035
  • Table 41: South Asia & Pacific Market Value (USD Million) Forecast by Application, 2020 to 2035
  • Table 42: South Asia & Pacific Market Volume (Units) Forecast by Application, 2020 to 2035
  • Table 43: Middle East and Africa Market Value (USD Million) Forecast by Country, 2020 to 2035
  • Table 44: Middle East and Africa Market Volume (Units) Forecast by Country, 2020 to 2035
  • Table 45: Middle East and Africa Market Value (USD Million) Forecast by Operation, 2020 to 2035
  • Table 46: Middle East and Africa Market Volume (Units) Forecast by Operation, 2020 to 2035
  • Table 47: Middle East and Africa Market Value (USD Million) Forecast by Application, 2020 to 2035
  • Table 48: Middle East and Africa Market Volume (Units) Forecast by Application, 2020 to 2035

List of Figures

  • Figure 1: Global Market Volume (Units) Forecast 2020 to 2035
  • Figure 2: Global Market Pricing Analysis
  • Figure 3: Global Market Value (USD Million) Forecast 2020 to 2035
  • Figure 4: Global Market Value Share and BPS Analysis by Operation, 2025 and 2035
  • Figure 5: Global Market Y-o-Y Growth Comparison by Operation, 2025 to 2035
  • Figure 6: Global Market Attractiveness Analysis by Operation
  • Figure 7: Global Market Value Share and BPS Analysis by Application, 2025 and 2035
  • Figure 8: Global Market Y-o-Y Growth Comparison by Application, 2025 to 2035
  • Figure 9: Global Market Attractiveness Analysis by Application
  • Figure 10: Global Market Value (USD Million) Share and BPS Analysis by Region, 2025 and 2035
  • Figure 11: Global Market Y-o-Y Growth Comparison by Region, 2025 to 2035
  • Figure 12: Global Market Attractiveness Analysis by Region
  • Figure 13: North America Market Incremental $ Opportunity, 2025 to 2035
  • Figure 14: Latin America Market Incremental $ Opportunity, 2025 to 2035
  • Figure 15: Western Europe Market Incremental $ Opportunity, 2025 to 2035
  • Figure 16: Eastern Europe Market Incremental $ Opportunity, 2025 to 2035
  • Figure 17: East Asia Market Incremental $ Opportunity, 2025 to 2035
  • Figure 18: South Asia & Pacific Market Incremental $ Opportunity, 2025 to 2035
  • Figure 19: Middle East and Africa Market Incremental $ Opportunity, 2025 to 2035
  • Figure 20: North America Market Value Share and BPS Analysis by Country, 2025 and 2035
  • Figure 21: North America Market Value Share and BPS Analysis by Operation, 2025 and 2035
  • Figure 22: North America Market Y-o-Y Growth Comparison by Operation, 2025 to 2035
  • Figure 23: North America Market Attractiveness Analysis by Operation
  • Figure 24: North America Market Value Share and BPS Analysis by Application, 2025 and 2035
  • Figure 25: North America Market Y-o-Y Growth Comparison by Application, 2025 to 2035
  • Figure 26: North America Market Attractiveness Analysis by Application
  • Figure 27: Latin America Market Value Share and BPS Analysis by Country, 2025 and 2035
  • Figure 28: Latin America Market Value Share and BPS Analysis by Operation, 2025 and 2035
  • Figure 29: Latin America Market Y-o-Y Growth Comparison by Operation, 2025 to 2035
  • Figure 30: Latin America Market Attractiveness Analysis by Operation
  • Figure 31: Latin America Market Value Share and BPS Analysis by Application, 2025 and 2035
  • Figure 32: Latin America Market Y-o-Y Growth Comparison by Application, 2025 to 2035
  • Figure 33: Latin America Market Attractiveness Analysis by Application
  • Figure 34: Western Europe Market Value Share and BPS Analysis by Country, 2025 and 2035
  • Figure 35: Western Europe Market Value Share and BPS Analysis by Operation, 2025 and 2035
  • Figure 36: Western Europe Market Y-o-Y Growth Comparison by Operation, 2025 to 2035
  • Figure 37: Western Europe Market Attractiveness Analysis by Operation
  • Figure 38: Western Europe Market Value Share and BPS Analysis by Application, 2025 and 2035
  • Figure 39: Western Europe Market Y-o-Y Growth Comparison by Application, 2025 to 2035
  • Figure 40: Western Europe Market Attractiveness Analysis by Application
  • Figure 41: Eastern Europe Market Value Share and BPS Analysis by Country, 2025 and 2035
  • Figure 42: Eastern Europe Market Value Share and BPS Analysis by Operation, 2025 and 2035
  • Figure 43: Eastern Europe Market Y-o-Y Growth Comparison by Operation, 2025 to 2035
  • Figure 44: Eastern Europe Market Attractiveness Analysis by Operation
  • Figure 45: Eastern Europe Market Value Share and BPS Analysis by Application, 2025 and 2035
  • Figure 46: Eastern Europe Market Y-o-Y Growth Comparison by Application, 2025 to 2035
  • Figure 47: Eastern Europe Market Attractiveness Analysis by Application
  • Figure 48: East Asia Market Value Share and BPS Analysis by Country, 2025 and 2035
  • Figure 49: East Asia Market Value Share and BPS Analysis by Operation, 2025 and 2035
  • Figure 50: East Asia Market Y-o-Y Growth Comparison by Operation, 2025 to 2035
  • Figure 51: East Asia Market Attractiveness Analysis by Operation
  • Figure 52: East Asia Market Value Share and BPS Analysis by Application, 2025 and 2035
  • Figure 53: East Asia Market Y-o-Y Growth Comparison by Application, 2025 to 2035
  • Figure 54: East Asia Market Attractiveness Analysis by Application
  • Figure 55: South Asia & Pacific Market Value Share and BPS Analysis by Country, 2025 and 2035
  • Figure 56: South Asia & Pacific Market Value Share and BPS Analysis by Operation, 2025 and 2035
  • Figure 57: South Asia & Pacific Market Y-o-Y Growth Comparison by Operation, 2025 to 2035
  • Figure 58: South Asia & Pacific Market Attractiveness Analysis by Operation
  • Figure 59: South Asia & Pacific Market Value Share and BPS Analysis by Application, 2025 and 2035
  • Figure 60: South Asia & Pacific Market Y-o-Y Growth Comparison by Application, 2025 to 2035
  • Figure 61: South Asia & Pacific Market Attractiveness Analysis by Application
  • Figure 62: Middle East and Africa Market Value Share and BPS Analysis by Country, 2025 and 2035
  • Figure 63: Middle East and Africa Market Value Share and BPS Analysis by Operation, 2025 and 2035
  • Figure 64: Middle East and Africa Market Y-o-Y Growth Comparison by Operation, 2025 to 2035
  • Figure 65: Middle East and Africa Market Attractiveness Analysis by Operation
  • Figure 66: Middle East and Africa Market Value Share and BPS Analysis by Application, 2025 and 2035
  • Figure 67: Middle East and Africa Market Y-o-Y Growth Comparison by Application, 2025 to 2035
  • Figure 68: Middle East and Africa Market Attractiveness Analysis by Application
  • Figure 69: Global Market - Tier Structure Analysis
  • Figure 70: Global Market - Company Share Analysis

Frequently Asked Questions

What is the projected size of the neural processors market in 2025 and 2035?

The industry size is projected to be USD 176 million in 2025 and USD 1,010 million by 2035.

What is the expected CAGR for the neural processors market from 2025 to 2035?

The expected CAGR is 19.1% from 2025 to 2035.

Which company is the industry leader in neural processors?

NVIDIA Corporation is the leading company in the industry with a 40% industry share.

Which segment is expected to dominate neural processor workloads in 2025?

Inference operations are expected to dominate with a 67% industry share in 2025.

Which country is expected to grow the fastest in the neural processors market?

The United States is expected to grow the fastest with a projected CAGR of 21.2% from 2025 to 2035.

Explore Similar Insights

Future Market Insights

Neural Processors Market