Nitromethane Market
Nitromethane Market by Product, Capacity, Application, Distribution Channel & Region - Forecast 2022 - 2032
Market Insights on Nitromethane covering sales outlook, demand forecast and up-to-date key trends
Nitromethane Market Overview (2022-2032)
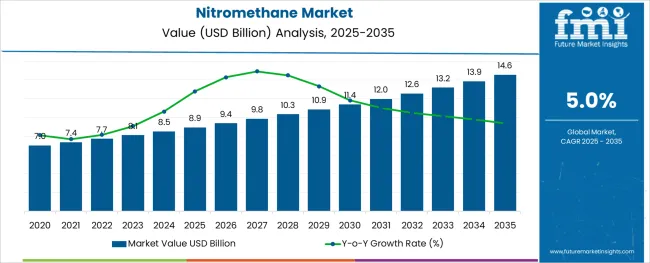
[250 Pages Report] The nitromethane market is likely to register a CAGR of 5% during the forecast period, and is anticipated to reach a market share of US$ 12.57 Bn by 2032, from US$ 7 Bn in 2020, as organic synthesis of medicinal and agrochemical compounds is in high demand.
Attributes |
Details |
Nitromethane Market CAGR |
5% |
Nitromethane Market (2020) |
US$ 7 Bn |
Nitromethane Market Size (2032) |
US$ 12.57 Bn |
Due to the rising demand for nitromethane in various industries, such as automotive, pharmaceuticals, and explosives, the worldwide nitromethane market is predicted to grow rapidly during the forecast period. The expansion of the pharmaceutical sector in Asia Pacific countries such as India, Taiwan, and Thailand has created new opportunities for the nitromethane market.
Nitromethane is the most basic organic nitro compound and polar liquid, and it's mostly utilized as a solvent in industrial applications like extractions, reaction medium, and cleaning solvents, which determine sales of nitromethane. It is frequently employed as an intermediate in organic synthesis in the production of medications, insecticides, explosives, textiles, and coatings, which is a factor for improved sales of nitromethane.
The business models, major strategies, and respective nitromethane market shares of some of the most notable players in this sector are all examined in depth in this nitromethane market report.
The comprehensive analysis includes market statistics in terms of revenues, segment-wise data, region-wise data, and country-wise data that determine the demand for nitromethane, as well as an in-depth commentary on the key influencing variables. This report is one of the most thorough documents available, capturing all aspects of the rapidly changing nitromethane market.
Don't pay for what you don't need
Customize your report by selecting specific countries or regions and save 30%!
What are the Contributors for the Growth of the Nitromethane Market?
The nitromethane market share is expanding, as nitromethane is a valuable molecule with significant demand in the organic synthesis of medicinal and agrochemical goods because it efficiently transfers nitrogen. Nitromethane is also employed as a stabilizer of chlorinated solvents in degreasing, dry cleaning, and semiconductor processing applications, leading to higher demand for nitromethane.
Nitromethane is also utilized in manufacturing adhesives as a dissolving agent or solvent for acrylate monomers. Nitromethane is also utilized as a fuel in high-powered motorsports like drag racing and rockets, which is a contributor to the sales of nitromethane.
What are the Trends in the Nitromethane Market?
When compared to gasoline, nitromethane requires a substantially smaller volume of air for burning, allowing more nitromethane fuel to be burned per engine stroke, resulting in high engine power, leading to higher sales of nitromethane comparatively.
Due to its low oxygen needs for combustion, nitromethane is employed as a monopropellant. As a result, nitromethane is used in a variety of sectors and is a versatile substance with numerous applications, which proliferates the sales of nitromethane. The pharmaceutical and agrochemical industries, as well as the automobile industry, are expected to drive the demand for nitromethane.
Which is the Leading Region for Nitromethane Market?
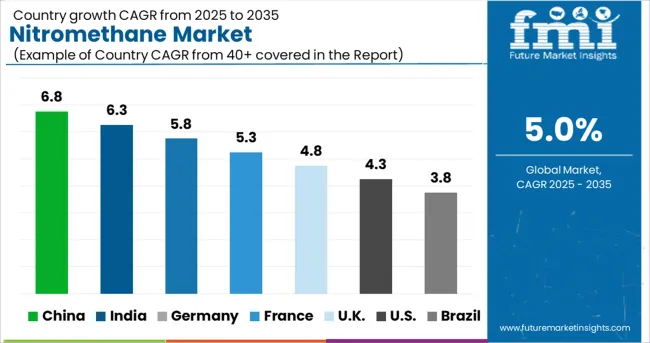
The pharmaceutical, agricultural, automotive, and chemical industries are expected to have moderate demand for nitromethane in the coming years. With rising demand for agricultural, chemical, and pharmaceutical products, the Asia Pacific area is likely to be a major nitromethane market.
The Asia Pacific region's fast-growing economy will drive up demand for nitromethane. Nitromethane is also a large market in North America and Europe, with consistent demand and a well-developed industry structure.
However, the health risks posed by nitromethane, as well as the strict restrictions governing its handling and use in these locations, raise concerns about sales of nitromethane and may act as a stifling factor. The United States, Germany, Norway, China, and the United Kingdom are some of the most important countries contributing to the nitromethane market share.
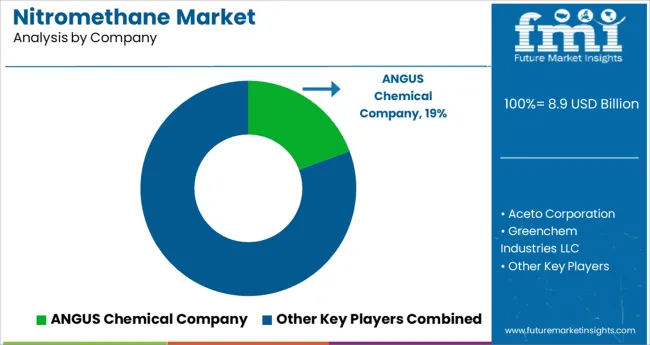
What is the Competitive Outlook of the Nitromethane Market?
ANGUS Chemical Company, JIGCHEM UNIVERSAL, Greenchem Industries LLC, Wego Chemical & Mineral Corp, Linyi Yuan Chemical Co., Ltd, Zibo Xinglu Chemical Co., Ltd., Wujiang Bolin Industry Co., Ltd., Aceto Corporation, Antera Agro Chem, CDH Fine Chemicals India are some of the major players in the nitromethane market, which contributes to the nitromethane market share.
- Top-fuel drag racing, radio-controlled small internal combustion engines, and free-flight model airplanes are all popular activities. Nitromethane, like Trinitrotoluene, is used as a controlled explosive in a variety of industries (TNT). Sales of nitromethane have surged as a result of its widespread use.
- Biocides, chemicals, and agricultural goods and intermediates all use nitromethane. As a result, manufacturers are focused on using nitromethane as a fuel or fuel additive in hobby vehicles, boats, and model engines, often diluted with methanol.
Get the data you need at a Fraction of the cost
Personalize your report by choosing insights you need
and save 40%!
Report Scope
Report Attribute |
Details |
Growth rate |
CAGR of 5% from 2022 to 2032 |
Base year for estimation |
2021 |
Historical data |
2015 - 2020 |
Forecast period |
2022 - 2032 |
Quantitative units |
Revenue in USD million and CAGR from 2022 to 2032 |
Report coverage |
Revenue forecast, volume forecast, company ranking, competitive landscape, growth factors, and trends, Pricing Analysis, |
Segments covered |
Product grade, application, region |
Regional scope |
North America; Western Europe, Eastern Europe, Middle East, Africa, ASEAN, South Asia, Rest of Asia, Australia and New Zealand |
Country scope |
U.S.; Canada; Mexico; Germany; U.K.; France; Italy; Spain; Russia; Belgium; Poland; Czech Republic; China; India; Japan; Australia; Brazil; Argentina; Colombia; Saudi Arabia; UAE; Iran; South Africa |
Key companies profiled |
ANGUS Chemical Company, Aceto Corporation, Greenchem Industries LLC, Wego Chemical & Mineral Corp, Linyi Yuan Chemical Co., Ltd, Zibo Xinglu Chemical Co., Ltd., Wujiang Bolin Industry Co., Ltd., JIGCHEM UNIVERSAL, Antera Agro Chem, CDH Fine Chemicals India |
Customization scope |
Free report customization (equivalent to up to 8 analysts working days) with purchase. Addition or alteration to country, regional & segment scope. |
Pricing and purchase options |
Avail customized purchase options to meet your exact research needs. |
Key Segments
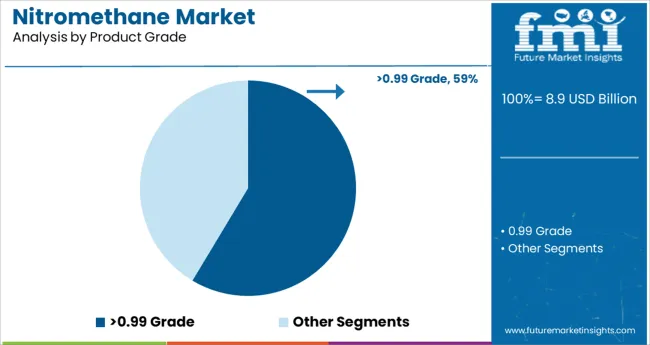
By Product Grade:
- 0.99 Grade
- >0.99 Grade
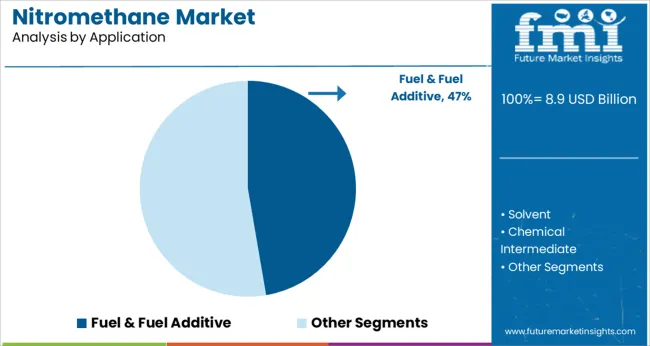
By Application:
- Solvent
- Chemical Intermediate
- Fuel & Fuel Additive
- Explosive
By Region:
- North America
- Latin America
- Asia Pacific
- Europe
- MEA
Frequently Asked Questions
What is the Growth Outlook for the Nitromethane Market?
The nitromethane market is anticipated to register a CAGR of 5% during the forecast period.
What is the Share of the Nitromethane Market?
The nitromethane market share is anticipated to reach US$ 12.57 Bn by 2032.
Which is the Key Driver in the Nitromethane Market?
Demand for nitromethane is likely to rise, as organic synthesis of medicinal and agrochemical compounds is in high demand.
Table of Content
1. Executive Summary 1.1. Global Market Outlook 1.2. Demand-side Trends 1.3. Supply-side Trends 1.4. Technology Roadmap Analysis 1.5. Analysis and Recommendations 2. Market Overview 2.1. Market Coverage / Taxonomy 2.2. Market Definition / Scope / Limitations 3. Market Background 3.1. Market Dynamics 3.1.1. Drivers 3.1.2. Restraints 3.1.3. Opportunity 3.1.4. Trends 3.2. Scenario Forecast 3.2.1. Demand in Optimistic Scenario 3.2.2. Demand in Likely Scenario 3.2.3. Demand in Conservative Scenario 3.3. Opportunity Map Analysis 3.4. Product Life Cycle Analysis 3.5. Supply Chain Analysis 3.5.1. Supply Side Participants and their Roles 3.5.1.1. Producers 3.5.1.2. Mid-Level Participants (Traders/ Agents/ Brokers) 3.5.1.3. Wholesalers and Distributors 3.5.2. Value Added and Value Created at Node in the Supply Chain 3.5.3. List of Raw Material Suppliers 3.5.4. List of Existing and Potential Buyer’s 3.6. Investment Feasibility Matrix 3.7. Value Chain Analysis 3.7.1. Profit Margin Analysis 3.7.2. Wholesalers and Distributors 3.7.3. Retailers 3.8. PESTLE and Porter’s Analysis 3.9. Regulatory Landscape 3.9.1. By Key Regions 3.9.2. By Key Countries 3.10. Regional Parent Market Outlook 3.11. Production and Consumption Statistics 3.12. Import and Export Statistics 4. Global Nitromethane Market Analysis 2017-2021 and Forecast, 2022-2032 4.1. Historical Market Size Value (US$ Mn) & Volume (Tons) Analysis, 2017-2021 4.2. Current and Future Market Size Value (US$ Mn) & Volume (Tons) Projections, 2022-2032 4.2.1. Y-o-Y Growth Trend Analysis 4.2.2. Absolute $ Opportunity Analysis 5. Global Nitromethane Market Analysis 2017-2021 and Forecast 2022-2032, By Purity 5.1. Introduction / Key Findings 5.2. Historical Market Size Value (US$ Mn) & Volume (Tons) Analysis By Purity, 2017-2021 5.3. Current and Future Market Size Value (US$ Mn) & Volume (Tons) Analysis and Forecast By Purity, 2022-2032 5.3.1. Purity ≥ 99% 5.3.2. Purity < 99% 5.4. Y-o-Y Growth Trend Analysis By Purity, 2017-2021 5.5. Absolute $ Opportunity Analysis By Purity, 2022-2032 Deep-dive segmentation will be available in the sample on request 6. Global Nitromethane Market Analysis 2017-2021 and Forecast 2022-2032, By Application 6.1. Introduction / Key Findings 6.2. Historical Market Size Value (US$ Mn) & Volume (Tons) Analysis By Application, 2017-2021 6.3. Current and Future Market Size Value (US$ Mn) & Volume (Tons) Analysis and Forecast By Application, 2022-2032 6.3.1. Solvent 6.3.2. Chemical Intermediate 6.3.3. Fuel & Fuel Additive 6.3.4. Explosive 6.4. Y-o-Y Growth Trend Analysis By Application, 2017-2021 6.5. Absolute $ Opportunity Analysis By Application, 2022-2032 Deep-dive segmentation will be available in the sample on request 7. Global Nitromethane Market Analysis 2017-2021 and Forecast 2022-2032, By Region 7.1. Introduction 7.2. Historical Market Size Value (US$ Mn) & Volume (Tons) Analysis By Region, 2017-2021 7.3. Current Market Size Value (US$ Mn) & Volume (Tons) Analysis and Forecast By Region, 2022-2032 7.3.1. North America 7.3.2. Latin America 7.3.3. Europe 7.3.4. East Asia 7.3.5. South Asia & Pacific 7.3.6. MEA 7.4. Market Attractiveness Analysis By Region 8. North America Nitromethane Market Analysis 2017-2021 and Forecast 2022-2032, By Country 8.1. Historical Market Size Value (US$ Mn) & Volume (Tons) Trend Analysis By Market Taxonomy, 2017-2021 8.2. Market Size Value (US$ Mn) & Volume (Tons) Forecast By Market Taxonomy, 2022-2032 8.2.1. By Country 8.2.1.1. U.S. 8.2.1.2. Canada 8.2.2. By Purity 8.2.3. By Application 8.3. Market Attractiveness Analysis 8.3.1. By Country 8.3.2. By Purity 8.3.3. By Application 8.4. Key Takeaways 9. Latin America Nitromethane Market Analysis 2017-2021 and Forecast 2022-2032, By Country 9.1. Historical Market Size Value (US$ Mn) & Volume (Tons) Trend Analysis By Market Taxonomy, 2017-2021 9.2. Market Size Value (US$ Mn) & Volume (Tons) Forecast By Market Taxonomy, 2022-2032 9.2.1. By Country 9.2.1.1. Mexico 9.2.1.2. Brazil 9.2.1.3. Rest of Latin America 9.2.2. By Purity 9.2.3. By Application 9.3. Market Attractiveness Analysis 9.3.1. By Country 9.3.2. By Purity 9.3.3. By Application 9.4. Key Takeaways 10. Europe Nitromethane Market Analysis 2017-2021 and Forecast 2022-2032, By Country 10.1. Historical Market Size Value (US$ Mn) & Volume (Tons) Trend Analysis By Market Taxonomy, 2017-2021 10.2. Market Size Value (US$ Mn) & Volume (Tons) Forecast By Market Taxonomy, 2022-2032 10.2.1. By Country 10.2.1.1. Germany 10.2.1.2. Italy 10.2.1.3. France 10.2.1.4. U.K. 10.2.1.5. Spain 10.2.1.6. BENELUX 10.2.1.7. Russia 10.2.1.8. Rest of Europe 10.2.2. By Purity 10.2.3. By Application 10.3. Market Attractiveness Analysis 10.3.1. By Country 10.3.2. By Purity 10.3.3. By Application 10.4. Key Takeaways 11. East Asia Nitromethane Market Analysis 2017-2021 and Forecast 2022-2032, By Country 11.1. Historical Market Size Value (US$ Mn) & Volume (Tons) Trend Analysis By Market Taxonomy, 2017-2021 11.2. Market Size Value (US$ Mn) & Volume (Tons) Forecast By Market Taxonomy, 2022-2032 11.2.1. By Country 11.2.1.1. China 11.2.1.2. Japan 11.2.1.3. South Korea 11.2.2. By Purity 11.2.3. By Application 11.3. Market Attractiveness Analysis 11.3.1. By Country 11.3.2. By Purity 11.3.3. By Application 11.4. Key Takeaways 12. South Asia & Pacific Nitromethane Market Analysis 2017-2021 and Forecast 2022-2032, By Country 12.1. Historical Market Size Value (US$ Mn) & Volume (Tons) Trend Analysis By Market Taxonomy, 2017-2021 12.2. Market Size Value (US$ Mn) & Volume (Tons) Forecast By Market Taxonomy, 2022-2032 12.2.1. By Country 12.2.1.1. India 12.2.1.2. ASEAN 12.2.1.3. Australia and New Zealand 12.2.1.4. Rest of South Asia & Pacific 12.2.2. By Purity 12.2.3. By Application 12.3. Market Attractiveness Analysis 12.3.1. By Country 12.3.2. By Purity 12.3.3. By Application 12.4. Key Takeaways 13. MEA Nitromethane Market Analysis 2017-2021 and Forecast 2022-2032, By Country 13.1. Historical Market Size Value (US$ Mn) & Volume (Tons) Trend Analysis By Market Taxonomy, 2017-2021 13.2. Market Size Value (US$ Mn) & Volume (Tons) Forecast By Market Taxonomy, 2022-2032 13.2.1. By Country 13.2.1.1. GCC Countries 13.2.1.2. Turkey 13.2.1.3. South Africa 13.2.1.4. Rest of MEA 13.2.2. By Purity 13.2.3. By Application 13.3. Market Attractiveness Analysis 13.3.1. By Country 13.3.2. By Purity 13.3.3. By Application 13.4. Key Takeaways 14. Key Countries Nitromethane Market Analysis 14.1. U.S. 14.1.1. Pricing Analysis 14.1.2. Market Share Analysis, 2021 14.1.2.1. By Purity 14.1.2.2. By Application 14.2. Canada 14.2.1. Pricing Analysis 14.2.2. Market Share Analysis, 2021 14.2.2.1. By Purity 14.2.2.2. By Application 14.3. Mexico 14.3.1. Pricing Analysis 14.3.2. Market Share Analysis, 2021 14.3.2.1. By Purity 14.3.2.2. By Application 14.4. Brazil 14.4.1. Pricing Analysis 14.4.2. Market Share Analysis, 2021 14.4.2.1. By Purity 14.4.2.2. By Application 14.5. Germany 14.5.1. Pricing Analysis 14.5.2. Market Share Analysis, 2021 14.5.2.1. By Purity 14.5.2.2. By Application 14.6. Italy 14.6.1. Pricing Analysis 14.6.2. Market Share Analysis, 2021 14.6.2.1. By Purity 14.6.2.2. By Application 14.7. France 14.7.1. Pricing Analysis 14.7.2. Market Share Analysis, 2021 14.7.2.1. By Purity 14.7.2.2. By Application 14.8. U.K. 14.8.1. Pricing Analysis 14.8.2. Market Share Analysis, 2021 14.8.2.1. By Purity 14.8.2.2. By Application 14.9. Spain 14.9.1. Pricing Analysis 14.9.2. Market Share Analysis, 2021 14.9.2.1. By Purity 14.9.2.2. By Application 14.10. BENELUX 14.10.1. Pricing Analysis 14.10.2. Market Share Analysis, 2021 14.10.2.1. By Purity 14.10.2.2. By Application 14.11. Russia 14.11.1. Pricing Analysis 14.11.2. Market Share Analysis, 2021 14.11.2.1. By Purity 14.11.2.2. By Application 14.12. China 14.12.1. Pricing Analysis 14.12.2. Market Share Analysis, 2021 14.12.2.1. By Purity 14.12.2.2. By Application 14.13. Japan 14.13.1. Pricing Analysis 14.13.2. Market Share Analysis, 2021 14.13.2.1. By Purity 14.13.2.2. By Application 14.14. South Korea 14.14.1. Pricing Analysis 14.14.2. Market Share Analysis, 2021 14.14.2.1. By Purity 14.14.2.2. By Application 14.15. India 14.15.1. Pricing Analysis 14.15.2. Market Share Analysis, 2021 14.15.2.1. By Purity 14.15.2.2. By Application 14.16. ASEAN 14.16.1. Pricing Analysis 14.16.2. Market Share Analysis, 2021 14.16.2.1. By Purity 14.16.2.2. By Application 14.17. Australia and New Zealand 14.17.1. Pricing Analysis 14.17.2. Market Share Analysis, 2021 14.17.2.1. By Purity 14.17.2.2. By Application 14.18. GCC Countries 14.18.1. Pricing Analysis 14.18.2. Market Share Analysis, 2021 14.18.2.1. By Purity 14.18.2.2. By Application 14.19. Turkey 14.19.1. Pricing Analysis 14.19.2. Market Share Analysis, 2021 14.19.2.1. By Purity 14.19.2.2. By Application 14.20. South Africa 14.20.1. Pricing Analysis 14.20.2. Market Share Analysis, 2021 14.20.2.1. By Purity 14.20.2.2. By Application 15. Market Structure Analysis 15.1. Competition Dashboard 15.2. Competition Benchmarking 15.3. Market Share Analysis of Top Players 15.3.1. By Regional 15.3.2. By Purity 15.3.3. By Application 16. Competition Analysis 16.1. Competition Deep Dive 16.1.1. ANGUS Chemical Company 16.1.1.1. Overview 16.1.1.2. Product Portfolio 16.1.1.3. Profitability by Market Segments 16.1.1.4. Sales Footprint 16.1.1.5. Strategy Overview 16.1.1.5.1. Marketing Strategy 16.1.1.5.2. Product Strategy 16.1.1.5.3. Channel Strategy 16.1.2. Aceto Corporation 16.1.2.1. Overview 16.1.2.2. Product Portfolio 16.1.2.3. Profitability by Market Segments 16.1.2.4. Sales Footprint 16.1.2.5. Strategy Overview 16.1.2.5.1. Marketing Strategy 16.1.2.5.2. Product Strategy 16.1.2.5.3. Channel Strategy 16.1.3. Greenchem Industries LLC 16.1.3.1. Overview 16.1.3.2. Product Portfolio 16.1.3.3. Profitability by Market Segments 16.1.3.4. Sales Footprint 16.1.3.5. Strategy Overview 16.1.3.5.1. Marketing Strategy 16.1.3.5.2. Product Strategy 16.1.3.5.3. Channel Strategy 16.1.4. Wego Chemical & Mineral Corp 16.1.4.1. Overview 16.1.4.2. Product Portfolio 16.1.4.3. Profitability by Market Segments 16.1.4.4. Sales Footprint 16.1.4.5. Strategy Overview 16.1.4.5.1. Marketing Strategy 16.1.4.5.2. Product Strategy 16.1.4.5.3. Channel Strategy 16.1.5. Linyi Yuanbo Chemical Co., Ltd 16.1.5.1. Overview 16.1.5.2. Product Portfolio 16.1.5.3. Profitability by Market Segments 16.1.5.4. Sales Footprint 16.1.5.5. Strategy Overview 16.1.5.5.1. Marketing Strategy 16.1.5.5.2. Product Strategy 16.1.5.5.3. Channel Strategy 16.1.6. Zibo Xinglu Chemical Co., Ltd. 16.1.6.1. Overview 16.1.6.2. Product Portfolio 16.1.6.3. Profitability by Market Segments 16.1.6.4. Sales Footprint 16.1.6.5. Strategy Overview 16.1.6.5.1. Marketing Strategy 16.1.6.5.2. Product Strategy 16.1.6.5.3. Channel Strategy 16.1.7. Wujiang Bolin Industry Co., Ltd. 16.1.7.1. Overview 16.1.7.2. Product Portfolio 16.1.7.3. Profitability by Market Segments 16.1.7.4. Sales Footprint 16.1.7.5. Strategy Overview 16.1.7.5.1. Marketing Strategy 16.1.7.5.2. Product Strategy 16.1.7.5.3. Channel Strategy 16.1.8. JIGCHEM UNIVERSAL 16.1.8.1. Overview 16.1.8.2. Product Portfolio 16.1.8.3. Profitability by Market Segments 16.1.8.4. Sales Footprint 16.1.8.5. Strategy Overview 16.1.8.5.1. Marketing Strategy 16.1.8.5.2. Product Strategy 16.1.8.5.3. Channel Strategy 16.1.9. Antera Agro Chem 16.1.9.1. Overview 16.1.9.2. Product Portfolio 16.1.9.3. Profitability by Market Segments 16.1.9.4. Sales Footprint 16.1.9.5. Strategy Overview 16.1.9.5.1. Marketing Strategy 16.1.9.5.2. Product Strategy 16.1.9.5.3. Channel Strategy 16.1.10. Yuan Bo Chemical 16.1.10.1. Overview 16.1.10.2. Product Portfolio 16.1.10.3. Profitability by Market Segments 16.1.10.4. Sales Footprint 16.1.10.5. Strategy Overview 16.1.10.5.1. Marketing Strategy 16.1.10.5.2. Product Strategy 16.1.10.5.3. Channel Strategy 16.1.11. Zibo Xinglu Chemical Factory 16.1.11.1. Overview 16.1.11.2. Product Portfolio 16.1.11.3. Profitability by Market Segments 16.1.11.4. Sales Footprint 16.1.11.5. Strategy Overview 16.1.11.5.1. Marketing Strategy 16.1.11.5.2. Product Strategy 16.1.11.5.3. Channel Strategy 16.1.12. Hubei Grand Fuchi 16.1.12.1. Overview 16.1.12.2. Product Portfolio 16.1.12.3. Profitability by Market Segments 16.1.12.4. Sales Footprint 16.1.12.5. Strategy Overview 16.1.12.5.1. Marketing Strategy 16.1.12.5.2. Product Strategy 16.1.12.5.3. Channel Strategy 16.1.13. Xinghui Chemical 16.1.13.1. Overview 16.1.13.2. Product Portfolio 16.1.13.3. Profitability by Market Segments 16.1.13.4. Sales Footprint 16.1.13.5. Strategy Overview 16.1.13.5.1. Marketing Strategy 16.1.13.5.2. Product Strategy 16.1.13.5.3. Channel Strategy 17. Assumptions & Acronyms Used 18. Research Methodology
Don't pay for what you don't need
Customize your report by selecting specific countries or regions and save 30%!
List of Tables
Table 1: Global Nitromethane Market Value (US$ Mn) Forecast by Region, 2017-2032 Table 2: Global Nitromethane Market Volume (Tons) Forecast by Region, 2017-2032 Table 3: Global Nitromethane Market Value (US$ Mn) Forecast by Purity, 2017-2032 Table 4: Global Nitromethane Market Volume (Tons) Forecast by Purity, 2017-2032 Table 5: Global Nitromethane Market Value (US$ Mn) Forecast by Application, 2017-2032 Table 6: Global Nitromethane Market Volume (Tons) Forecast by Application, 2017-2032 Table 7: North America Nitromethane Market Value (US$ Mn) Forecast by Country, 2017-2032 Table 8: North America Nitromethane Market Volume (Tons) Forecast by Country, 2017-2032 Table 9: North America Nitromethane Market Value (US$ Mn) Forecast by Purity, 2017-2032 Table 10: North America Nitromethane Market Volume (Tons) Forecast by Purity, 2017-2032 Table 11: North America Nitromethane Market Value (US$ Mn) Forecast by Application, 2017-2032 Table 12: North America Nitromethane Market Volume (Tons) Forecast by Application, 2017-2032 Table 13: Latin America Nitromethane Market Value (US$ Mn) Forecast by Country, 2017-2032 Table 14: Latin America Nitromethane Market Volume (Tons) Forecast by Country, 2017-2032 Table 15: Latin America Nitromethane Market Value (US$ Mn) Forecast by Purity, 2017-2032 Table 16: Latin America Nitromethane Market Volume (Tons) Forecast by Purity, 2017-2032 Table 17: Latin America Nitromethane Market Value (US$ Mn) Forecast by Application, 2017-2032 Table 18: Latin America Nitromethane Market Volume (Tons) Forecast by Application, 2017-2032 Table 19: Europe Nitromethane Market Value (US$ Mn) Forecast by Country, 2017-2032 Table 20: Europe Nitromethane Market Volume (Tons) Forecast by Country, 2017-2032 Table 21: Europe Nitromethane Market Value (US$ Mn) Forecast by Purity, 2017-2032 Table 22: Europe Nitromethane Market Volume (Tons) Forecast by Purity, 2017-2032 Table 23: Europe Nitromethane Market Value (US$ Mn) Forecast by Application, 2017-2032 Table 24: Europe Nitromethane Market Volume (Tons) Forecast by Application, 2017-2032 Table 25: East Asia Nitromethane Market Value (US$ Mn) Forecast by Country, 2017-2032 Table 26: East Asia Nitromethane Market Volume (Tons) Forecast by Country, 2017-2032 Table 27: East Asia Nitromethane Market Value (US$ Mn) Forecast by Purity, 2017-2032 Table 28: East Asia Nitromethane Market Volume (Tons) Forecast by Purity, 2017-2032 Table 29: East Asia Nitromethane Market Value (US$ Mn) Forecast by Application, 2017-2032 Table 30: East Asia Nitromethane Market Volume (Tons) Forecast by Application, 2017-2032 Table 31: South Asia & Pacific Nitromethane Market Value (US$ Mn) Forecast by Country, 2017-2032 Table 32: South Asia & Pacific Nitromethane Market Volume (Tons) Forecast by Country, 2017-2032 Table 33: South Asia & Pacific Nitromethane Market Value (US$ Mn) Forecast by Purity, 2017-2032 Table 34: South Asia & Pacific Nitromethane Market Volume (Tons) Forecast by Purity, 2017-2032 Table 35: South Asia & Pacific Nitromethane Market Value (US$ Mn) Forecast by Application, 2017-2032 Table 36: South Asia & Pacific Nitromethane Market Volume (Tons) Forecast by Application, 2017-2032 Table 37: MEA Nitromethane Market Value (US$ Mn) Forecast by Country, 2017-2032 Table 38: MEA Nitromethane Market Volume (Tons) Forecast by Country, 2017-2032 Table 39: MEA Nitromethane Market Value (US$ Mn) Forecast by Purity, 2017-2032 Table 40: MEA Nitromethane Market Volume (Tons) Forecast by Purity, 2017-2032 Table 41: MEA Nitromethane Market Value (US$ Mn) Forecast by Application, 2017-2032 Table 42: MEA Nitromethane Market Volume (Tons) Forecast by Application, 2017-2032
List of Charts
Figure 1: Global Nitromethane Market Value (US$ Mn) by Purity, 2022-2032 Figure 2: Global Nitromethane Market Value (US$ Mn) by Application, 2022-2032 Figure 3: Global Nitromethane Market Value (US$ Mn) by Region, 2022-2032 Figure 4: Global Nitromethane Market Value (US$ Mn) Analysis by Region, 2017-2032 Figure 5: Global Nitromethane Market Volume (Tons) Analysis by Region, 2017-2032 Figure 6: Global Nitromethane Market Value Share (%) and BPS Analysis by Region, 2022-2032 Figure 7: Global Nitromethane Market Y-o-Y Growth (%) Projections by Region, 2022-2032 Figure 8: Global Nitromethane Market Value (US$ Mn) Analysis by Purity, 2017-2032 Figure 9: Global Nitromethane Market Volume (Tons) Analysis by Purity, 2017-2032 Figure 10: Global Nitromethane Market Value Share (%) and BPS Analysis by Purity, 2022-2032 Figure 11: Global Nitromethane Market Y-o-Y Growth (%) Projections by Purity, 2022-2032 Figure 12: Global Nitromethane Market Value (US$ Mn) Analysis by Application, 2017-2032 Figure 13: Global Nitromethane Market Volume (Tons) Analysis by Application, 2017-2032 Figure 14: Global Nitromethane Market Value Share (%) and BPS Analysis by Application, 2022-2032 Figure 15: Global Nitromethane Market Y-o-Y Growth (%) Projections by Application, 2022-2032 Figure 16: Global Nitromethane Market Attractiveness by Purity, 2022-2032 Figure 17: Global Nitromethane Market Attractiveness by Application, 2022-2032 Figure 18: Global Nitromethane Market Attractiveness by Region, 2022-2032 Figure 19: North America Nitromethane Market Value (US$ Mn) by Purity, 2022-2032 Figure 20: North America Nitromethane Market Value (US$ Mn) by Application, 2022-2032 Figure 21: North America Nitromethane Market Value (US$ Mn) by Country, 2022-2032 Figure 22: North America Nitromethane Market Value (US$ Mn) Analysis by Country, 2017-2032 Figure 23: North America Nitromethane Market Volume (Tons) Analysis by Country, 2017-2032 Figure 24: North America Nitromethane Market Value Share (%) and BPS Analysis by Country, 2022-2032 Figure 25: North America Nitromethane Market Y-o-Y Growth (%) Projections by Country, 2022-2032 Figure 26: North America Nitromethane Market Value (US$ Mn) Analysis by Purity, 2017-2032 Figure 27: North America Nitromethane Market Volume (Tons) Analysis by Purity, 2017-2032 Figure 28: North America Nitromethane Market Value Share (%) and BPS Analysis by Purity, 2022-2032 Figure 29: North America Nitromethane Market Y-o-Y Growth (%) Projections by Purity, 2022-2032 Figure 30: North America Nitromethane Market Value (US$ Mn) Analysis by Application, 2017-2032 Figure 31: North America Nitromethane Market Volume (Tons) Analysis by Application, 2017-2032 Figure 32: North America Nitromethane Market Value Share (%) and BPS Analysis by Application, 2022-2032 Figure 33: North America Nitromethane Market Y-o-Y Growth (%) Projections by Application, 2022-2032 Figure 34: North America Nitromethane Market Attractiveness by Purity, 2022-2032 Figure 35: North America Nitromethane Market Attractiveness by Application, 2022-2032 Figure 36: North America Nitromethane Market Attractiveness by Country, 2022-2032 Figure 37: Latin America Nitromethane Market Value (US$ Mn) by Purity, 2022-2032 Figure 38: Latin America Nitromethane Market Value (US$ Mn) by Application, 2022-2032 Figure 39: Latin America Nitromethane Market Value (US$ Mn) by Country, 2022-2032 Figure 40: Latin America Nitromethane Market Value (US$ Mn) Analysis by Country, 2017-2032 Figure 41: Latin America Nitromethane Market Volume (Tons) Analysis by Country, 2017-2032 Figure 42: Latin America Nitromethane Market Value Share (%) and BPS Analysis by Country, 2022-2032 Figure 43: Latin America Nitromethane Market Y-o-Y Growth (%) Projections by Country, 2022-2032 Figure 44: Latin America Nitromethane Market Value (US$ Mn) Analysis by Purity, 2017-2032 Figure 45: Latin America Nitromethane Market Volume (Tons) Analysis by Purity, 2017-2032 Figure 46: Latin America Nitromethane Market Value Share (%) and BPS Analysis by Purity, 2022-2032 Figure 47: Latin America Nitromethane Market Y-o-Y Growth (%) Projections by Purity, 2022-2032 Figure 48: Latin America Nitromethane Market Value (US$ Mn) Analysis by Application, 2017-2032 Figure 49: Latin America Nitromethane Market Volume (Tons) Analysis by Application, 2017-2032 Figure 50: Latin America Nitromethane Market Value Share (%) and BPS Analysis by Application, 2022-2032 Figure 51: Latin America Nitromethane Market Y-o-Y Growth (%) Projections by Application, 2022-2032 Figure 52: Latin America Nitromethane Market Attractiveness by Purity, 2022-2032 Figure 53: Latin America Nitromethane Market Attractiveness by Application, 2022-2032 Figure 54: Latin America Nitromethane Market Attractiveness by Country, 2022-2032 Figure 55: Europe Nitromethane Market Value (US$ Mn) by Purity, 2022-2032 Figure 56: Europe Nitromethane Market Value (US$ Mn) by Application, 2022-2032 Figure 57: Europe Nitromethane Market Value (US$ Mn) by Country, 2022-2032 Figure 58: Europe Nitromethane Market Value (US$ Mn) Analysis by Country, 2017-2032 Figure 59: Europe Nitromethane Market Volume (Tons) Analysis by Country, 2017-2032 Figure 60: Europe Nitromethane Market Value Share (%) and BPS Analysis by Country, 2022-2032 Figure 61: Europe Nitromethane Market Y-o-Y Growth (%) Projections by Country, 2022-2032 Figure 62: Europe Nitromethane Market Value (US$ Mn) Analysis by Purity, 2017-2032 Figure 63: Europe Nitromethane Market Volume (Tons) Analysis by Purity, 2017-2032 Figure 64: Europe Nitromethane Market Value Share (%) and BPS Analysis by Purity, 2022-2032 Figure 65: Europe Nitromethane Market Y-o-Y Growth (%) Projections by Purity, 2022-2032 Figure 66: Europe Nitromethane Market Value (US$ Mn) Analysis by Application, 2017-2032 Figure 67: Europe Nitromethane Market Volume (Tons) Analysis by Application, 2017-2032 Figure 68: Europe Nitromethane Market Value Share (%) and BPS Analysis by Application, 2022-2032 Figure 69: Europe Nitromethane Market Y-o-Y Growth (%) Projections by Application, 2022-2032 Figure 70: Europe Nitromethane Market Attractiveness by Purity, 2022-2032 Figure 71: Europe Nitromethane Market Attractiveness by Application, 2022-2032 Figure 72: Europe Nitromethane Market Attractiveness by Country, 2022-2032 Figure 73: East Asia Nitromethane Market Value (US$ Mn) by Purity, 2022-2032 Figure 74: East Asia Nitromethane Market Value (US$ Mn) by Application, 2022-2032 Figure 75: East Asia Nitromethane Market Value (US$ Mn) by Country, 2022-2032 Figure 76: East Asia Nitromethane Market Value (US$ Mn) Analysis by Country, 2017-2032 Figure 77: East Asia Nitromethane Market Volume (Tons) Analysis by Country, 2017-2032 Figure 78: East Asia Nitromethane Market Value Share (%) and BPS Analysis by Country, 2022-2032 Figure 79: East Asia Nitromethane Market Y-o-Y Growth (%) Projections by Country, 2022-2032 Figure 80: East Asia Nitromethane Market Value (US$ Mn) Analysis by Purity, 2017-2032 Figure 81: East Asia Nitromethane Market Volume (Tons) Analysis by Purity, 2017-2032 Figure 82: East Asia Nitromethane Market Value Share (%) and BPS Analysis by Purity, 2022-2032 Figure 83: East Asia Nitromethane Market Y-o-Y Growth (%) Projections by Purity, 2022-2032 Figure 84: East Asia Nitromethane Market Value (US$ Mn) Analysis by Application, 2017-2032 Figure 85: East Asia Nitromethane Market Volume (Tons) Analysis by Application, 2017-2032 Figure 86: East Asia Nitromethane Market Value Share (%) and BPS Analysis by Application, 2022-2032 Figure 87: East Asia Nitromethane Market Y-o-Y Growth (%) Projections by Application, 2022-2032 Figure 88: East Asia Nitromethane Market Attractiveness by Purity, 2022-2032 Figure 89: East Asia Nitromethane Market Attractiveness by Application, 2022-2032 Figure 90: East Asia Nitromethane Market Attractiveness by Country, 2022-2032 Figure 91: South Asia & Pacific Nitromethane Market Value (US$ Mn) by Purity, 2022-2032 Figure 92: South Asia & Pacific Nitromethane Market Value (US$ Mn) by Application, 2022-2032 Figure 93: South Asia & Pacific Nitromethane Market Value (US$ Mn) by Country, 2022-2032 Figure 94: South Asia & Pacific Nitromethane Market Value (US$ Mn) Analysis by Country, 2017-2032 Figure 95: South Asia & Pacific Nitromethane Market Volume (Tons) Analysis by Country, 2017-2032 Figure 96: South Asia & Pacific Nitromethane Market Value Share (%) and BPS Analysis by Country, 2022-2032 Figure 97: South Asia & Pacific Nitromethane Market Y-o-Y Growth (%) Projections by Country, 2022-2032 Figure 98: South Asia & Pacific Nitromethane Market Value (US$ Mn) Analysis by Purity, 2017-2032 Figure 99: South Asia & Pacific Nitromethane Market Volume (Tons) Analysis by Purity, 2017-2032 Figure 100: South Asia & Pacific Nitromethane Market Value Share (%) and BPS Analysis by Purity, 2022-2032 Figure 101: South Asia & Pacific Nitromethane Market Y-o-Y Growth (%) Projections by Purity, 2022-2032 Figure 102: South Asia & Pacific Nitromethane Market Value (US$ Mn) Analysis by Application, 2017-2032 Figure 103: South Asia & Pacific Nitromethane Market Volume (Tons) Analysis by Application, 2017-2032 Figure 104: South Asia & Pacific Nitromethane Market Value Share (%) and BPS Analysis by Application, 2022-2032 Figure 105: South Asia & Pacific Nitromethane Market Y-o-Y Growth (%) Projections by Application, 2022-2032 Figure 106: South Asia & Pacific Nitromethane Market Attractiveness by Purity, 2022-2032 Figure 107: South Asia & Pacific Nitromethane Market Attractiveness by Application, 2022-2032 Figure 108: South Asia & Pacific Nitromethane Market Attractiveness by Country, 2022-2032 Figure 109: MEA Nitromethane Market Value (US$ Mn) by Purity, 2022-2032 Figure 110: MEA Nitromethane Market Value (US$ Mn) by Application, 2022-2032 Figure 111: MEA Nitromethane Market Value (US$ Mn) by Country, 2022-2032 Figure 112: MEA Nitromethane Market Value (US$ Mn) Analysis by Country, 2017-2032 Figure 113: MEA Nitromethane Market Volume (Tons) Analysis by Country, 2017-2032 Figure 114: MEA Nitromethane Market Value Share (%) and BPS Analysis by Country, 2022-2032 Figure 115: MEA Nitromethane Market Y-o-Y Growth (%) Projections by Country, 2022-2032 Figure 116: MEA Nitromethane Market Value (US$ Mn) Analysis by Purity, 2017-2032 Figure 117: MEA Nitromethane Market Volume (Tons) Analysis by Purity, 2017-2032 Figure 118: MEA Nitromethane Market Value Share (%) and BPS Analysis by Purity, 2022-2032 Figure 119: MEA Nitromethane Market Y-o-Y Growth (%) Projections by Purity, 2022-2032 Figure 120: MEA Nitromethane Market Value (US$ Mn) Analysis by Application, 2017-2032 Figure 121: MEA Nitromethane Market Volume (Tons) Analysis by Application, 2017-2032 Figure 122: MEA Nitromethane Market Value Share (%) and BPS Analysis by Application, 2022-2032 Figure 123: MEA Nitromethane Market Y-o-Y Growth (%) Projections by Application, 2022-2032 Figure 124: MEA Nitromethane Market Attractiveness by Purity, 2022-2032 Figure 125: MEA Nitromethane Market Attractiveness by Application, 2022-2032 Figure 126: MEA Nitromethane Market Attractiveness by Country, 2022-2032
Recommendations
Explore Chemicals & Materials Insights
View Reports