Nootkatone Market Outlook (2023 to 2033)

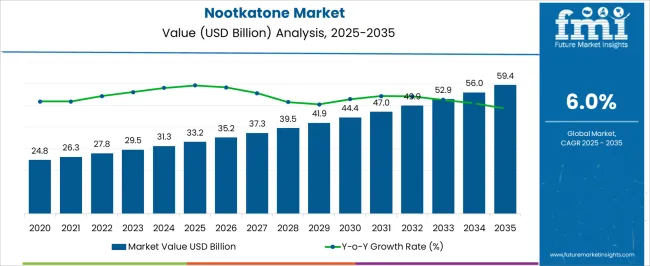
The global nootkatone market size is expected to grow from US$ 29,513.7 Thousand in 2023 to US$ 49,490.8 Thousand by 2033, with overall sales accelerating at a robust CAGR of 6.0% throughout the forecast period. Increasing applications in personal care, food & beverages, insect repellents, and home care is a key factor driving demand for nootkatone.

Nootkatone is a natural organic substance that is regarded as one of the most important and expensive aromatics of grapefruit. This compound is responsible for the characteristic scent of grapefruit.

In recent years nootkatone has gained immense traction globally due to its widening applications across various industries. It is being increasingly used for making insecticides or incest repellents. In fact, it has become one of the most popular eco-friendly insecticides as it does not persist in the environment due to its volatile nature. Driven by this demand for nootkatone will rise at a strong pace over the assessment period.

Similarly, because of its extremely potent grapefruit aroma and hardwood top note, nootkatone is becoming more popular in the food and beverage industry. It is being gradually used as a natural food flavor in a wide range of beverages and food products to improve their aroma and taste. Thus, increasing the usage of nootkatone in the food and beverage industry will boost the market during the forecast period.

Furthermore, the growing popularity of nootkatone in the men's perfume industry and the increasing penetration of e-commerce and online shopping platforms are expected to create opportunities for the leading nootkatone manufacturers over the next ten years.

Increasing Demand for Vegan Food Products Globally to Create Prospects for Manufacturers

Veganism is a growing global dietary trend. People choose plant-based diets for a variety of reasons, the three most important of which are animal suffering, environmental protection, and personal health. They are becoming strict vegan, vegetarian, and flexitarian as their concerns about some of these factors grow.

Plant-based meal products and ingredients are becoming increasingly popular in regions like Europe and North America. Food aroma and fragrance increase the sensation of pleasure, arouse appetite, promote saliva secretion, and improve digestion and nutrient absorption. As a result, flavors and aromas are essential components of food.

Natural plant-based nootkatone not only has a distinct aroma, but also has significant pharmacological effects due to its antioxidant, antibacterial, and antimutagenic properties. As a result, this natural flavoring agent finds applications in the food and beverage industry.

Attribute Key Insights
Nootkatone Market Estimated Value (2023) US$ 29,513.7 Thousand
Projected Market Value (2033) US$ 49,490.8 Thousand
Value-based CAGR (2023 to 2033) 6.0%
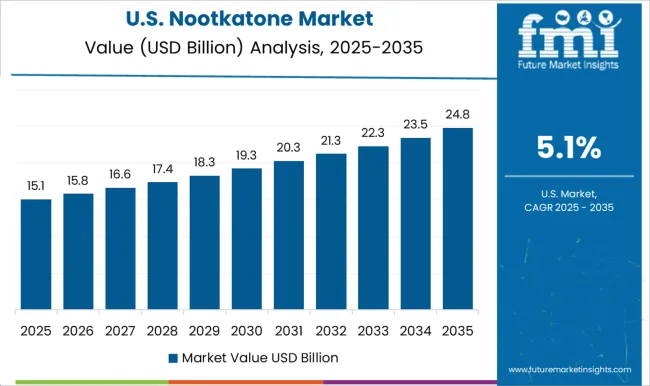
CAGR of USA 2.8%

Don't pay for what you don't need

Customize your report by selecting specific countries or regions and save 30%!

2017 to 2021 Nootkatone Market Outlook Compared to 2022 to 2032 Forecast

The global market for nootkatone is projected to grow at a healthy CAGR of 6.0% between 2023 and 2033 in comparison to the 4.0% CAGR registered during the historical period from 2017 to 2022.

The rising application of nootkatone across diverse industries including food & beverages, personal care & cosmetics, and homecare is a key factor expected to boost sales of nootkatone during the forecast period.

The health-benefiting nutritional properties of nootkatone and increasing awareness among consumers about healthy eating habits are prompting food manufacturers to add this nutritional food additive to their products. Manufacturers in the citrus fiber industry are coming up with healthier energy drinks with citrus food additives and protein powders with improved gelling properties. Such wide applications will lead to a surge in demand for nootkatone products.

Citrus fruits are a rich source of minerals, essential vitamins, and other nutrients. Therefore, citrus fruits like grapefruit, orange, and lemon that are used to make nootkatone are significantly utilized in pharmaceutical and nutraceutical applications. This is expected to enhance the growth of the nootkatone market over the forecast period. Nootkatone functions as an oil stabilizer and emulsifier and enhances the shelf life of beverages as well as enhances their taste.

Technological innovations in the production of citrus ingredients, their properties such as solubility and thermal stability, and their functions as binding agents and emulsifiers have opened many opportunities for citrus fiber products’ use in bakery products, plant-based food and beverages, ready-to-eat food and beverages, personal care, cosmetic products, pharmaceutical products, and many more. The increased usage of citrus fiber products in new areas has boosted the citrus fiber market globally, which is driven by the use of ingredients and food additives like nootkatone.

Nootkatone Market

What are the Key Trends Shaping the Nootkatone Industry?

Consumers’ Inclination Toward Flavored Products Boosting Nootkatone Market

Consumers are increasingly interested in flavored products. This has increased in the production of food color remedies such as nootkatone, which are stable and offer a two-color blend. Thus, growing demand for flavored food products and beverages across the HoReCa sector due to changing consumer preferences will continue to fuel sales of nootkatone.

Furthermore, manufacturers' development of various emerging innovations for the formation of water-miscible solutions for foods and beverages is expected to aid the expansion of the nootkatone market.

Rising Trend of Using Organic and Natural Products to Help Market Thrive

Purchasers continue to express health-related concerns and limit their consumption of foods that contain synthetic chemicals, chemicals, or synthetic additives. To maintain a healthy lifestyle, consumers prefer natural and natural food products. Consequently, food manufacturers are also showing a keen inclination towards using natural ingredients like nootkatone in their products. This will help the global nootkatone industry to thrive over the next ten years.

Growing Preference for Clean-labeled Products Likely to Boost Nootkatone Sales

Consumers today pay close attention to product ingredient lists and labels and want a higher level of control in their diet. For food manufacturers, clean-label means providing simplified, easy-to-understand lists of ingredients that do not include ingredients that are obscure or unpopular.

According to an International Ingredients Solutions company, around 80% of consumers in the world want to help create a healthier society by identifying all-natural ingredients on their food packages. Around 17 countries both physically and electronically surveyed consumers from 2007 to 2017 and they found that around 80% of consumers from these locations feel that a brief and simple list of ingredients on their food packages is important.
Nandini Roy Choudhury

Principal Consultant

Talk to Analyst

Find your sweet spots for generating winning opportunities in this market.

Country-wise Insights

How is the USA Nootkatone Industry Performing?

Rising Usage of Nootkatone in Perfumes to Boost Sales in the USA

As per FMI, the USA nootkatone market is poised to exhibit strong growth on the back of increasing usage of nootkatone in the perfume industry. Nootkatone has a wide range of uses, from repelling insects to being used as a fragrant ingredient in perfumes. While its use is not yet widespread, nootkatone has great potential to become a common household item in the USA

Nootkatone is a naturally-occurring substance found in Alaska and Canada. It has a strong scent that repels insects, making it ideal for use in bug sprays and other insect-repelling products. It is being increasingly used by companies as a fragrant ingredient in perfumes and other personal care products.
Why is Germany Becoming an Opportunistic Market for Nootkatone Manufacturers?

Growing Demand for Natural Insect Repellents Boosting Market in Germany

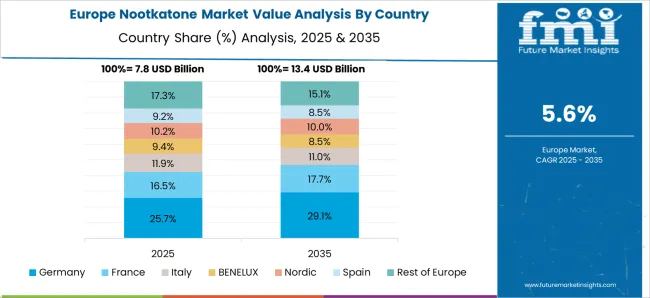
With consumers constantly looking for natural and safer insect repellents, demand for nootkatone across Germany is projected to grow at a healthy pace during the next ten years.

Nootkatone is a natural product found in the essential oils of grapefruit and other citrus fruits. It has a wide range of uses, including food flavoring, fragrance, and insect repellent. In recent years, nootkatone has become increasingly popular across Germany as an alternative to DEET, the synthetic chemical compound that is currently the gold standard for mosquito repellents.

Nootkatone is more effective than DEET at repelling mosquitoes and other insects, and it is also safer for humans and the environment. The majority of the world's nootkatone supply comes from China. However, German company Eckart GmbH has been working to increase its production of nootkatone in order to corner the European market.

What Makes the United Kingdom a Prominent Market for Nootkatone?

Increasing Application in Cosmetics and Personal Care Industry Propelling Demand in the United Kingdom

In recent years, the United Kingdom has become the fastest-growing market for nootkatone, a naturally occurring compound that gives grapefruits their characteristic flavor. This can be attributed to the rising usage of nootkatone in personal care and cosmetics products and increasing consumer spending on these products.

Nootkatone is used in a variety of products, including cosmetics, food flavorings, and fragrances. Nootkatone was first isolated from grapefruit peel in the 1930s, but it was not until the early 2000s that its potential as a commercial product was realized. In 2004, a Japanese company began selling a Nootkatone-based fragrance, and since then, sales of Nootkatone products have steadily increased. The United Kingdom is now the largest market for nootkatone products outside of Japan, and demand is growing rapidly.

Category-wise Insights

Why is the Demand for Organic Nootkatone Rising in the Market?

Growing Trend of Veganism Propelling Demand for Natural Nootkatone

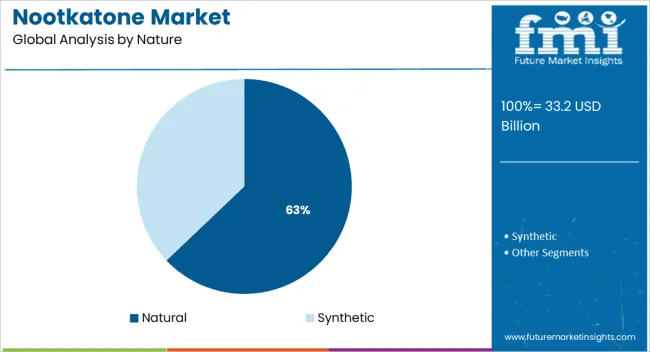
Based on nature, the global market for nootkatone is segmented into natural and synthetic. Among these, the natural segment is likely to grow at a higher CAGR during the forecast period. This can be attributed to the rising consumer preference for natural products.

Veganism is a growing global dietary trend. People choose plant-based diets for a variety of reasons, the three most important of which are animal suffering, environmental protection, and personal health. People are becoming strict vegan, vegetarian, and flexitarian as their concerns about some of these factors grow. As a result, they are choosing natural plant-based nootkatone over a synthetic ones.

Similarly, rising health concerns are playing a key role in prompting consumers to opt for natural products. Consumers continue to express health-related concerns and limit their consumption of foods that contain synthetic chemicals, chemicals, or synthetic additives. They prefer natural and natural food products. Consequently, food manufacturers are also increasing their usage of natural ingredients
Get the data you need at a Fraction of the cost

Personalize your report by choosing insights you need
and save 40%!

Competitive Landscape

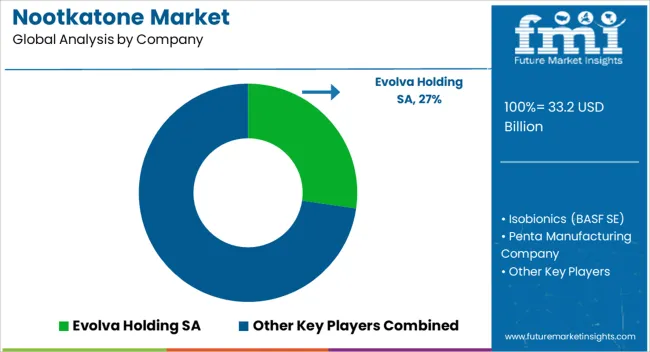
Key players operating the market for nootkatone include Evolva Holding SA, Isobionics (BASF SE), Penta Manufacturing Company, Vigon International, Inc, Moellhausen S.p.A., Fine Fragrances Pvt. Ltd. Florida Worldwide Citrus Products Group, Inc., The Flavored Herb.

Most of the players are focused on introducing high-quality products with high nutritional content and sustainable features in the market. New players on the other hand are concentrating on incorporating more advanced processing technologies, which are not just economical but also environmentally friendly as well. Some of the recent developments in this market space are given below:

In June 20200 Givaudan, a global leader in taste and wellbeing, and Manus Bio, a leading biomanufacturer of natural products, launched BioNootkatone, a sustainable, clean-label citrus ingredient with a natural taste that can be used in a variety of food and beverages.

In 2019, BASF entered into natural flavors and fragrances with the acquisition of Isobionics, an innovative leader in biotechnology that serves the global market for natural flavors and fragrances.

Nootkatone Market Report Scope

Attribute Details
Estimated Market Size (2023) US$ 29,513.7 Thousand
Projected Market Size (2023 to 2033) US$ 49,490.8 Thousand
Anticipated Growth Rate (2023 to 2033) 6.0% CAGR
Forecast Period 2023 to 2033
Historical Data Available for 2017 to 2022
Market Analysis US$ Thousand for Value and Units for Volume
Key Regions Covered
  • North America
  • Latin America
  • Europe
  • Asia Pacific
  • Oceania
  • Middle East and Africa(MEA)
Key Countries Covered
  • USA
  • Canada
  • Mexico
  • Germany
  • United Kingdom
  • France
  • Italy
  • Spain
  • China
  • Japan
  • India
  • South Korea
  • Australia
  • Brazil
  • Argentina
  • South Africa
  • United Arab Emirates(UAE)
Key Segments Covered
  • Purity Grade
  • Form
  • Nature
  • Application
  • Region
Key Companies Profiled
Report Coverage Market Forecast, Company Share Analysis, Competitive Landscape, Drivers, Restraints, Opportunities and Threats Analysis, Market Dynamics and Challenges, and Strategic Growth Initiatives

Nootkatone Industry by Category

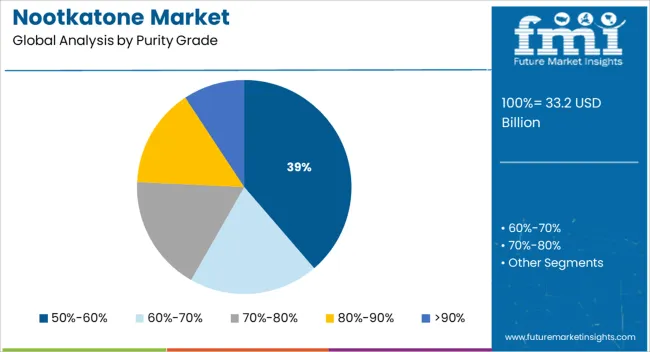
By Purity Grade:

  • 50%-60%
  • 60%-70%
  • 70%-80%
  • 80%-90%
  • >90%

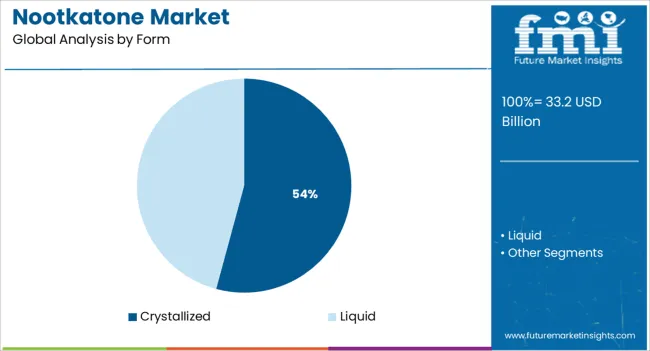
By Form:

  • Crystallized
  • Liquid

By Nature:

  • Natural
  • Synthetic

By Application:

  • Food & Beverage
  • Personal Care
  • Home Care

By Region:

  • North America
  • Latin America
  • Europe
  • East Asia
  • South Asia
  • Oceania
  • Middle East and Africa(MEA)

Frequently Asked Questions

How big is the nootkatone market?

The nootkatone market size is expected to reach US$29,513 Thousand in 2023.

At what rate is the global market for nootkatone expected to rise between 2023 and 2033?

Between 2023 and 2033, the global market for nootkatone is expected to rise at a CAGR of 6.0%.

What is the projected valuation for the nootkatone industry?

The global nootkatone industry is forecast to surpass a valuation of US$ 49,490.8 Thousand by the end of 2033.

What is the North America Market Performing?

North America is expected to hold around 38% share of the global nootkatone industry during the forecast period.

Which are the major countries driving demand for nootkatone?

The USA, China, Canada, Germany, and Mexico are the major countries driving demand for nootkatone.

At what rate will the demand for nootkatone rise in China?

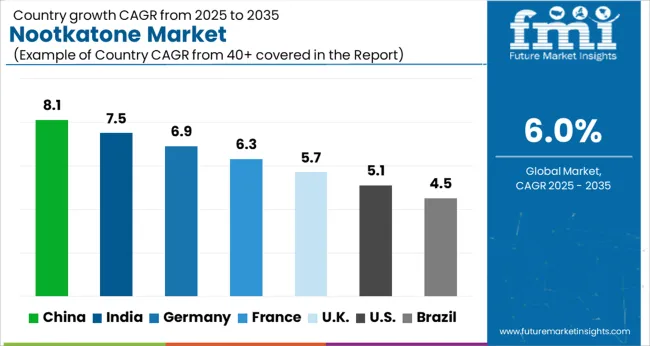
Demand for nootkatone across China is projected to grow at a CAGR of 4% during the forecast period.

What is the sales prospect for the United Kingdom market?

Sales of nootkatone in the United Kingdom are projected to grow at a CAGR of 2% between 2023 and 2033.

At what rate will the market for nootkatone grow in India?

The overall market for nootkatone in India is projected to grow at 5% CAGR over the next ten years.

What is the demand outlook for Japan’s market?

Demand for nootkatone in Japan is expected to increase by 6% between 2023 and 2033.

At what rate will nootkatone market demand grow in Australia?

Demand for nootkatone across Australia is expected to rise by 10% during the assessment period.

Table of Content
1. Executive Summary | Nootkatone Market
    1.1. GlobalMarket Outlook
    1.2. Demand-side Trends
    1.3. Supply-side Trends
    1.4. Technology Roadmap Analysis
    1.5. Analysis and Recommendations
2. Market Overview
    2.1. Market Coverage / Taxonomy
    2.2. Market Definition / Scope / Limitations
3. Market Background
    3.1. Market Dynamics
        3.1.1. Drivers
        3.1.2. Restraints
        3.1.3. Opportunity
        3.1.4. Trends
    3.2. Scenario Forecast
        3.2.1. Demand in Optimistic Scenario
        3.2.2. Demand in Likely Scenario
        3.2.3. Demand in Conservative Scenario
    3.3. Product launches & Recent Developments
    3.4. Product Life Cycle Analysis
    3.5. Value Chain Analysis
        3.5.1. Supply Side Participants and their Roles
            3.5.1.1. Producers
            3.5.1.2. Mid-Level Participants (Traders/ Agents/ Brokers)
            3.5.1.3. Wholesalers and Distributors
        3.5.2. % of Operating Margin Analysis
        3.5.3. List of Raw Material Suppliers
        3.5.4. List of Existing and Potential Buyers
    3.6. Global Market - Pricing Analysis
        3.6.1. Price Point Assessment by Region
        3.6.2. Price Point Assessment by Product Type
        3.6.3. Price Forecast till 2033
        3.6.4. Factors affecting pricing
    3.7. Forecast Factors - Relevance & Impact
    3.8. PESTLE and Porter’s Analysis
    3.9. Regulatory Landscape
        3.9.1. Packaging & Labelling Regulations
        3.9.2. Certifications and Certifying Agency Overview
        3.9.3. Import/Export Policies
    3.10. Regional Parent Market Outlook
    3.11. Production and Consumption Statistics
    3.12. Import and Export Statistics
    3.13. Consumers Survey Analysis
    3.14. Macro-Economic Factors
    3.15. Product Claims & Nutritional Information scanned by Buyers
4. Global Market Analysis 2017 to 2022 and Forecast, 2023 to 2033
    4.1. Historical Market Size Value (US$ Thousand) & Volume (KG) Analysis, 2017 to 2022
    4.2. Current and Future Market Size Value (US$ Thousand) & Volume (KG) Projections, 2023 to 2033
        4.2.1. Y-o-Y Growth Trend Analysis
        4.2.2. Absolute $ Opportunity Analysis
5. Global Market Analysis 2017 to 2022 and Forecast 2023 to 2033, By Purity grade
    5.1. Introduction / Key Findings
    5.2. Historical Market Size Value (US$ Thousand) & Volume (KG) Analysis By Purity grade, 2017 to 2022
    5.3. Current and Future Market Size Value (US$ Thousand) & Volume (KG) Analysis and Forecast By Purity grade, 2023 to 2033
        5.3.1. 50%-60%
        5.3.2. 60%-70%
        5.3.3. 70%-80%
        5.3.4. 80%-90%
        5.3.5. >90%
    5.4. Y-o-Y Growth Trend Analysis By Purity grade, 2017 to 2022
    5.5. Absolute $ Opportunity Analysis By Purity grade, 2023 to 2033
6. Global Market Analysis 2017 to 2022 and Forecast 2023 to 2033, By Application
    6.1. Introduction / Key Findings
    6.2. Historical Market Size Value (US$ Thousand) & Volume (KG) Analysis By Application, 2017 to 2022
    6.3. Current and Future Market Size Value (US$ Thousand) & Volume (KG) Analysis and Forecast By Application, 2023 to 2033
        6.3.1. Food & Beverage
        6.3.2. Personal Care
        6.3.3. Home Care
    6.4. Y-o-Y Growth Trend Analysis By Application, 2017 to 2022
    6.5. Absolute $ Opportunity Analysis By Application, 2023 to 2033
7. Global Market Analysis 2017 to 2022 and Forecast 2023 to 2033, By Form
    7.1. Introduction / Key Findings
    7.2. Historical Market Size Value (US$ Thousand) & Volume (KG) Analysis By Form, 2017 to 2022
    7.3. Current and Future Market Size Value (US$ Thousand) & Volume (KG) Analysis and Forecast By Form, 2023 to 2033
        7.3.1. Crystallized
        7.3.2. Liquid
    7.4. Y-o-Y Growth Trend Analysis By Form, 2017 to 2022
    7.5. Absolute $ Opportunity Analysis By Form, 2023 to 2033
8. Global Market Analysis 2017 to 2022 and Forecast 2023 to 2033, By Nature
    8.1. Introduction / Key Findings
    8.2. Historical Market Size Value (US$ Thousand) & Volume (KG) Analysis By Nature, 2017 to 2022
    8.3. Current and Future Market Size Value (US$ Thousand) & Volume (KG) Analysis and Forecast By Nature, 2023 to 2033
        8.3.1. Natural
        8.3.2. Synthetic
    8.4. Y-o-Y Growth Trend Analysis By Nature, 2017 to 2022
    8.5. Absolute $ Opportunity Analysis By Nature, 2023 to 2033
9. Global Market Analysis 2017 to 2022 and Forecast 2023 to 2033, By Region
    9.1. Introduction
    9.2. Historical Market Size Value (US$ Thousand) & Volume (KG) Analysis By Region, 2017 to 2022
    9.3. Current Market Size Value (US$ Thousand) & Volume (KG) Analysis and Forecast By Region, 2023 to 2033
        9.3.1. North America
        9.3.2. Latin America
        9.3.3. Europe
        9.3.4. East Asia
        9.3.5. South Asia
        9.3.6. Oceania
        9.3.7. Middle East and Africa(MEA)
    9.4. Market Attractiveness Analysis By Region
10. North America Market Analysis 2017 to 2022 and Forecast 2023 to 2033, By Country
    10.1. Historical Market Size Value (US$ Thousand) & Volume (KG) Trend Analysis By Market Taxonomy, 2017 to 2022
    10.2. Market Size Value (US$ Thousand) & Volume (KG) Forecast By Market Taxonomy, 2023 to 2033
        10.2.1. By Country
            10.2.1.1. USA
            10.2.1.2. Canada
        10.2.2. By Purity grade
        10.2.3. By Application
        10.2.4. By Form
        10.2.5. By Nature
    10.3. Market Attractiveness Analysis
        10.3.1. By Country
        10.3.2. By Purity grade
        10.3.3. By Application
        10.3.4. By Form
        10.3.5. By Nature
    10.4. Key Takeaways
11. Latin America Market Analysis 2017 to 2022 and Forecast 2023 to 2033, By Country
    11.1. Historical Market Size Value (US$ Thousand) & Volume (KG) Trend Analysis By Market Taxonomy, 2017 to 2022
    11.2. Market Size Value (US$ Thousand) & Volume (KG) Forecast By Market Taxonomy, 2023 to 2033
        11.2.1. By Country
            11.2.1.1. Brazil
            11.2.1.2. Mexico
            11.2.1.3. Argentina
            11.2.1.4. Chile
            11.2.1.5. Peru
            11.2.1.6. Rest of Latin America
        11.2.2. By Purity grade
        11.2.3. By Application
        11.2.4. By Form
        11.2.5. By Nature
    11.3. Market Attractiveness Analysis
        11.3.1. By Country
        11.3.2. By Purity grade
        11.3.3. By Application
        11.3.4. By Form
        11.3.5. By Nature
    11.4. Key Takeaways
12. Europe Market Analysis 2017 to 2022 and Forecast 2023 to 2033, By Country
    12.1. Historical Market Size Value (US$ Thousand) & Volume (KG) Trend Analysis By Market Taxonomy, 2017 to 2022
    12.2. Market Size Value (US$ Thousand) & Volume (KG) Forecast By Market Taxonomy, 2023 to 2033
        12.2.1. By Country
            12.2.1.1. Germany
            12.2.1.2. Italy
            12.2.1.3. France
            12.2.1.4. United Kingdom
            12.2.1.5. Spain
            12.2.1.6. Russia
            12.2.1.7. BENELUX
            12.2.1.8. Poland
            12.2.1.9. Nordic Countries
            12.2.1.10. Rest of Europe
        12.2.2. By Purity grade
        12.2.3. By Application
        12.2.4. By Form
        12.2.5. By Nature
    12.3. Market Attractiveness Analysis
        12.3.1. By Country
        12.3.2. By Purity grade
        12.3.3. By Application
        12.3.4. By Form
        12.3.5. By Nature
    12.4. Key Takeaways
13. East Asia Market Analysis 2017 to 2022 and Forecast 2023 to 2033, By Country
    13.1. Historical Market Size Value (US$ Thousand) & Volume (KG) Trend Analysis By Market Taxonomy, 2017 to 2022
    13.2. Market Size Value (US$ Thousand) & Volume (KG) Forecast By Market Taxonomy, 2023 to 2033
        13.2.1. By Country
            13.2.1.1. China
            13.2.1.2. Japan
            13.2.1.3. South Korea
        13.2.2. By Purity grade
        13.2.3. By Application
        13.2.4. By Form
        13.2.5. By Nature
    13.3. Market Attractiveness Analysis
        13.3.1. By Country
        13.3.2. By Purity grade
        13.3.3. By Application
        13.3.4. By Form
        13.3.5. By Nature
    13.4. Key Takeaways
14. South Asia Market Analysis 2017 to 2022 and Forecast 2023 to 2033, By Country
    14.1. Historical Market Size Value (US$ Thousand) & Volume (KG) Trend Analysis By Market Taxonomy, 2017 to 2022
    14.2. Market Size Value (US$ Thousand) & Volume (KG) Forecast By Market Taxonomy, 2023 to 2033
        14.2.1. By Country
            14.2.1.1. India
            14.2.1.2. Thailand
            14.2.1.3. Malaysia
            14.2.1.4. Indonesia
            14.2.1.5. Singapore
            14.2.1.6. Rest of South Asia
        14.2.2. By Purity grade
        14.2.3. By Application
        14.2.4. By Form
        14.2.5. By Nature
    14.3. Market Attractiveness Analysis
        14.3.1. By Country
        14.3.2. By Purity grade
        14.3.3. By Application
        14.3.4. By Form
        14.3.5. By Nature
    14.4. Key Takeaways
15. Oceania Market Analysis 2017 to 2022 and Forecast 2023 to 2033, By Country
    15.1. Historical Market Size Value (US$ Thousand) & Volume (KG) Trend Analysis By Market Taxonomy, 2017 to 2022
    15.2. Market Size Value (US$ Thousand) & Volume (KG) Forecast By Market Taxonomy, 2023 to 2033
        15.2.1. By Country
            15.2.1.1. Australia
            15.2.1.2. New Zealand
        15.2.2. By Purity grade
        15.2.3. By Application
        15.2.4. By Form
        15.2.5. By Nature
    15.3. Market Attractiveness Analysis
        15.3.1. By Country
        15.3.2. By Purity grade
        15.3.3. By Application
        15.3.4. By Form
        15.3.5. By Nature
    15.4. Key Takeaways
16. MEA Market Analysis 2017 to 2022 and Forecast 2023 to 2033, By Country
    16.1. Historical Market Size Value (US$ Thousand) & Volume (KG) Trend Analysis By Market Taxonomy, 2017 to 2022
    16.2. Market Size Value (US$ Thousand) & Volume (KG) Forecast By Market Taxonomy, 2023 to 2033
        16.2.1. By Country
            16.2.1.1. GCC Countries
            16.2.1.2. South Africa
            16.2.1.3. Central Africa
            16.2.1.4. North Africa
        16.2.2. By Purity grade
        16.2.3. By Application
        16.2.4. By Form
        16.2.5. By Nature
    16.3. Market Attractiveness Analysis
        16.3.1. By Country
        16.3.2. By Purity grade
        16.3.3. By Application
        16.3.4. By Form
        16.3.5. By Nature
    16.4. Key Takeaways
17. Key Countries Market Analysis
    17.1. USA
        17.1.1. Pricing Analysis
        17.1.2. Market Share Analysis, 2023
            17.1.2.1. By Purity grade
            17.1.2.2. By Application
            17.1.2.3. By Form
            17.1.2.4. By Nature
    17.2. Canada
        17.2.1. Pricing Analysis
        17.2.2. Market Share Analysis, 2023
            17.2.2.1. By Purity grade
            17.2.2.2. By Application
            17.2.2.3. By Form
            17.2.2.4. By Nature
    17.3. Brazil
        17.3.1. Pricing Analysis
        17.3.2. Market Share Analysis, 2023
            17.3.2.1. By Purity grade
            17.3.2.2. By Application
            17.3.2.3. By Form
            17.3.2.4. By Nature
    17.4. Mexico
        17.4.1. Pricing Analysis
        17.4.2. Market Share Analysis, 2023
            17.4.2.1. By Purity grade
            17.4.2.2. By Application
            17.4.2.3. By Form
            17.4.2.4. By Nature
    17.5. Argentina
        17.5.1. Pricing Analysis
        17.5.2. Market Share Analysis, 2023
            17.5.2.1. By Purity grade
            17.5.2.2. By Application
            17.5.2.3. By Form
            17.5.2.4. By Nature
    17.6. Chile
        17.6.1. Pricing Analysis
        17.6.2. Market Share Analysis, 2023
            17.6.2.1. By Purity grade
            17.6.2.2. By Application
            17.6.2.3. By Form
            17.6.2.4. By Nature
    17.7. Peru
        17.7.1. Pricing Analysis
        17.7.2. Market Share Analysis, 2023
            17.7.2.1. By Purity grade
            17.7.2.2. By Application
            17.7.2.3. By Form
            17.7.2.4. By Nature
    17.8. Germany
        17.8.1. Pricing Analysis
        17.8.2. Market Share Analysis, 2023
            17.8.2.1. By Purity grade
            17.8.2.2. By Application
            17.8.2.3. By Form
            17.8.2.4. By Nature
    17.9. Italy
        17.9.1. Pricing Analysis
        17.9.2. Market Share Analysis, 2023
            17.9.2.1. By Purity grade
            17.9.2.2. By Application
            17.9.2.3. By Form
            17.9.2.4. By Nature
    17.10. France
        17.10.1. Pricing Analysis
        17.10.2. Market Share Analysis, 2023
            17.10.2.1. By Purity grade
            17.10.2.2. By Application
            17.10.2.3. By Form
            17.10.2.4. By Nature
    17.11. Spain
        17.11.1. Pricing Analysis
        17.11.2. Market Share Analysis, 2023
            17.11.2.1. By Purity grade
            17.11.2.2. By Application
            17.11.2.3. By Form
            17.11.2.4. By Nature
    17.12. United Kingdom
        17.12.1. Pricing Analysis
        17.12.2. Market Share Analysis, 2023
            17.12.2.1. By Purity grade
            17.12.2.2. By Application
            17.12.2.3. By Form
            17.12.2.4. By Nature
    17.13. Russia
        17.13.1. Pricing Analysis
        17.13.2. Market Share Analysis, 2023
            17.13.2.1. By Purity grade
            17.13.2.2. By Application
            17.13.2.3. By Form
            17.13.2.4. By Nature
    17.14. Poland
        17.14.1. Pricing Analysis
        17.14.2. Market Share Analysis, 2023
            17.14.2.1. By Purity grade
            17.14.2.2. By Application
            17.14.2.3. By Form
            17.14.2.4. By Nature
    17.15. BENELUX
        17.15.1. Pricing Analysis
        17.15.2. Market Share Analysis, 2023
            17.15.2.1. By Purity grade
            17.15.2.2. By Application
            17.15.2.3. By Form
            17.15.2.4. By Nature
    17.16. Nordic Countries
        17.16.1. Pricing Analysis
        17.16.2. Market Share Analysis, 2023
            17.16.2.1. By Purity grade
            17.16.2.2. By Application
            17.16.2.3. By Form
            17.16.2.4. By Nature
    17.17. China
        17.17.1. Pricing Analysis
        17.17.2. Market Share Analysis, 2023
            17.17.2.1. By Purity grade
            17.17.2.2. By Application
            17.17.2.3. By Form
            17.17.2.4. By Nature
    17.18. Japan
        17.18.1. Pricing Analysis
        17.18.2. Market Share Analysis, 2023
            17.18.2.1. By Purity grade
            17.18.2.2. By Application
            17.18.2.3. By Form
            17.18.2.4. By Nature
    17.19. South Korea
        17.19.1. Pricing Analysis
        17.19.2. Market Share Analysis, 2023
            17.19.2.1. By Purity grade
            17.19.2.2. By Application
            17.19.2.3. By Form
            17.19.2.4. By Nature
    17.20. India
        17.20.1. Pricing Analysis
        17.20.2. Market Share Analysis, 2023
            17.20.2.1. By Purity grade
            17.20.2.2. By Application
            17.20.2.3. By Form
            17.20.2.4. By Nature
    17.21. Thailand
        17.21.1. Pricing Analysis
        17.21.2. Market Share Analysis, 2023
            17.21.2.1. By Purity grade
            17.21.2.2. By Application
            17.21.2.3. By Form
            17.21.2.4. By Nature
    17.22. Indonesia
        17.22.1. Pricing Analysis
        17.22.2. Market Share Analysis, 2023
            17.22.2.1. By Purity grade
            17.22.2.2. By Application
            17.22.2.3. By Form
            17.22.2.4. By Nature
    17.23. Malaysia
        17.23.1. Pricing Analysis
        17.23.2. Market Share Analysis, 2023
            17.23.2.1. By Purity grade
            17.23.2.2. By Application
            17.23.2.3. By Form
            17.23.2.4. By Nature
    17.24. Singapore
        17.24.1. Pricing Analysis
        17.24.2. Market Share Analysis, 2023
            17.24.2.1. By Purity grade
            17.24.2.2. By Application
            17.24.2.3. By Form
            17.24.2.4. By Nature
    17.25. Australia
        17.25.1. Pricing Analysis
        17.25.2. Market Share Analysis, 2023
            17.25.2.1. By Purity grade
            17.25.2.2. By Application
            17.25.2.3. By Form
            17.25.2.4. By Nature
    17.26. New Zealand
        17.26.1. Pricing Analysis
        17.26.2. Market Share Analysis, 2023
            17.26.2.1. By Purity grade
            17.26.2.2. By Application
            17.26.2.3. By Form
            17.26.2.4. By Nature
    17.27. GCC Countries
        17.27.1. Pricing Analysis
        17.27.2. Market Share Analysis, 2023
            17.27.2.1. By Purity grade
            17.27.2.2. By Application
            17.27.2.3. By Form
            17.27.2.4. By Nature
    17.28. South Africa
        17.28.1. Pricing Analysis
        17.28.2. Market Share Analysis, 2023
            17.28.2.1. By Purity grade
            17.28.2.2. By Application
            17.28.2.3. By Form
            17.28.2.4. By Nature
    17.29. North Africa
        17.29.1. Pricing Analysis
        17.29.2. Market Share Analysis, 2023
            17.29.2.1. By Purity grade
            17.29.2.2. By Application
            17.29.2.3. By Form
            17.29.2.4. By Nature
    17.30. Central Africa
        17.30.1. Pricing Analysis
        17.30.2. Market Share Analysis, 2023
            17.30.2.1. By Purity grade
            17.30.2.2. By Application
            17.30.2.3. By Form
            17.30.2.4. By Nature
18. Market Structure Analysis
    18.1. Competition Dashboard
    18.2. Competition Benchmarking
    18.3. Market Share Analysis of Top Players
        18.3.1. By Regional
        18.3.2. By Purity grade
        18.3.3. By Application
        18.3.4. By Form
        18.3.5. By Nature
19. Competition Analysis
    19.1. Competition Deep Dive
        19.1.1. Evolva Holding SA
            19.1.1.1. Overview
            19.1.1.2. Product Portfolio
            19.1.1.3. Profitability by Market Segments (Purity Grade/Application/Form/Nature/Region)
            19.1.1.4. Sales Footprint
            19.1.1.5. Strategy Overview
                19.1.1.5.1. Marketing Strategy
                19.1.1.5.2. Product Strategy
                19.1.1.5.3. Channel Strategy
        19.1.2. Isobionics (BASF SE)
            19.1.2.1. Overview
            19.1.2.2. Product Portfolio
            19.1.2.3. Profitability by Market Segments (Purity Grade/Application/Form/Nature/Region)
            19.1.2.4. Sales Footprint
            19.1.2.5. Strategy Overview
                19.1.2.5.1. Marketing Strategy
                19.1.2.5.2. Product Strategy
                19.1.2.5.3. Channel Strategy
        19.1.3. Penta Manufacturing Company
            19.1.3.1. Overview
            19.1.3.2. Product Portfolio
            19.1.3.3. Profitability by Market Segments (Purity Grade/Application/Form/Nature/Region)
            19.1.3.4. Sales Footprint
            19.1.3.5. Strategy Overview
                19.1.3.5.1. Marketing Strategy
                19.1.3.5.2. Product Strategy
                19.1.3.5.3. Channel Strategy
        19.1.4. Vigon International, Inc.
            19.1.4.1. Overview
            19.1.4.2. Product Portfolio
            19.1.4.3. Profitability by Market Segments (Purity Grade/Application/Form/Nature/Region)
            19.1.4.4. Sales Footprint
            19.1.4.5. Strategy Overview
                19.1.4.5.1. Marketing Strategy
                19.1.4.5.2. Product Strategy
                19.1.4.5.3. Channel Strategy
        19.1.5. Moellhausen S.p.A.
            19.1.5.1. Overview
            19.1.5.2. Product Portfolio
            19.1.5.3. Profitability by Market Segments (Purity Grade/Application/Form/Nature/Region)
            19.1.5.4. Sales Footprint
            19.1.5.5. Strategy Overview
                19.1.5.5.1. Marketing Strategy
                19.1.5.5.2. Product Strategy
                19.1.5.5.3. Channel Strategy
        19.1.6. Fine Fragrances Pvt. Ltd.
            19.1.6.1. Overview
            19.1.6.2. Product Portfolio
            19.1.6.3. Profitability by Market Segments (Purity Grade/Application/Form/Nature/Region)
            19.1.6.4. Sales Footprint
            19.1.6.5. Strategy Overview
                19.1.6.5.1. Marketing Strategy
                19.1.6.5.2. Product Strategy
                19.1.6.5.3. Channel Strategy
        19.1.7. Florida Worldwide Citrus Products Group, Inc.
            19.1.7.1. Overview
            19.1.7.2. Product Portfolio
            19.1.7.3. Profitability by Market Segments (Purity Grade/Application/Form/Nature/Region)
            19.1.7.4. Sales Footprint
            19.1.7.5. Strategy Overview
                19.1.7.5.1. Marketing Strategy
                19.1.7.5.2. Product Strategy
                19.1.7.5.3. Channel Strategy
        19.1.8. The Flavored Herb
            19.1.8.1. Overview
            19.1.8.2. Product Portfolio
            19.1.8.3. Profitability by Market Segments (Purity Grade/Application/Form/Nature/Region)
            19.1.8.4. Sales Footprint
            19.1.8.5. Strategy Overview
                19.1.8.5.1. Marketing Strategy
                19.1.8.5.2. Product Strategy
                19.1.8.5.3. Channel Strategy
20. Assumptions & Acronyms Used
21. Research Methodology
Recommendations

Food and Beverage

Natural Food Colors Market

February 2023

REP-GB-35

350 pages

Food and Beverage

Flavoring Oils Market

January 2023

REP-GB-10958

250 pages

Food and Beverage

Soy Food Products Market

September 2022

REP-GB-105

250 pages

Food and Beverage

GCC Functional Food Market

December 2014

REP-GB-SA-28

57 pages

Explore Food and Beverage Insights

View Reports
Future Market Insights

Nootkatone Market

Schedule a Call