Opacifiers Market Size and Share Forecast Outlook 2025 to 2035

The Opacifiers Market is projected to be valued at USD 1,953.2 million in 2025, expanding to USD 4,401.2 million by 2035. This reflects a total addition of more than USD 2,448 million across the decade, signaling an 8.5% CAGR. The expansion is anticipated to deliver more than a 2X increase in market size, underpinned by consistent formulation requirements in personal care and industrial applications.
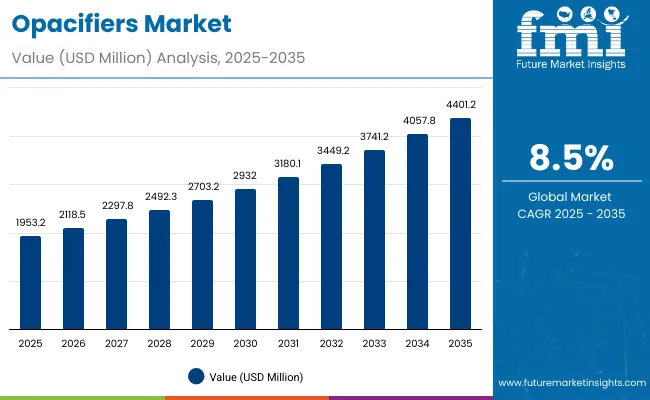
Quick Stats for Opacifiers Market

  • Opacifiers Market Value (2025): USD 1,953.2 Million
  • Opacifiers Market Forecast Value (2035): USD 4,401.2 Million
  • Opacifiers Market Forecast CAGR (2025 to 2035): 8.5%
  • Leading Segment in Opacifiers Market (2025): Liquid Dispersion (52.6%)
  • Key Growth Regions in Opacifiers Market: China, India, North America, Europe
  • Top Key Players in Opacifiers Market: BASF, Clariant, Dow, Evonik, Croda, Ashland, Wacker Chemie, Sensient, Lubrizol, Kobo Products

Opacifiers Market

Opacifiers Market Key Takeaways

Metric Value
Opacifiers Market Estimated Value in (2025E) USD 1,953.2 million
Opacifiers Market Forecast Value in (2035F) USD 4,401.2 million
Forecast CAGR (2025 to 2035) 8.50%

During the first half of the forecast window (2025-2030), revenues are expected to rise from USD 1,953.2 million to USD 2,932.0 million, adding nearly USD 979 million, which accounts for approximately 40% of the decade’s growth. This phase is likely to be characterized by stable adoption across mass personal care and premium product reformulations, driven by consumer demand for consistent texture, improved sensory performance, and more sustainable ingredients. Liquid dispersion formats, holding 52.6% share in 2025, are expected to anchor this phase due to ease of use in high-volume production environments.

The second half (2030-2035) is projected to deliver a sharper gain, with the market advancing from USD 2,932.0 million to USD 4,401.2 million, equating to over USD 1,469 million in incremental value and nearly 60% of total decade expansion. This growth is expected to be supported by the widening role of opacifiers in premium categories, where appearance enhancement already accounting for 47.1% share in 2025 remains a central performance driver. Regional momentum is likely to be shaped by double-digit growth in China and India, while North America and Europe sustain stable demand through specification lock-ins and regulatory compliance.

Between 2020 and 2024, steady adoption of opacifiers in personal care formulations was observed, driven by consumer demand for enhanced appearance, texture uniformity, and visual density in both mass and premium categories. By 2025, market valuation is expected to reach USD 1,953.2 million, with demand anchored in shampoos, conditioners, and body washes where opacity remains critical for consumer perception.

Over the forecast horizon, revenues are anticipated to expand strongly, achieving USD 4,401.2million by 2035. Growth momentum is expected to be supported by premium personal care, where appearance enhancement already representing 47.1% share in 2025 remains a defining performance parameter. Emerging economies such as China and India are projected to outpace mature markets, driven by double-digit growth trajectories and expanding domestic personal care production.

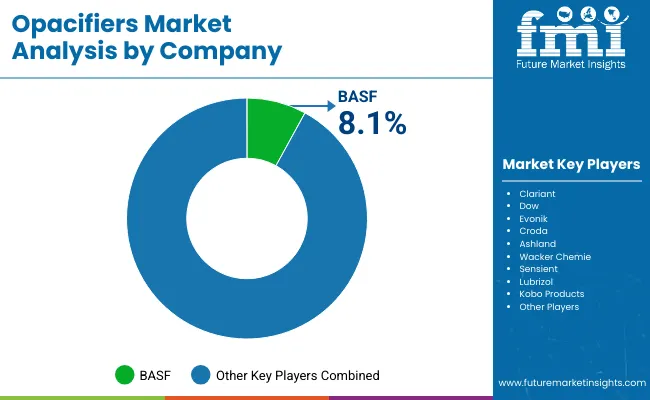
The competitive landscape is expected to remain fragmented, with BASF leading at 8.1% global share in 2025. Advantage is projected to accrue to suppliers able to provide sustainable, dispersion-stable systems that enable efficiency in large-scale production and compliance with evolving regulatory frameworks.

Why the Opacifiers Market is growing?

The Opacifiers Market is being driven by rising formulation complexity and the growing need for consistent visual performance in personal care and cosmetic products. Demand is being fueled by brand strategies that emphasize texture uniformity, opacity, and sensory appeal as critical differentiators in crowded consumer markets. Increasing adoption of liquid dispersion formats is being observed due to their efficiency in large-scale manufacturing and reduced handling risks.

Premium personal care and masstige categories are expected to accelerate uptake, as opacity becomes linked with luxury positioning and product quality perception. Emerging economies such as China and India are projected to contribute significantly, supported by double-digit growth in local production and consumer demand. Regulatory pressures and sustainability narratives are prompting reformulation cycles, where dosage efficiency and stable dispersion systems are being prioritized. Over the coming decade, innovation in sustainable alternatives and expansion of contract manufacturing networks are expected to reinforce long-term growth.

Segmental Analysis

The opacifiers market has been segmented based on chemistry, function, and physical form, highlighting the key dimensions shaping demand across end-use formulations. Each segment reflects distinct performance drivers that influence product differentiation and adoption patterns. Within chemistry, titanium dioxide continues to anchor market value due to its proven opacity and compatibility, while functional benefits led by appearance enhancement highlight the importance of visual appeal in personal care products.

From a physical form perspective, liquid dispersion has emerged as the preferred option, offering efficiency and consistency in large-scale manufacturing environments. These leading segments underline the critical role of opacifiers in ensuring texture uniformity, opacity, and sensory performance, which remain decisive factors in premiumization and consumer acceptance.
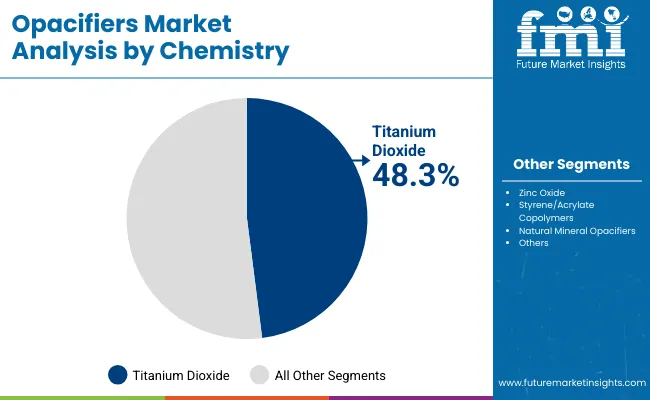
Insights into the Chemistry Segment with Titanium Dioxide Leading in Market Share

Opacifiers Market By Chemistry

Chemistry Market Value Share, 2025
Titanium dioxide 48.3%
Others 51.7%

Titanium dioxide leads the chemistry segment with 48.3% share in 2025, valued at USD 943.40 million. Its dominance is supported by proven performance in achieving opacity, stability, and consistent whiteness across multiple formulations. The material has been widely integrated into shampoos, lotions, and body washes due to its reliability and compatibility with diverse ingredients.

Despite increasing scrutiny in regulatory environments, titanium dioxide continues to remain indispensable in mass and premium personal care formulations. Its ability to provide high coverage at relatively low dosage strengthens its value proposition. Growth prospects are expected to be anchored in reformulation efforts where opacity cannot be compromised, ensuring its continued role as the backbone of opacifier chemistry through the forecast horizon.
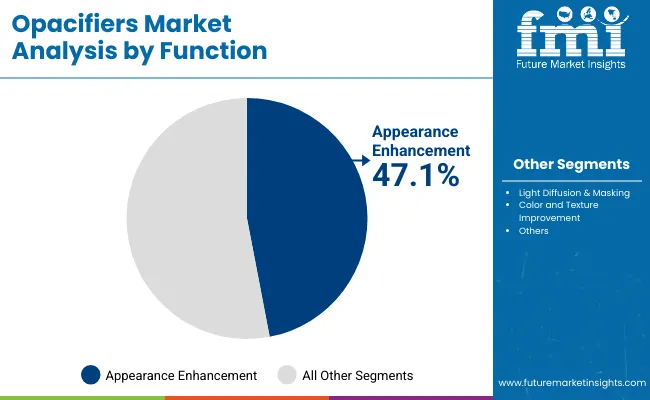
Insights into the Function Segment with Appearance Enhancement Leading in Market Share

Opacifiers Market By Function

Function Market Value Share, 2025
Appearance enhancement 47.1%
Others 52.9%

Appearance enhancement dominates the function segment, holding 47.1% share in 2025 with a market value of USD 919.96 million. This leadership is attributed to rising consumer expectations for uniform textures, improved visual density, and consistent opacity across personal care products. Formulators increasingly rely on opacifiers to deliver enhanced sensory cues, which directly influence perceptions of quality and product appeal.

The segment is expected to grow further as demand intensifies in premium skincare and haircare categories where appearance remains a critical purchase driver. Continuous innovation in dispersion quality and dosage efficiency will further strengthen this function’s position. Over the decade, appearance enhancement is projected to sustain leadership by aligning with evolving brand strategies focused on sensorial differentiation.
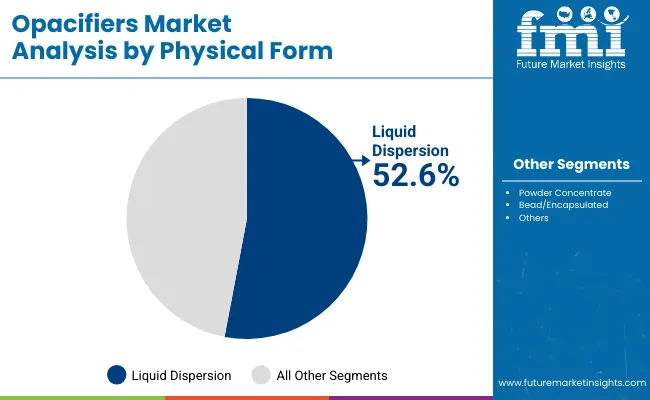
Insights into the Physical Form Segment with Liquid Dispersion Leading in Market Share

Opacifiers Market By Physical

Physical Form Market Value Share, 2025
Liquid dispersion 52.6%
Others 47.4%

Liquid dispersion emerges as the leading physical form, representing 52.6% of the market in 2025, equivalent to USD 1,027.38 million. Its strong position is driven by advantages in manufacturing efficiency, offering ease of handling, reduced dust exposure, and faster batch processing.

These benefits make liquid dispersion the preferred choice for large-scale contract manufacturers and multinational brands seeking operational consistency. The segment’s appeal is further reinforced by its ability to reduce rework and improve color uniformity, lowering overall production costs. Growth prospects remain favorable as sustainability-linked reformulations highlight dispersion stability and dosage efficiency. Over the forecast period, liquid dispersion is expected to retain dominance, serving as the preferred form across both mass and premium personal care applications.

What are the Drivers, Restraints, and Key Trends of the Opacifiers Market?

The Opacifiers Market faces regulatory scrutiny and cost optimization pressures, yet remains integral in personal care formulations where opacity and visual density are critical. Market momentum is being shaped by sustainability-driven reformulations, premium category expansion, and efficiency-focused manufacturing practices across regions.

Reformulation Cycles Driven by Regulatory and Sustainability Pressures

Formulation pipelines are increasingly being redesigned as regulatory oversight on certain chemistries intensifies, particularly in mature markets. Titanium dioxide alternatives and polymer-based systems are being integrated to secure compliance and align with corporate sustainability narratives. This driver is expected to accelerate growth by forcing routine product refreshes and creating recurring demand for opacifiers that demonstrate both regulatory clearance and enhanced dosage efficiency.

Competitive differentiation will be achieved by suppliers offering complete data packages, lifecycle assessments, and cross-market approvals, positioning them as indispensable partners to multinational formulators. As sustainability scorecards become central in procurement decisions, adoption of innovative, compliant opacifiers is expected to widen, reinforcing this driver as a long-term catalyst.

Supply Chain Concentration and Raw Material Volatility

Market expansion is being tempered by high dependency on limited sources for certain raw materials, leaving opacifier supply chains exposed to price swings and geopolitical disruptions. Volatility in feedstocks increases production costs and compresses margins, particularly for smaller producers without integrated sourcing strategies. Inconsistent supply reliability also complicates qualification processes for downstream manufacturers, as opacifiers typically undergo rigorous validation before being locked into formulations.

This restraint is anticipated to intensify unless supplier diversification and regional production bases are expanded. Strategic partnerships, dual-sourcing models, and localized production investments will be necessary to counter volatility, but until such measures are fully realized, this factor will act as a structural constraint on growth.
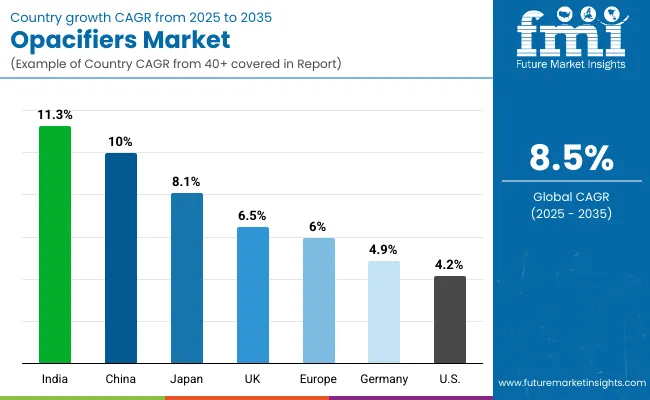
Analysis of Opacifiers Market By Key Countries

Opacifiers Market By Country

Countries CAGR
China 10.0%
USA 4.2%
India 11.3%
UK 6.5%
Germany 4.9%
Japan 8.1%

The opacifiers market demonstrates distinct country-level growth trajectories, shaped by consumer preferences, regulatory frameworks, and industrial maturity. India emerges as the fastest-growing market with an 11.3% CAGR, driven by rapid expansion of domestic personal care production and increasing investments from multinational brands seeking scalable, cost-efficient manufacturing bases. China follows closely with a 10.0% CAGR, supported by strong demand for premium cosmetics, regulatory-driven reformulations, and the scale of its contract manufacturing ecosystem. Japan, with an 8.1% CAGR, reflects advanced adoption of liquid dispersions in high-value formulations where quality consistency and efficiency are prioritized.

Europe presents a more stable growth outlook, led by the UK (6.5%), Germany (4.9%), and the broader region at 6.0% CAGR, where sustainability mandates and strict compliance standards continue to drive reformulation cycles. These markets benefit from established R&D infrastructure and strong regulatory oversight that fosters innovation in clean-label opacifiers. The USA displays a moderate 4.2% CAGR, reflecting its maturity, where growth is largely service-driven with emphasis on sustainable ingredient sourcing and advanced technical support.

This distribution indicates that Asia will anchor global momentum through scale and rapid adoption, while Europe and North America sustain demand through compliance-driven reformulations and premium category resilience.
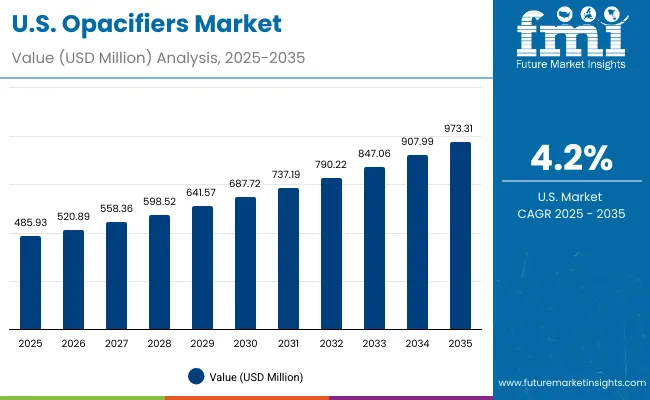
Sales Outlook for Opacifiers In the United States

Opacifiers Market Usa

Year USA Opacifiers Market (USD Million)
2025 485.93
2026 520.89
2027 558.36
2028 598.52
2029 641.57
2030 687.72
2031 737.19
2032 790.22
2033 847.06
2034 907.99
2035 973.31

The Opacifiers Market in the United States is projected to grow at a CAGR of 4.2% during 2025-2035, reflecting gradual but steady expansion driven by compliance-focused reformulations and premium personal care launches. The market value is expected to increase from USD 485.93 million in 2025 to USD 973.31 million by 2035. Intermediate years show consistent growth: 2026 (USD 520.89 million), 2027 (USD 558.36 million), 2028 (USD 598.52 million), 2029 (USD 641.57 million), 2030 (USD 687.72 million), 2031 (USD 737.19 million), 2032 (USD 790.22 million), 2033 (USD 847.06 million), and 2034 (USD 907.99 million).

The USA market outlook is characterized by stability, where liquid dispersion continues to dominate due to its efficiency in high-volume manufacturing and reduced rework needs. Sustained demand is expected from premium personal care, where opacity is positioned as a product quality indicator. Contract manufacturers are projected to emphasize stable dispersions for operational reliability, while sustainability-linked reformulations are anticipated to push demand for alternatives with validated safety and efficiency credentials.

  • Premium launches are reinforcing opacity as a key differentiator.
  • Contract manufacturers are deepening reliance on dispersion-stable systems.
  • Regulatory oversight is expected to sustain consistent reformulation activity.

Growth and Expansion Outlook for Opacifiers Market in the United Kingdom

The Opacifiers Market in the United Kingdom is projected to grow at a CAGR of 6.5% during 2025-2035, supported by compliance-led reformulations and premium personal care positioning. Demand is expected to be shaped by retailer sustainability scorecards, which are pushing suppliers toward efficient liquid dispersions and label-friendly chemistries. Private-label upgrades are anticipated to widen usage in mass channels, while indie brands are likely to emphasize opacity as a visible quality cue. Technical service and documentation depth are expected to influence vendor selection as regulatory scrutiny intensifies. Procurement strategies are projected to favor dual-qualification to manage supply risk without compromising texture and appearance goals.

  • Retailer scorecards are accelerating clean-label, lower-dosage solutions
  • Private-label upgrades are lifting volume in mass categories
  • Technical documentation depth is influencing qualification and awards
  • Dual-sourcing is being prioritized to mitigate supply risk

Growth and Expansion Outlook for Opacifiers Market in India

The Opacifiers Market in India is projected to expand at a CAGR of 11.3% during 2025-2035, led by rapid scale-up in domestic personal care manufacturing and ongoing premiumization. Capacity additions by CMOs are expected to favor liquid dispersions for throughput and handling benefits. Portfolio refreshes are being guided by opacity consistency and dosage efficiency, aligning with cost-to-serve objectives in high-volume SKUs. Urban trade channels are anticipated to elevate texture expectations, pushing wider adoption beyond shampoos into lotions and color cosmetics. Supplier partnerships with local tech support are projected to differentiate through faster scale-up and tighter process control.

  • CMO expansions are favoring dispersion-stable systems
  • Urban retail is raising expectations for visual density and texture
  • Local technical service is shortening qualification cycles
  • Dosage efficiency is being prioritized to manage unit economics

Sales Outlook for Opacifiers In China

The Opacifiers Market in China is projected to grow at a CAGR of 10.0% during 2025-2035, underpinned by premium beauty, rapid product refresh cycles, and contract manufacturing breadth. Liquid dispersions are expected to dominate due to faster changeovers and reduced rework in large plants. Regulatory tightening and brand risk management are prompting diversified chemistry portfolios, while appearance enhancement remains central to consumer appeal. Cross-border e-commerce is anticipated to amplify shade uniformity requirements, raising barriers for unqualified suppliers. Domestic champions are projected to extend share via scale and responsive technical service, while multinationals prioritize compliance and global documentation parity.
  • Rapid refresh cycles are reinforcing opacity as a visible quality lever
  • Dispersions are improving line efficiency and yield
  • Diversified chemistries are mitigating regulatory risk
  • Cross-border channels are tightening tolerance on shade consistency

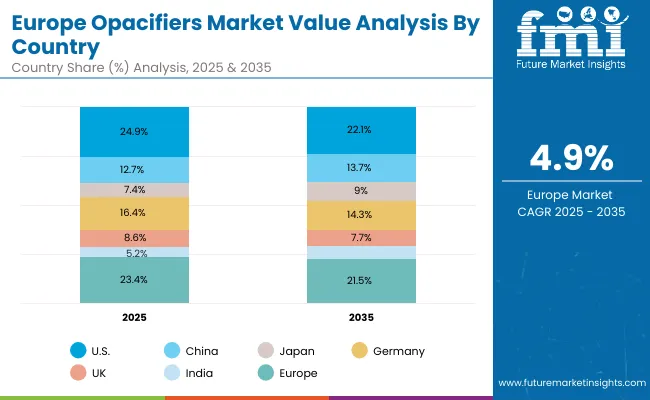
In-depth Analysis of Opacifiers In Germany

Opacifiers Market Europe

Countries 2025
USA 24.9%
China 12.7%
Japan 7.4%
Germany 16.4%
UK 8.6%
India 5.2%
Countries 2035
USA 22.1%
China 13.7%
Japan 9.0%
Germany 14.3%
UK 7.7%
India 6.3%

The Opacifiers Market in Germany is projected to rise at a CAGR of 4.9% during 2025-2035, reflecting steady, compliance-driven demand in a mature product landscape. Emphasis on documentation rigor, EHS conformity, and LCA transparency is expected to shape supplier selection. Incremental growth is anticipated from reformulations targeting microplastic narratives and recyclability claims, with liquid dispersions preferred for repeatability and reduced waste. Premium and dermocosmetic lines are likely to sustain value, while mass channels maintain baseline volumes through specification lock-ins. Local technical support and validated dosage efficiency are projected to be decisive in awards.
  • LCA and EHS rigor are influencing procurement scorecards
  • Microplastic and recyclability claims are prompting reformulations
  • Liquid dispersions are improving repeatability and scrap reduction
  • Specification lock-ins are sustaining baseline mass-channel volumes

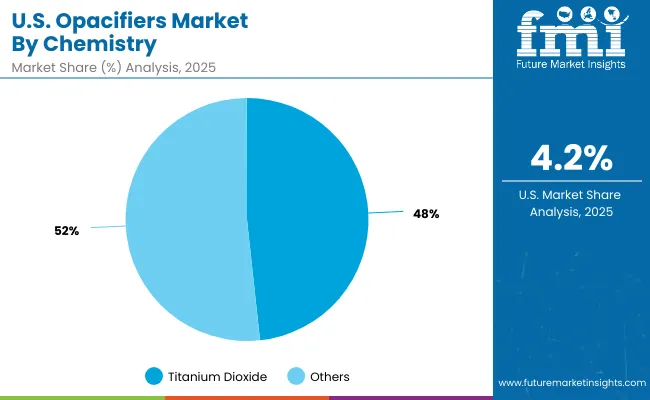
Growth Outlook for Opacifiers Market in USA

Opacifiers Market Usa 2

USA By Chemistry Market Value Share, 2025
Titanium dioxide 48.3%
Others 51.7%

The Opacifiers Market in the United States is projected at USD 485.93 million in 2025. Titanium dioxide contributes 48.3% (USD 234.71 million), while the category defined as others holds 51.7% (USD 251.23 million). This slight dominance of alternative chemistries reflects the influence of evolving regulatory frameworks and a shift toward sustainable, label-friendly formulations. The transition is being guided by procurement strategies that prioritize compliance, transparency, and risk diversification, particularly in high-volume categories where consumer scrutiny is most intense. While titanium dioxide retains critical relevance due to its unmatched opacity and cost efficiency, the broader basket of alternative systems is being integrated to balance regulatory resilience with performance stability.

Over the next decade, this chemistry mix is expected to remain balanced, with titanium dioxide sustaining its role in mass formulations while alternatives gain traction in premium and compliance-sensitive channels. Suppliers that combine dosage efficiency, dispersion stability, and lifecycle data are anticipated to capture strategic advantage in the USA market.
  • Market in the United States is valued at USD 485.93 million in 2025
  • Others slightly lead titanium dioxide at 51.7% vs 48.3%
  • Growth influenced by sustainability narratives and compliance-driven reformulations

Opportunity Analysis of China Opacifiers Market

Opacifiers Market China

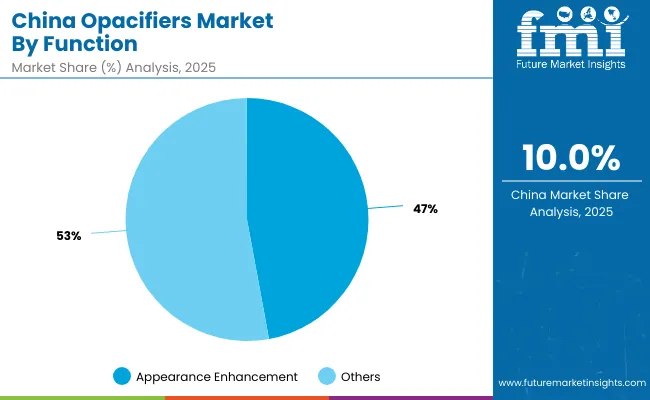
China By Function Market Value Share, 2025
Appearance enhancement 47.1%
Others 52.9%

The Opacifiers Market in China is projected at USD 248.37 million in 2025, with appearance enhancement leading the functional mix at 47.1%, valued at USD 116.98 million. This leadership reflects the importance of opacity as a visible performance indicator in Chinese personal care products, where texture consistency and whiteness are directly linked to consumer-perceived quality. Premium beauty categories are expected to reinforce this demand, with opacifiers increasingly integrated into shampoos, conditioners, lotions, and color cosmetics to ensure uniformity and enhance shelf appeal.

Although the category defined as others accounts for a slightly higher share at 52.9% (USD 131.39 million), its role is more dispersed across multi-functional applications such as light diffusion and masking. These functions provide incremental benefits, but appearance enhancement remains the decisive driver of consumer choice and brand differentiation. Over the decade, demand in China is anticipated to rise as opacity continues to anchor reformulation strategies and product upgrades.
  • Market in China is valued at USD 248.37 million in 2025
  • Appearance enhancement leads at 47.1% share, worth USD 116.98 million
  • Others segment adds versatility but remains secondary in value creation
  • Premiumization and texture-focused innovation reinforce leadership of appearance enhancement

Competitive Landscape of Opacifiers Market

Opacifiers Market By Company

The Opacifiers Market is moderately fragmented, with global leaders, established chemical innovators, and specialized formulation-focused suppliers competing across diverse application areas. BASF is identified as the leading player, holding a global value share of 8.1% in 2025, while the remaining 91.9% is distributed among other multinational and regional companies. BASF’s leadership reflects its broad formulation expertise, extensive distribution networks, and ability to align product portfolios with regulatory and sustainability requirements. Its scale in dispersions and technical service infrastructure provides additional competitive resilience.

Other key participants include Clariant, Dow, Evonik, Croda, Ashland, Wacker Chemie, Sensient, Lubrizol, and Kobo Products. These companies are expected to strengthen their positioning by focusing on liquid dispersion formats, compliant chemistries, and efficiency-driven opacifier solutions for both mass and premium personal care. Competitive strategies are being reshaped by sustainability-linked reformulations, regulatory scrutiny, and heightened demand for consistent sensory performance.

Differentiation is shifting away from commodity supply toward integrated value propositions, including lifecycle assessments, sustainability documentation, and technical service partnerships. As global regulations tighten and premiumization accelerates, suppliers with transparent sourcing, strong compliance credentials, and scalable production footprints are expected to capture higher-value opportunities.

Key Developments in Opacifiers Market

  • On April 3, 2025, BASF introduced Lamesoft OP Plus at in-cosmetics Global 2025. The wax-based opacifier dispersion was designed for natural personal care formulations, offering ~92-98% natural origin content. Experts highlighted it as a milestone in biodegradable opacifiers, addressing rising consumer demand for cold-process, sustainable, and stable opacity solutions.
  • On June 26, 2025, Syensqo unveiled Miracare Biopacify in Europe. The biodegradable opacifier was engineered for liquid laundry detergents and pouch systems, fully compliant with upcoming EU microplastic bans. Industry specialists called it a turning point for home care innovation, aligning opacity performance with sustainability and renewable carbon requirements.

Scope of the Report

Item Value
Quantitative Value USD 1,953.2 million (2025E); USD 4,401.2 million (2035F); 8.5% CAGR (2025-2035)
Component (Segment Labels) Chemistry; Function; Physical form; Application; End use; Geography
Chemistry Titanium dioxide; Others
Function Appearance enhancement; Others (e.g., light diffusion, masking)
Physical Form Liquid dispersion; Others (powder concentrate, bead/encapsulated)
Application Shampoos & conditioners; Body washes & shower gels; Lotions & creams; Color cosmetics
End-use Industry Mass personal care; Premium personal care; Industrial & contract manufacturing
Regions Covered North America; Europe; East Asia; South Asia & Pacific; Latin America; Middle East & Africa
Countries Covered United States; China; India; United Kingdom; Germany; Japan
Key Companies Profiled BASF; Clariant; Dow; Evonik; Croda; Ashland; Wacker Chemie; Sensient; Lubrizol; Kobo Products
Additional Attributes Dollar sales by chemistry, function, and physical form; dispersion stability and dosage-efficiency benchmarking; compliance and sustainability documentation (e.g., microplastics, LCA); qualification and technical service depth; premiumization-led reformulations; contract manufacturing scale effects; regional growth led by Asia (China, India); USA maturity with steady reformulations; competitive share led by BASF at 8.1% (2025)

Key Segments

By Chemistry:

  • Titanium dioxide
  • Zinc oxide
  • Styrene/acrylate copolymers
  • Natural mineral

By Function:

  • Appearance enhancement
  • Light diffusion & masking
  • Color and texture improvement

By Physical Form:

  • Liquid dispersion
  • Powder concentrate
  • Bead/encapsulated

By Application:

  • Shampoos & conditioners
  • Body washes & shower gels
  • Lotions & creams
  • Color cosmetics

By End Use:

  • Mass personal care
  • Premium personal care
  • Industrial & contract manufacturing

By Region:

  • North America
  • Latin America
  • Europe
  • East Asia
  • South Asia & Pacific
  • Middle East and Africa

Table of Content

  1. Executive Summary
    • Global Market Outlook
    • Demand-side Trends
    • Supply-side Trends
    • Technology Roadmap Analysis
    • Analysis and Recommendations
  2. Market Overview
    • Market Coverage / Taxonomy
    • Market Definition / Scope / Limitations
  3. Market Background
    • Market Dynamics
      • Drivers
      • Restraints
      • Opportunity
      • Trends
    • Scenario Forecast
      • Demand in Optimistic Scenario
      • Demand in Likely Scenario
      • Demand in Conservative Scenario
    • Opportunity Map Analysis
    • Product Life Cycle Analysis
    • Supply Chain Analysis
      • Supply Side Participants and their Roles
        • Producers
        • Mid-Level Participants (Traders/ Agents/ Brokers)
        • Wholesalers and Distributors
      • Value Added and Value Created at Node in the Supply Chain
      • List of Raw Material Suppliers
      • List of Existing and Potential Buyer’s
    • Investment Feasibility Matrix
    • Value Chain Analysis
      • Profit Margin Analysis
      • Wholesalers and Distributors
      • Retailers
    • PESTLE and Porter’s Analysis
    • Regulatory Landscape
      • By Key Regions
      • By Key Countries
    • Regional Parent Market Outlook
    • Production and Consumption Statistics
    • Import and Export Statistics
  4. Global Market Analysis 2020 to 2024 and Forecast, 2025 to 2035
    • Historical Market Size Value (USD Million) & Volume (Units) Analysis, 2020 to 2024
    • Current and Future Market Size Value (USD Million) & Volume (Units) Projections, 2025 to 2035
      • Y-o-Y Growth Trend Analysis
      • Absolute $ Opportunity Analysis
  5. Global Market Analysis 2020 to 2024 and Forecast 2025 to 2035, By Chemistry
    • Introduction / Key Findings
    • Historical Market Size Value (USD Million) & Volume (Units) Analysis By Chemistry, 2020 to 2024
    • Current and Future Market Size Value (USD Million) & Volume (Units) Analysis and Forecast By Chemistry, 2025 to 2035
      • Titanium dioxide
      • Zinc oxide
      • Styrene/acrylate copolymers
      • Natural mineral
    • Y-o-Y Growth Trend Analysis By Chemistry, 2020 to 2024
    • Absolute $ Opportunity Analysis By Chemistry, 2025 to 2035
  6. Global Market Analysis 2020 to 2024 and Forecast 2025 to 2035, By Function
    • Introduction / Key Findings
    • Historical Market Size Value (USD Million) & Volume (Units) Analysis By Function, 2020 to 2024
    • Current and Future Market Size Value (USD Million) & Volume (Units) Analysis and Forecast By Function, 2025 to 2035
      • Appearance enhancement
      • Light diffusion & masking
      • Color and texture improvement
    • Y-o-Y Growth Trend Analysis By Function, 2020 to 2024
    • Absolute $ Opportunity Analysis By Function, 2025 to 2035
  7. Global Market Analysis 2020 to 2024 and Forecast 2025 to 2035, By Physical Form
    • Introduction / Key Findings
    • Historical Market Size Value (USD Million) & Volume (Units) Analysis By Physical Form, 2020 to 2024
    • Current and Future Market Size Value (USD Million) & Volume (Units) Analysis and Forecast By Physical Form, 2025 to 2035
      • Liquid dispersion
      • Powder concentrate
      • Bead/encapsulated
    • Y-o-Y Growth Trend Analysis By Physical Form, 2020 to 2024
    • Absolute $ Opportunity Analysis By Physical Form, 2025 to 2035
  8. Global Market Analysis 2020 to 2024 and Forecast 2025 to 2035, By Application
    • Introduction / Key Findings
    • Historical Market Size Value (USD Million) & Volume (Units) Analysis By Application, 2020 to 2024
    • Current and Future Market Size Value (USD Million) & Volume (Units) Analysis and Forecast By Application, 2025 to 2035
      • Shampoos & conditioners
      • Body washes & shower gels
      • Lotions & creams
      • Color cosmetics
    • Y-o-Y Growth Trend Analysis By Application, 2020 to 2024
    • Absolute $ Opportunity Analysis By Application, 2025 to 2035
  9. Global Market Analysis 2020 to 2024 and Forecast 2025 to 2035, By End Use
    • Introduction / Key Findings
    • Historical Market Size Value (USD Million) & Volume (Units) Analysis By End Use, 2020 to 2024
    • Current and Future Market Size Value (USD Million) & Volume (Units) Analysis and Forecast By End Use, 2025 to 2035
      • Mass personal care
      • Premium personal care
      • Industrial & contract manufacturing
    • Y-o-Y Growth Trend Analysis By End Use, 2020 to 2024
    • Absolute $ Opportunity Analysis By End Use, 2025 to 2035
  10. Global Market Analysis 2020 to 2024 and Forecast 2025 to 2035, By Region
    • Introduction
    • Historical Market Size Value (USD Million) & Volume (Units) Analysis By Region, 2020 to 2024
    • Current Market Size Value (USD Million) & Volume (Units) Analysis and Forecast By Region, 2025 to 2035
      • North America
      • Latin America
      • Europe
      • East Asia
      • South Asia & Pacific
      • Middle East and Africa
    • Market Attractiveness Analysis By Region
  11. North America Market Analysis 2020 to 2024 and Forecast 2025 to 2035, By Country
    • Historical Market Size Value (USD Million) & Volume (Units) Trend Analysis By Market Taxonomy, 2020 to 2024
    • Market Size Value (USD Million) & Volume (Units) Forecast By Market Taxonomy, 2025 to 2035
      • By Country
        • USA
        • Canada
      • By Chemistry
      • By Function
      • By Physical Form
      • By Application
      • By End Use
    • Market Attractiveness Analysis
      • By Country
      • By Chemistry
      • By Function
      • By Physical Form
      • By Application
      • By End Use
    • Key Takeaways
  12. Latin America Market Analysis 2020 to 2024 and Forecast 2025 to 2035, By Country
    • Historical Market Size Value (USD Million) & Volume (Units) Trend Analysis By Market Taxonomy, 2020 to 2024
    • Market Size Value (USD Million) & Volume (Units) Forecast By Market Taxonomy, 2025 to 2035
      • By Country
        • Brazil
        • Mexico
        • Colombia
        • Rest of Latin America
      • By Chemistry
      • By Function
      • By Physical Form
      • By Application
      • By End Use
    • Market Attractiveness Analysis
      • By Country
      • By Chemistry
      • By Function
      • By Physical Form
      • By Application
      • By End Use
    • Key Takeaways
  13. Europe Market Analysis 2020 to 2024 and Forecast 2025 to 2035, By Country
    • Historical Market Size Value (USD Million) & Volume (Units) Trend Analysis By Market Taxonomy, 2020 to 2024
    • Market Size Value (USD Million) & Volume (Units) Forecast By Market Taxonomy, 2025 to 2035
      • By Country
        • Germany
        • UK
        • France
        • Italy
        • Spain
        • Belgium
        • Netherlands
        • Nordic
        • Switzerland
        • Russia
        • Poland
        • Rest of Europe
      • By Chemistry
      • By Function
      • By Physical Form
      • By Application
      • By End Use
    • Market Attractiveness Analysis
      • By Country
      • By Chemistry
      • By Function
      • By Physical Form
      • By Application
      • By End Use
    • Key Takeaways
  14. East Asia Market Analysis 2020 to 2024 and Forecast 2025 to 2035, By Country
    • Historical Market Size Value (USD Million) & Volume (Units) Trend Analysis By Market Taxonomy, 2020 to 2024
    • Market Size Value (USD Million) & Volume (Units) Forecast By Market Taxonomy, 2025 to 2035
      • By Country
        • China
        • Japan
        • South Korea
      • By Chemistry
      • By Function
      • By Physical Form
      • By Application
      • By End Use
    • Market Attractiveness Analysis
      • By Country
      • By Chemistry
      • By Function
      • By Physical Form
      • By Application
      • By End Use
    • Key Takeaways
  15. South Asia & Pacific Market Analysis 2020 to 2024 and Forecast 2025 to 2035, By Country
    • Historical Market Size Value (USD Million) & Volume (Units) Trend Analysis By Market Taxonomy, 2020 to 2024
    • Market Size Value (USD Million) & Volume (Units) Forecast By Market Taxonomy, 2025 to 2035
      • By Country
        • India
        • Thailand
        • Malaysia
        • Indonesia
        • Singapore
        • Vietnam
        • Australia
        • New Zealand
        • Rest of South Asia
      • By Chemistry
      • By Function
      • By Physical Form
      • By Application
      • By End Use
    • Market Attractiveness Analysis
      • By Country
      • By Chemistry
      • By Function
      • By Physical Form
      • By Application
      • By End Use
    • Key Takeaways
  16. Middle East and Africa Market Analysis 2020 to 2024 and Forecast 2025 to 2035, By Country
    • Historical Market Size Value (USD Million) & Volume (Units) Trend Analysis By Market Taxonomy, 2020 to 2024
    • Market Size Value (USD Million) & Volume (Units) Forecast By Market Taxonomy, 2025 to 2035
      • By Country
        • Turkey
        • UAE
        • Saudi Arabia
        • Israel
        • Other GCC Countries
        • North Africa
        • South Africa
      • By Chemistry
      • By Function
      • By Physical Form
      • By Application
      • By End Use
    • Market Attractiveness Analysis
      • By Country
      • By Chemistry
      • By Function
      • By Physical Form
      • By Application
      • By End Use
    • Key Takeaways
  17. Key Countries Market Analysis
    • USA
      • Pricing Analysis
      • Market Share Analysis, 2024
        • By Chemistry
        • By Function
        • By Physical Form
        • By Application
        • By End Use
    • Canada
      • Pricing Analysis
      • Market Share Analysis, 2024
        • By Chemistry
        • By Function
        • By Physical Form
        • By Application
        • By End Use
    • Brazil
      • Pricing Analysis
      • Market Share Analysis, 2024
        • By Chemistry
        • By Function
        • By Physical Form
        • By Application
        • By End Use
    • Mexico
      • Pricing Analysis
      • Market Share Analysis, 2024
        • By Chemistry
        • By Function
        • By Physical Form
        • By Application
        • By End Use
    • Colombia
      • Pricing Analysis
      • Market Share Analysis, 2024
        • By Chemistry
        • By Function
        • By Physical Form
        • By Application
        • By End Use
    • Germany
      • Pricing Analysis
      • Market Share Analysis, 2024
        • By Chemistry
        • By Function
        • By Physical Form
        • By Application
        • By End Use
    • UK
      • Pricing Analysis
      • Market Share Analysis, 2024
        • By Chemistry
        • By Function
        • By Physical Form
        • By Application
        • By End Use
    • France
      • Pricing Analysis
      • Market Share Analysis, 2024
        • By Chemistry
        • By Function
        • By Physical Form
        • By Application
        • By End Use
    • Italy
      • Pricing Analysis
      • Market Share Analysis, 2024
        • By Chemistry
        • By Function
        • By Physical Form
        • By Application
        • By End Use
    • Spain
      • Pricing Analysis
      • Market Share Analysis, 2024
        • By Chemistry
        • By Function
        • By Physical Form
        • By Application
        • By End Use
    • Belgium
      • Pricing Analysis
      • Market Share Analysis, 2024
        • By Chemistry
        • By Function
        • By Physical Form
        • By Application
        • By End Use
    • Netherlands
      • Pricing Analysis
      • Market Share Analysis, 2024
        • By Chemistry
        • By Function
        • By Physical Form
        • By Application
        • By End Use
    • Nordic
      • Pricing Analysis
      • Market Share Analysis, 2024
        • By Chemistry
        • By Function
        • By Physical Form
        • By Application
        • By End Use
    • Switzerland
      • Pricing Analysis
      • Market Share Analysis, 2024
        • By Chemistry
        • By Function
        • By Physical Form
        • By Application
        • By End Use
    • Russia
      • Pricing Analysis
      • Market Share Analysis, 2024
        • By Chemistry
        • By Function
        • By Physical Form
        • By Application
        • By End Use
    • Poland
      • Pricing Analysis
      • Market Share Analysis, 2024
        • By Chemistry
        • By Function
        • By Physical Form
        • By Application
        • By End Use
    • China
      • Pricing Analysis
      • Market Share Analysis, 2024
        • By Chemistry
        • By Function
        • By Physical Form
        • By Application
        • By End Use
    • Japan
      • Pricing Analysis
      • Market Share Analysis, 2024
        • By Chemistry
        • By Function
        • By Physical Form
        • By Application
        • By End Use
    • South Korea
      • Pricing Analysis
      • Market Share Analysis, 2024
        • By Chemistry
        • By Function
        • By Physical Form
        • By Application
        • By End Use
    • India
      • Pricing Analysis
      • Market Share Analysis, 2024
        • By Chemistry
        • By Function
        • By Physical Form
        • By Application
        • By End Use
    • Thailand
      • Pricing Analysis
      • Market Share Analysis, 2024
        • By Chemistry
        • By Function
        • By Physical Form
        • By Application
        • By End Use
    • Indonesia
      • Pricing Analysis
      • Market Share Analysis, 2024
        • By Chemistry
        • By Function
        • By Physical Form
        • By Application
        • By End Use
    • Australia
      • Pricing Analysis
      • Market Share Analysis, 2024
        • By Chemistry
        • By Function
        • By Physical Form
        • By Application
        • By End Use
    • New Zealand
      • Pricing Analysis
      • Market Share Analysis, 2024
        • By Chemistry
        • By Function
        • By Physical Form
        • By Application
        • By End Use
    • Turkey
      • Pricing Analysis
      • Market Share Analysis, 2024
        • By Chemistry
        • By Function
        • By Physical Form
        • By Application
        • By End Use
    • UAE
      • Pricing Analysis
      • Market Share Analysis, 2024
        • By Chemistry
        • By Function
        • By Physical Form
        • By Application
        • By End Use
    • Saudi Arabia
      • Pricing Analysis
      • Market Share Analysis, 2024
        • By Chemistry
        • By Function
        • By Physical Form
        • By Application
        • By End Use
    • Israel
      • Pricing Analysis
      • Market Share Analysis, 2024
        • By Chemistry
        • By Function
        • By Physical Form
        • By Application
        • By End Use
    • North Africa
      • Pricing Analysis
      • Market Share Analysis, 2024
        • By Chemistry
        • By Function
        • By Physical Form
        • By Application
        • By End Use
    • South Africa
      • Pricing Analysis
      • Market Share Analysis, 2024
        • By Chemistry
        • By Function
        • By Physical Form
        • By Application
        • By End Use
  18. Market Structure Analysis
    • Competition Dashboard
    • Competition Benchmarking
    • Market Share Analysis of Top Players
      • By Regional
      • By Chemistry
      • By Function
      • By Physical Form
      • By Application
      • By End Use
  19. Competition Analysis
    • Competition Deep Dive
      • BASF
        • Overview
        • Product Portfolio
        • Profitability by Market Segments (Product/Age /Sales Channel/Region)
        • Sales Footprint
        • Strategy Overview
          • Marketing Strategy
          • Product Strategy
          • Channel Strategy
      • Clariant
        • Overview
        • Product Portfolio
        • Profitability by Market Segments (Product/Age /Sales Channel/Region)
        • Sales Footprint
        • Strategy Overview
          • Marketing Strategy
          • Product Strategy
          • Channel Strategy
      • Dow
        • Overview
        • Product Portfolio
        • Profitability by Market Segments (Product/Age /Sales Channel/Region)
        • Sales Footprint
        • Strategy Overview
          • Marketing Strategy
          • Product Strategy
          • Channel Strategy
      • Evonik
        • Overview
        • Product Portfolio
        • Profitability by Market Segments (Product/Age /Sales Channel/Region)
        • Sales Footprint
        • Strategy Overview
          • Marketing Strategy
          • Product Strategy
          • Channel Strategy
      • Croda
        • Overview
        • Product Portfolio
        • Profitability by Market Segments (Product/Age /Sales Channel/Region)
        • Sales Footprint
        • Strategy Overview
          • Marketing Strategy
          • Product Strategy
          • Channel Strategy
      • Ashland
        • Overview
        • Product Portfolio
        • Profitability by Market Segments (Product/Age /Sales Channel/Region)
        • Sales Footprint
        • Strategy Overview
          • Marketing Strategy
          • Product Strategy
          • Channel Strategy
      • Wacker Chemie
        • Overview
        • Product Portfolio
        • Profitability by Market Segments (Product/Age /Sales Channel/Region)
        • Sales Footprint
        • Strategy Overview
          • Marketing Strategy
          • Product Strategy
          • Channel Strategy
      • Sensient
        • Overview
        • Product Portfolio
        • Profitability by Market Segments (Product/Age /Sales Channel/Region)
        • Sales Footprint
        • Strategy Overview
          • Marketing Strategy
          • Product Strategy
          • Channel Strategy
      • Lubrizol
        • Overview
        • Product Portfolio
        • Profitability by Market Segments (Product/Age /Sales Channel/Region)
        • Sales Footprint
        • Strategy Overview
          • Marketing Strategy
          • Product Strategy
          • Channel Strategy
      • Kobo Products
        • Overview
        • Product Portfolio
        • Profitability by Market Segments (Product/Age /Sales Channel/Region)
        • Sales Footprint
        • Strategy Overview
          • Marketing Strategy
          • Product Strategy
          • Channel Strategy
      • Others
        • Overview
        • Product Portfolio
        • Profitability by Market Segments (Product/Age /Sales Channel/Region)
        • Sales Footprint
        • Strategy Overview
          • Marketing Strategy
          • Product Strategy
          • Channel Strategy
  20. Assumptions & Acronyms Used
  21. Research Methodology

List of Tables

  • Table 1: Global Market Value (USD Million) Forecast by Region, 2020-2035
  • Table 2: Global Market Volume (Units) Forecast by Region, 2020-2035
  • Table 3: Global Market Value (USD Million) Forecast by Chemistry, 2020-2035
  • Table 4: Global Market Volume (Units) Forecast by Chemistry, 2020-2035
  • Table 5: Global Market Value (USD Million) Forecast by Function, 2020-2035
  • Table 6: Global Market Volume (Units) Forecast by Function, 2020-2035
  • Table 7: Global Market Value (USD Million) Forecast by Physical Form, 2020-2035
  • Table 8: Global Market Volume (Units) Forecast by Physical Form, 2020-2035
  • Table 9: Global Market Value (USD Million) Forecast by Application, 2020-2035
  • Table 10: Global Market Volume (Units) Forecast by Application, 2020-2035
  • Table 11: Global Market Value (USD Million) Forecast by End Use, 2020-2035
  • Table 12: Global Market Volume (Units) Forecast by End Use, 2020-2035
  • Table 13: North America Market Value (USD Million) Forecast by Country, 2020-2035
  • Table 14: North America Market Volume (Units) Forecast by Country, 2020-2035
  • Table 15: North America Market Value (USD Million) Forecast by Chemistry, 2020-2035
  • Table 16: North America Market Volume (Units) Forecast by Chemistry, 2020-2035
  • Table 17: North America Market Value (USD Million) Forecast by Function, 2020-2035
  • Table 18: North America Market Volume (Units) Forecast by Function, 2020-2035
  • Table 19: North America Market Value (USD Million) Forecast by Physical Form, 2020-2035
  • Table 20: North America Market Volume (Units) Forecast by Physical Form, 2020-2035
  • Table 21: North America Market Value (USD Million) Forecast by Application, 2020-2035
  • Table 22: North America Market Volume (Units) Forecast by Application, 2020-2035
  • Table 23: North America Market Value (USD Million) Forecast by End Use, 2020-2035
  • Table 24: North America Market Volume (Units) Forecast by End Use, 2020-2035
  • Table 25: Latin America Market Value (USD Million) Forecast by Country, 2020-2035
  • Table 26: Latin America Market Volume (Units) Forecast by Country, 2020-2035
  • Table 27: Latin America Market Value (USD Million) Forecast by Chemistry, 2020-2035
  • Table 28: Latin America Market Volume (Units) Forecast by Chemistry, 2020-2035
  • Table 29: Latin America Market Value (USD Million) Forecast by Function, 2020-2035
  • Table 30: Latin America Market Volume (Units) Forecast by Function, 2020-2035
  • Table 31: Latin America Market Value (USD Million) Forecast by Physical Form, 2020-2035
  • Table 32: Latin America Market Volume (Units) Forecast by Physical Form, 2020-2035
  • Table 33: Latin America Market Value (USD Million) Forecast by Application, 2020-2035
  • Table 34: Latin America Market Volume (Units) Forecast by Application, 2020-2035
  • Table 35: Latin America Market Value (USD Million) Forecast by End Use, 2020-2035
  • Table 36: Latin America Market Volume (Units) Forecast by End Use, 2020-2035
  • Table 37: Europe Market Value (USD Million) Forecast by Country, 2020-2035
  • Table 38: Europe Market Volume (Units) Forecast by Country, 2020-2035
  • Table 39: Europe Market Value (USD Million) Forecast by Chemistry, 2020-2035
  • Table 40: Europe Market Volume (Units) Forecast by Chemistry, 2020-2035
  • Table 41: Europe Market Value (USD Million) Forecast by Function, 2020-2035
  • Table 42: Europe Market Volume (Units) Forecast by Function, 2020-2035
  • Table 43: Europe Market Value (USD Million) Forecast by Physical Form, 2020-2035
  • Table 44: Europe Market Volume (Units) Forecast by Physical Form, 2020-2035
  • Table 45: Europe Market Value (USD Million) Forecast by Application, 2020-2035
  • Table 46: Europe Market Volume (Units) Forecast by Application, 2020-2035
  • Table 47: Europe Market Value (USD Million) Forecast by End Use, 2020-2035
  • Table 48: Europe Market Volume (Units) Forecast by End Use, 2020-2035
  • Table 49: East Asia Market Value (USD Million) Forecast by Country, 2020-2035
  • Table 50: East Asia Market Volume (Units) Forecast by Country, 2020-2035
  • Table 51: East Asia Market Value (USD Million) Forecast by Chemistry, 2020-2035
  • Table 52: East Asia Market Volume (Units) Forecast by Chemistry, 2020-2035
  • Table 53: East Asia Market Value (USD Million) Forecast by Function, 2020-2035
  • Table 54: East Asia Market Volume (Units) Forecast by Function, 2020-2035
  • Table 55: East Asia Market Value (USD Million) Forecast by Physical Form, 2020-2035
  • Table 56: East Asia Market Volume (Units) Forecast by Physical Form, 2020-2035
  • Table 57: East Asia Market Value (USD Million) Forecast by Application, 2020-2035
  • Table 58: East Asia Market Volume (Units) Forecast by Application, 2020-2035
  • Table 59: East Asia Market Value (USD Million) Forecast by End Use, 2020-2035
  • Table 60: East Asia Market Volume (Units) Forecast by End Use, 2020-2035
  • Table 61: South Asia & Pacific Market Value (USD Million) Forecast by Country, 2020-2035
  • Table 62: South Asia & Pacific Market Volume (Units) Forecast by Country, 2020-2035
  • Table 63: South Asia & Pacific Market Value (USD Million) Forecast by Chemistry, 2020-2035
  • Table 64: South Asia & Pacific Market Volume (Units) Forecast by Chemistry, 2020-2035
  • Table 65: South Asia & Pacific Market Value (USD Million) Forecast by Function, 2020-2035
  • Table 66: South Asia & Pacific Market Volume (Units) Forecast by Function, 2020-2035
  • Table 67: South Asia & Pacific Market Value (USD Million) Forecast by Physical Form, 2020-2035
  • Table 68: South Asia & Pacific Market Volume (Units) Forecast by Physical Form, 2020-2035
  • Table 69: South Asia & Pacific Market Value (USD Million) Forecast by Application, 2020-2035
  • Table 70: South Asia & Pacific Market Volume (Units) Forecast by Application, 2020-2035
  • Table 71: South Asia & Pacific Market Value (USD Million) Forecast by End Use, 2020-2035
  • Table 72: South Asia & Pacific Market Volume (Units) Forecast by End Use, 2020-2035
  • Table 73: Middle East and Africa Market Value (USD Million) Forecast by Country, 2020-2035
  • Table 74: Middle East and Africa Market Volume (Units) Forecast by Country, 2020-2035
  • Table 75: Middle East and Africa Market Value (USD Million) Forecast by Chemistry, 2020-2035
  • Table 76: Middle East and Africa Market Volume (Units) Forecast by Chemistry, 2020-2035
  • Table 77: Middle East and Africa Market Value (USD Million) Forecast by Function, 2020-2035
  • Table 78: Middle East and Africa Market Volume (Units) Forecast by Function, 2020-2035
  • Table 79: Middle East and Africa Market Value (USD Million) Forecast by Physical Form, 2020-2035
  • Table 80: Middle East and Africa Market Volume (Units) Forecast by Physical Form, 2020-2035
  • Table 81: Middle East and Africa Market Value (USD Million) Forecast by Application, 2020-2035
  • Table 82: Middle East and Africa Market Volume (Units) Forecast by Application, 2020-2035
  • Table 83: Middle East and Africa Market Value (USD Million) Forecast by End Use, 2020-2035
  • Table 84: Middle East and Africa Market Volume (Units) Forecast by End Use, 2020-2035

List of Figures

  • Figure 1: Global Market Value (USD Million) by Chemistry, 2025-2035
  • Figure 2: Global Market Value (USD Million) by Function, 2025-2035
  • Figure 3: Global Market Value (USD Million) by Physical Form, 2025-2035
  • Figure 4: Global Market Value (USD Million) by Application, 2025-2035
  • Figure 5: Global Market Value (USD Million) by End Use, 2025-2035
  • Figure 6: Global Market Value (USD Million) by Region, 2025-2035
  • Figure 7: Global Market Value (USD Million) Analysis by Region, 2020-2035
  • Figure 8: Global Market Volume (Units) Analysis by Region, 2020-2035
  • Figure 9: Global Market Value Share (%) and BPS Analysis by Region, 2025-2035
  • Figure 10: Global Market Y-o-Y Growth (%) Projections by Region, 2025-2035
  • Figure 11: Global Market Value (USD Million) Analysis by Chemistry, 2020-2035
  • Figure 12: Global Market Volume (Units) Analysis by Chemistry, 2020-2035
  • Figure 13: Global Market Value Share (%) and BPS Analysis by Chemistry, 2025-2035
  • Figure 14: Global Market Y-o-Y Growth (%) Projections by Chemistry, 2025-2035
  • Figure 15: Global Market Value (USD Million) Analysis by Function, 2020-2035
  • Figure 16: Global Market Volume (Units) Analysis by Function, 2020-2035
  • Figure 17: Global Market Value Share (%) and BPS Analysis by Function, 2025-2035
  • Figure 18: Global Market Y-o-Y Growth (%) Projections by Function, 2025-2035
  • Figure 19: Global Market Value (USD Million) Analysis by Physical Form, 2020-2035
  • Figure 20: Global Market Volume (Units) Analysis by Physical Form, 2020-2035
  • Figure 21: Global Market Value Share (%) and BPS Analysis by Physical Form, 2025-2035
  • Figure 22: Global Market Y-o-Y Growth (%) Projections by Physical Form, 2025-2035
  • Figure 23: Global Market Value (USD Million) Analysis by Application, 2020-2035
  • Figure 24: Global Market Volume (Units) Analysis by Application, 2020-2035
  • Figure 25: Global Market Value Share (%) and BPS Analysis by Application, 2025-2035
  • Figure 26: Global Market Y-o-Y Growth (%) Projections by Application, 2025-2035
  • Figure 27: Global Market Value (USD Million) Analysis by End Use, 2020-2035
  • Figure 28: Global Market Volume (Units) Analysis by End Use, 2020-2035
  • Figure 29: Global Market Value Share (%) and BPS Analysis by End Use, 2025-2035
  • Figure 30: Global Market Y-o-Y Growth (%) Projections by End Use, 2025-2035
  • Figure 31: Global Market Attractiveness by Chemistry, 2025-2035
  • Figure 32: Global Market Attractiveness by Function, 2025-2035
  • Figure 33: Global Market Attractiveness by Physical Form, 2025-2035
  • Figure 34: Global Market Attractiveness by Application, 2025-2035
  • Figure 35: Global Market Attractiveness by End Use, 2025-2035
  • Figure 36: Global Market Attractiveness by Region, 2025-2035
  • Figure 37: North America Market Value (USD Million) by Chemistry, 2025-2035
  • Figure 38: North America Market Value (USD Million) by Function, 2025-2035
  • Figure 39: North America Market Value (USD Million) by Physical Form, 2025-2035
  • Figure 40: North America Market Value (USD Million) by Application, 2025-2035
  • Figure 41: North America Market Value (USD Million) by End Use, 2025-2035
  • Figure 42: North America Market Value (USD Million) by Country, 2025-2035
  • Figure 43: North America Market Value (USD Million) Analysis by Country, 2020-2035
  • Figure 44: North America Market Volume (Units) Analysis by Country, 2020-2035
  • Figure 45: North America Market Value Share (%) and BPS Analysis by Country, 2025-2035
  • Figure 46: North America Market Y-o-Y Growth (%) Projections by Country, 2025-2035
  • Figure 47: North America Market Value (USD Million) Analysis by Chemistry, 2020-2035
  • Figure 48: North America Market Volume (Units) Analysis by Chemistry, 2020-2035
  • Figure 49: North America Market Value Share (%) and BPS Analysis by Chemistry, 2025-2035
  • Figure 50: North America Market Y-o-Y Growth (%) Projections by Chemistry, 2025-2035
  • Figure 51: North America Market Value (USD Million) Analysis by Function, 2020-2035
  • Figure 52: North America Market Volume (Units) Analysis by Function, 2020-2035
  • Figure 53: North America Market Value Share (%) and BPS Analysis by Function, 2025-2035
  • Figure 54: North America Market Y-o-Y Growth (%) Projections by Function, 2025-2035
  • Figure 55: North America Market Value (USD Million) Analysis by Physical Form, 2020-2035
  • Figure 56: North America Market Volume (Units) Analysis by Physical Form, 2020-2035
  • Figure 57: North America Market Value Share (%) and BPS Analysis by Physical Form, 2025-2035
  • Figure 58: North America Market Y-o-Y Growth (%) Projections by Physical Form, 2025-2035
  • Figure 59: North America Market Value (USD Million) Analysis by Application, 2020-2035
  • Figure 60: North America Market Volume (Units) Analysis by Application, 2020-2035
  • Figure 61: North America Market Value Share (%) and BPS Analysis by Application, 2025-2035
  • Figure 62: North America Market Y-o-Y Growth (%) Projections by Application, 2025-2035
  • Figure 63: North America Market Value (USD Million) Analysis by End Use, 2020-2035
  • Figure 64: North America Market Volume (Units) Analysis by End Use, 2020-2035
  • Figure 65: North America Market Value Share (%) and BPS Analysis by End Use, 2025-2035
  • Figure 66: North America Market Y-o-Y Growth (%) Projections by End Use, 2025-2035
  • Figure 67: North America Market Attractiveness by Chemistry, 2025-2035
  • Figure 68: North America Market Attractiveness by Function, 2025-2035
  • Figure 69: North America Market Attractiveness by Physical Form, 2025-2035
  • Figure 70: North America Market Attractiveness by Application, 2025-2035
  • Figure 71: North America Market Attractiveness by End Use, 2025-2035
  • Figure 72: North America Market Attractiveness by Country, 2025-2035
  • Figure 73: Latin America Market Value (USD Million) by Chemistry, 2025-2035
  • Figure 74: Latin America Market Value (USD Million) by Function, 2025-2035
  • Figure 75: Latin America Market Value (USD Million) by Physical Form, 2025-2035
  • Figure 76: Latin America Market Value (USD Million) by Application, 2025-2035
  • Figure 77: Latin America Market Value (USD Million) by End Use, 2025-2035
  • Figure 78: Latin America Market Value (USD Million) by Country, 2025-2035
  • Figure 79: Latin America Market Value (USD Million) Analysis by Country, 2020-2035
  • Figure 80: Latin America Market Volume (Units) Analysis by Country, 2020-2035
  • Figure 81: Latin America Market Value Share (%) and BPS Analysis by Country, 2025-2035
  • Figure 82: Latin America Market Y-o-Y Growth (%) Projections by Country, 2025-2035
  • Figure 83: Latin America Market Value (USD Million) Analysis by Chemistry, 2020-2035
  • Figure 84: Latin America Market Volume (Units) Analysis by Chemistry, 2020-2035
  • Figure 85: Latin America Market Value Share (%) and BPS Analysis by Chemistry, 2025-2035
  • Figure 86: Latin America Market Y-o-Y Growth (%) Projections by Chemistry, 2025-2035
  • Figure 87: Latin America Market Value (USD Million) Analysis by Function, 2020-2035
  • Figure 88: Latin America Market Volume (Units) Analysis by Function, 2020-2035
  • Figure 89: Latin America Market Value Share (%) and BPS Analysis by Function, 2025-2035
  • Figure 90: Latin America Market Y-o-Y Growth (%) Projections by Function, 2025-2035
  • Figure 91: Latin America Market Value (USD Million) Analysis by Physical Form, 2020-2035
  • Figure 92: Latin America Market Volume (Units) Analysis by Physical Form, 2020-2035
  • Figure 93: Latin America Market Value Share (%) and BPS Analysis by Physical Form, 2025-2035
  • Figure 94: Latin America Market Y-o-Y Growth (%) Projections by Physical Form, 2025-2035
  • Figure 95: Latin America Market Value (USD Million) Analysis by Application, 2020-2035
  • Figure 96: Latin America Market Volume (Units) Analysis by Application, 2020-2035
  • Figure 97: Latin America Market Value Share (%) and BPS Analysis by Application, 2025-2035
  • Figure 98: Latin America Market Y-o-Y Growth (%) Projections by Application, 2025-2035
  • Figure 99: Latin America Market Value (USD Million) Analysis by End Use, 2020-2035
  • Figure 100: Latin America Market Volume (Units) Analysis by End Use, 2020-2035
  • Figure 101: Latin America Market Value Share (%) and BPS Analysis by End Use, 2025-2035
  • Figure 102: Latin America Market Y-o-Y Growth (%) Projections by End Use, 2025-2035
  • Figure 103: Latin America Market Attractiveness by Chemistry, 2025-2035
  • Figure 104: Latin America Market Attractiveness by Function, 2025-2035
  • Figure 105: Latin America Market Attractiveness by Physical Form, 2025-2035
  • Figure 106: Latin America Market Attractiveness by Application, 2025-2035
  • Figure 107: Latin America Market Attractiveness by End Use, 2025-2035
  • Figure 108: Latin America Market Attractiveness by Country, 2025-2035
  • Figure 109: Europe Market Value (USD Million) by Chemistry, 2025-2035
  • Figure 110: Europe Market Value (USD Million) by Function, 2025-2035
  • Figure 111: Europe Market Value (USD Million) by Physical Form, 2025-2035
  • Figure 112: Europe Market Value (USD Million) by Application, 2025-2035
  • Figure 113: Europe Market Value (USD Million) by End Use, 2025-2035
  • Figure 114: Europe Market Value (USD Million) by Country, 2025-2035
  • Figure 115: Europe Market Value (USD Million) Analysis by Country, 2020-2035
  • Figure 116: Europe Market Volume (Units) Analysis by Country, 2020-2035
  • Figure 117: Europe Market Value Share (%) and BPS Analysis by Country, 2025-2035
  • Figure 118: Europe Market Y-o-Y Growth (%) Projections by Country, 2025-2035
  • Figure 119: Europe Market Value (USD Million) Analysis by Chemistry, 2020-2035
  • Figure 120: Europe Market Volume (Units) Analysis by Chemistry, 2020-2035
  • Figure 121: Europe Market Value Share (%) and BPS Analysis by Chemistry, 2025-2035
  • Figure 122: Europe Market Y-o-Y Growth (%) Projections by Chemistry, 2025-2035
  • Figure 123: Europe Market Value (USD Million) Analysis by Function, 2020-2035
  • Figure 124: Europe Market Volume (Units) Analysis by Function, 2020-2035
  • Figure 125: Europe Market Value Share (%) and BPS Analysis by Function, 2025-2035
  • Figure 126: Europe Market Y-o-Y Growth (%) Projections by Function, 2025-2035
  • Figure 127: Europe Market Value (USD Million) Analysis by Physical Form, 2020-2035
  • Figure 128: Europe Market Volume (Units) Analysis by Physical Form, 2020-2035
  • Figure 129: Europe Market Value Share (%) and BPS Analysis by Physical Form, 2025-2035
  • Figure 130: Europe Market Y-o-Y Growth (%) Projections by Physical Form, 2025-2035
  • Figure 131: Europe Market Value (USD Million) Analysis by Application, 2020-2035
  • Figure 132: Europe Market Volume (Units) Analysis by Application, 2020-2035
  • Figure 133: Europe Market Value Share (%) and BPS Analysis by Application, 2025-2035
  • Figure 134: Europe Market Y-o-Y Growth (%) Projections by Application, 2025-2035
  • Figure 135: Europe Market Value (USD Million) Analysis by End Use, 2020-2035
  • Figure 136: Europe Market Volume (Units) Analysis by End Use, 2020-2035
  • Figure 137: Europe Market Value Share (%) and BPS Analysis by End Use, 2025-2035
  • Figure 138: Europe Market Y-o-Y Growth (%) Projections by End Use, 2025-2035
  • Figure 139: Europe Market Attractiveness by Chemistry, 2025-2035
  • Figure 140: Europe Market Attractiveness by Function, 2025-2035
  • Figure 141: Europe Market Attractiveness by Physical Form, 2025-2035
  • Figure 142: Europe Market Attractiveness by Application, 2025-2035
  • Figure 143: Europe Market Attractiveness by End Use, 2025-2035
  • Figure 144: Europe Market Attractiveness by Country, 2025-2035
  • Figure 145: East Asia Market Value (USD Million) by Chemistry, 2025-2035
  • Figure 146: East Asia Market Value (USD Million) by Function, 2025-2035
  • Figure 147: East Asia Market Value (USD Million) by Physical Form, 2025-2035
  • Figure 148: East Asia Market Value (USD Million) by Application, 2025-2035
  • Figure 149: East Asia Market Value (USD Million) by End Use, 2025-2035
  • Figure 150: East Asia Market Value (USD Million) by Country, 2025-2035
  • Figure 151: East Asia Market Value (USD Million) Analysis by Country, 2020-2035
  • Figure 152: East Asia Market Volume (Units) Analysis by Country, 2020-2035
  • Figure 153: East Asia Market Value Share (%) and BPS Analysis by Country, 2025-2035
  • Figure 154: East Asia Market Y-o-Y Growth (%) Projections by Country, 2025-2035
  • Figure 155: East Asia Market Value (USD Million) Analysis by Chemistry, 2020-2035
  • Figure 156: East Asia Market Volume (Units) Analysis by Chemistry, 2020-2035
  • Figure 157: East Asia Market Value Share (%) and BPS Analysis by Chemistry, 2025-2035
  • Figure 158: East Asia Market Y-o-Y Growth (%) Projections by Chemistry, 2025-2035
  • Figure 159: East Asia Market Value (USD Million) Analysis by Function, 2020-2035
  • Figure 160: East Asia Market Volume (Units) Analysis by Function, 2020-2035
  • Figure 161: East Asia Market Value Share (%) and BPS Analysis by Function, 2025-2035
  • Figure 162: East Asia Market Y-o-Y Growth (%) Projections by Function, 2025-2035
  • Figure 163: East Asia Market Value (USD Million) Analysis by Physical Form, 2020-2035
  • Figure 164: East Asia Market Volume (Units) Analysis by Physical Form, 2020-2035
  • Figure 165: East Asia Market Value Share (%) and BPS Analysis by Physical Form, 2025-2035
  • Figure 166: East Asia Market Y-o-Y Growth (%) Projections by Physical Form, 2025-2035
  • Figure 167: East Asia Market Value (USD Million) Analysis by Application, 2020-2035
  • Figure 168: East Asia Market Volume (Units) Analysis by Application, 2020-2035
  • Figure 169: East Asia Market Value Share (%) and BPS Analysis by Application, 2025-2035
  • Figure 170: East Asia Market Y-o-Y Growth (%) Projections by Application, 2025-2035
  • Figure 171: East Asia Market Value (USD Million) Analysis by End Use, 2020-2035
  • Figure 172: East Asia Market Volume (Units) Analysis by End Use, 2020-2035
  • Figure 173: East Asia Market Value Share (%) and BPS Analysis by End Use, 2025-2035
  • Figure 174: East Asia Market Y-o-Y Growth (%) Projections by End Use, 2025-2035
  • Figure 175: East Asia Market Attractiveness by Chemistry, 2025-2035
  • Figure 176: East Asia Market Attractiveness by Function, 2025-2035
  • Figure 177: East Asia Market Attractiveness by Physical Form, 2025-2035
  • Figure 178: East Asia Market Attractiveness by Application, 2025-2035
  • Figure 179: East Asia Market Attractiveness by End Use, 2025-2035
  • Figure 180: East Asia Market Attractiveness by Country, 2025-2035
  • Figure 181: South Asia & Pacific Market Value (USD Million) by Chemistry, 2025-2035
  • Figure 182: South Asia & Pacific Market Value (USD Million) by Function, 2025-2035
  • Figure 183: South Asia & Pacific Market Value (USD Million) by Physical Form, 2025-2035
  • Figure 184: South Asia & Pacific Market Value (USD Million) by Application, 2025-2035
  • Figure 185: South Asia & Pacific Market Value (USD Million) by End Use, 2025-2035
  • Figure 186: South Asia & Pacific Market Value (USD Million) by Country, 2025-2035
  • Figure 187: South Asia & Pacific Market Value (USD Million) Analysis by Country, 2020-2035
  • Figure 188: South Asia & Pacific Market Volume (Units) Analysis by Country, 2020-2035
  • Figure 189: South Asia & Pacific Market Value Share (%) and BPS Analysis by Country, 2025-2035
  • Figure 190: South Asia & Pacific Market Y-o-Y Growth (%) Projections by Country, 2025-2035
  • Figure 191: South Asia & Pacific Market Value (USD Million) Analysis by Chemistry, 2020-2035
  • Figure 192: South Asia & Pacific Market Volume (Units) Analysis by Chemistry, 2020-2035
  • Figure 193: South Asia & Pacific Market Value Share (%) and BPS Analysis by Chemistry, 2025-2035
  • Figure 194: South Asia & Pacific Market Y-o-Y Growth (%) Projections by Chemistry, 2025-2035
  • Figure 195: South Asia & Pacific Market Value (USD Million) Analysis by Function, 2020-2035
  • Figure 196: South Asia & Pacific Market Volume (Units) Analysis by Function, 2020-2035
  • Figure 197: South Asia & Pacific Market Value Share (%) and BPS Analysis by Function, 2025-2035
  • Figure 198: South Asia & Pacific Market Y-o-Y Growth (%) Projections by Function, 2025-2035
  • Figure 199: South Asia & Pacific Market Value (USD Million) Analysis by Physical Form, 2020-2035
  • Figure 200: South Asia & Pacific Market Volume (Units) Analysis by Physical Form, 2020-2035
  • Figure 201: South Asia & Pacific Market Value Share (%) and BPS Analysis by Physical Form, 2025-2035
  • Figure 202: South Asia & Pacific Market Y-o-Y Growth (%) Projections by Physical Form, 2025-2035
  • Figure 203: South Asia & Pacific Market Value (USD Million) Analysis by Application, 2020-2035
  • Figure 204: South Asia & Pacific Market Volume (Units) Analysis by Application, 2020-2035
  • Figure 205: South Asia & Pacific Market Value Share (%) and BPS Analysis by Application, 2025-2035
  • Figure 206: South Asia & Pacific Market Y-o-Y Growth (%) Projections by Application, 2025-2035
  • Figure 207: South Asia & Pacific Market Value (USD Million) Analysis by End Use, 2020-2035
  • Figure 208: South Asia & Pacific Market Volume (Units) Analysis by End Use, 2020-2035
  • Figure 209: South Asia & Pacific Market Value Share (%) and BPS Analysis by End Use, 2025-2035
  • Figure 210: South Asia & Pacific Market Y-o-Y Growth (%) Projections by End Use, 2025-2035
  • Figure 211: South Asia & Pacific Market Attractiveness by Chemistry, 2025-2035
  • Figure 212: South Asia & Pacific Market Attractiveness by Function, 2025-2035
  • Figure 213: South Asia & Pacific Market Attractiveness by Physical Form, 2025-2035
  • Figure 214: South Asia & Pacific Market Attractiveness by Application, 2025-2035
  • Figure 215: South Asia & Pacific Market Attractiveness by End Use, 2025-2035
  • Figure 216: South Asia & Pacific Market Attractiveness by Country, 2025-2035
  • Figure 217: Middle East and Africa Market Value (USD Million) by Chemistry, 2025-2035
  • Figure 218: Middle East and Africa Market Value (USD Million) by Function, 2025-2035
  • Figure 219: Middle East and Africa Market Value (USD Million) by Physical Form, 2025-2035
  • Figure 220: Middle East and Africa Market Value (USD Million) by Application, 2025-2035
  • Figure 221: Middle East and Africa Market Value (USD Million) by End Use, 2025-2035
  • Figure 222: Middle East and Africa Market Value (USD Million) by Country, 2025-2035
  • Figure 223: Middle East and Africa Market Value (USD Million) Analysis by Country, 2020-2035
  • Figure 224: Middle East and Africa Market Volume (Units) Analysis by Country, 2020-2035
  • Figure 225: Middle East and Africa Market Value Share (%) and BPS Analysis by Country, 2025-2035
  • Figure 226: Middle East and Africa Market Y-o-Y Growth (%) Projections by Country, 2025-2035
  • Figure 227: Middle East and Africa Market Value (USD Million) Analysis by Chemistry, 2020-2035
  • Figure 228: Middle East and Africa Market Volume (Units) Analysis by Chemistry, 2020-2035
  • Figure 229: Middle East and Africa Market Value Share (%) and BPS Analysis by Chemistry, 2025-2035
  • Figure 230: Middle East and Africa Market Y-o-Y Growth (%) Projections by Chemistry, 2025-2035
  • Figure 231: Middle East and Africa Market Value (USD Million) Analysis by Function, 2020-2035
  • Figure 232: Middle East and Africa Market Volume (Units) Analysis by Function, 2020-2035
  • Figure 233: Middle East and Africa Market Value Share (%) and BPS Analysis by Function, 2025-2035
  • Figure 234: Middle East and Africa Market Y-o-Y Growth (%) Projections by Function, 2025-2035
  • Figure 235: Middle East and Africa Market Value (USD Million) Analysis by Physical Form, 2020-2035
  • Figure 236: Middle East and Africa Market Volume (Units) Analysis by Physical Form, 2020-2035
  • Figure 237: Middle East and Africa Market Value Share (%) and BPS Analysis by Physical Form, 2025-2035
  • Figure 238: Middle East and Africa Market Y-o-Y Growth (%) Projections by Physical Form, 2025-2035
  • Figure 239: Middle East and Africa Market Value (USD Million) Analysis by Application, 2020-2035
  • Figure 240: Middle East and Africa Market Volume (Units) Analysis by Application, 2020-2035
  • Figure 241: Middle East and Africa Market Value Share (%) and BPS Analysis by Application, 2025-2035
  • Figure 242: Middle East and Africa Market Y-o-Y Growth (%) Projections by Application, 2025-2035
  • Figure 243: Middle East and Africa Market Value (USD Million) Analysis by End Use, 2020-2035
  • Figure 244: Middle East and Africa Market Volume (Units) Analysis by End Use, 2020-2035
  • Figure 245: Middle East and Africa Market Value Share (%) and BPS Analysis by End Use, 2025-2035
  • Figure 246: Middle East and Africa Market Y-o-Y Growth (%) Projections by End Use, 2025-2035
  • Figure 247: Middle East and Africa Market Attractiveness by Chemistry, 2025-2035
  • Figure 248: Middle East and Africa Market Attractiveness by Function, 2025-2035
  • Figure 249: Middle East and Africa Market Attractiveness by Physical Form, 2025-2035
  • Figure 250: Middle East and Africa Market Attractiveness by Application, 2025-2035
  • Figure 251: Middle East and Africa Market Attractiveness by End Use, 2025-2035
  • Figure 252: Middle East and Africa Market Attractiveness by Country, 2025-2035

Frequently Asked Questions

How big is the Opacifiers Market in 2025?

The global Opacifiers Market is estimated to be valued at USD 1,953.2 million in 2025.

What will be the size of the Opacifiers Market in 2035?

The market size for the Opacifiers Market is projected to reach USD 4,401.2 million by 2035.

How much will be the Opacifiers Market growth between 2025 and 2035?

The Opacifiers Market is expected to grow at a CAGR of 8.5% between 2025 and 2035.

What are the key product types in the Opacifiers Market?

The key product types in the Opacifiers Market are titanium dioxide and other alternative chemistries, available in liquid dispersions, powder concentrates, and encapsulated forms.

Which functional segment will contribute a significant share in the Opacifiers Market in 2025?

In terms of function, the appearance enhancement segment is set to command a 47.1% share in the Opacifiers Market in 2025.

Future Market Insights

Opacifiers Market

Chat With MaRIA

Chat With

MaRIA

Hi There, I am MaRIA, Your Market Research Intelligence Assistant. How may I help you?