Oryzenin Market Forecast and Outlook 2025 to 2035

The market is estimated to be valued at USD 136.3 billion in 2025 and is projected to reach USD 299.8 billion by 2035, registering a CAGR of 8.2% over the forecast period. The market is projected to add an absolute dollar opportunity of USD 163.6 billion over the forecast period, reflecting a 2.20 times growth.
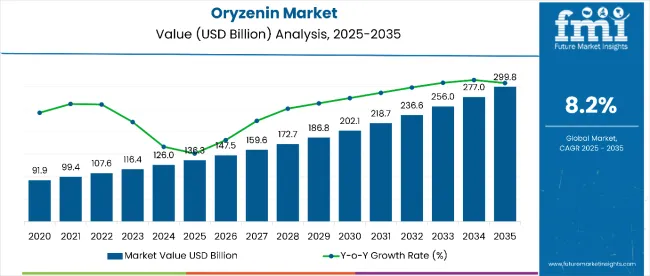
Quick Stats for Oryzenin Market

  • Oryzenin Market Value (2025): USD 136.3 billion
  • Oryzenin Market Forecast Value (2035): USD 299.8 billion
  • Oryzenin Market Forecast CAGR: 8.2%
  • Leading Segment in Oryzenin Market 2025: Isolates (45%)
  • Leading Regions in Oryzenin Market 2025: North America and Europe
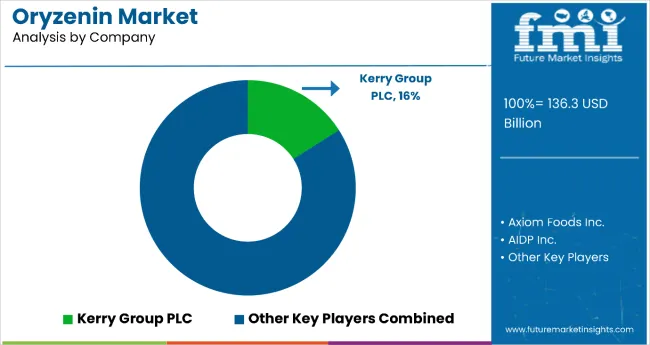
  • Top Key Players in Oryzenin Market: Kerry Group PLC (16.0%), Axiom Foods Inc., AIDP Inc., Südzucker AG (BENEO GmbH), and Bioway Organic Group Ltd.

Oryzenin Market

Metric Value
Market Estimated Value in (2025E) USD 136.3 billion
Market Forecast Value in (2035F) USD 299.8 billion
Forecast CAGR (2025 to 2035) 8.2%

The market growth is anticipated to be driven by increasing demand for plant-based proteins, wider applications in sports nutrition, and rising incorporation into gluten-free food products.

By 2030, the market is likely to reach approximately USD 202.5 billion, accounting for USD 66.2 billion in incremental value over the first half of the decade. The market is projected to grow by an absolute dollar value of USD 163.6 billion between 2025 and 2035. The remaining USD 97.3 billion is expected during the second half, suggesting an accelerating growth trend. Product adoption is gaining traction due to oryzenin’s high digestibility, balanced amino acid profile, and allergen-free nature compared to conventional protein sources.

Companies including Kerry Group PLC, Axiom Foods Inc., AIDP Inc., Südzucker AG (BENEO GmbH), and Bioway Organic Group Ltd. are strengthening their competitive positions through investments in advanced protein extraction technologies and diversification into value-added formulations. Growing health-conscious consumer preferences are driving expansion into functional beverages, sports nutrition powders, and dietary supplements. Market growth is expected to remain supported by emphasis on organic certification, high protein purity, and sustainable rice farming practices, ensuring both quality and environmental responsibility.

The oryzenin market holds a significant share across its parent industries, reflecting its growing adoption as a plant-based, hypoallergenic protein source. In the plant-based rice protein sector, oryzenin accounts for approximately 37% of the market, driven by its clean-label appeal and digestibility, making it a preferred choice for health-conscious and vegan consumers. In the plant-based sports nutrition protein segment, it represents around 33%, supported by its increasing use in protein powders, meal replacement shakes, and energy bars. The market contributes nearly 28% to the gluten-free protein ingredient segment, particularly for bakery, confectionery, and ready-to-drink applications. It holds close to 25% of the allergen-free protein market, valued for being free from common allergens such as soy, dairy, and gluten. The share in the organic plant protein market reaches about 29%, reflecting rising adoption among consumers seeking natural and sustainably sourced protein alternatives.

The market indicate a strong rise in demand for clean-label, plant-based protein ingredients, driven by increasing consumer preference for hypoallergenic, sustainable, and functional nutrition. Manufacturers are innovating to improve protein purity, digestibility, and amino acid profile through advanced processing methods such as enzymatic extraction and sprouted rice protein production. Growing regulatory focus on food safety and labeling standards is prompting companies to develop organic-certified, flavored, and fortified oryzenin formulations. At the same time, expanding applications in vegan snacks, ready-to-drink beverages, and fortified bakery products are shaping market strategies, encouraging investment in research and development for high-performance, versatile, and sustainable protein solutions.

Why is the Oryzenin Market Growing?

Oryzenin, a rice-derived protein, is gaining momentum as a sustainable, plant-based alternative to animal proteins due to its high digestibility, hypoallergenic nature, and balanced amino acid profile. Its clean-label positioning aligns with the surging demand for natural, allergen-free, and vegan-friendly ingredients across food, beverage, and nutraceutical sectors.

The growing popularity of plant-based diets and protein fortification in sports nutrition, weight management products, and functional foods is driving adoption. Technological advancements in protein extraction and processing are improving oryzenin’s solubility, taste, and texture, expanding its application in ready-to-drink beverages, protein powders, and gluten-free bakery products.

With health-conscious consumers increasingly favoring sustainable, allergen-free proteins, and manufacturers pursuing versatile, high-quality plant-based options, the outlook for the oryzenin market remains robust. Its application in clean-label, high-protein formulations positions it to secure an expanding share of the global plant-based protein landscape.

Oryzenin Market Analysis by Top Investment Segments

The market is segmented by product type, application, function, form, and region. By product type, the market is divided into isolates, concentrates, and others such as hydrolysates. Based on application, the market is segmented into sports & energy nutrition, beverages, bakery & confectionery, meat analogs & extenders, dairy alternatives, and other applications. By form, the market is bifurcated into dry and liquid. Based on function, the market is segmented into emulsifying, texturizing, gelling, and others such as foaming. Regionally, the market spans across North America, Latin America, Western Europe, Eastern Europe, South Asia & Pacific, East Asia, and the Middle East & Africa.
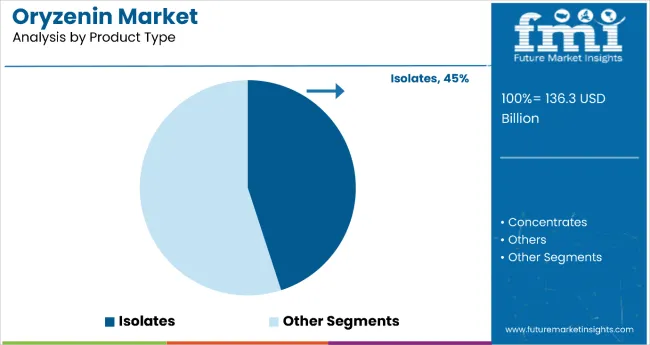
By Product Type, Isolates Account for 45% of the Market Share

Oryzenin Market By Product

The isolates segment holds a dominant position with 45% of market share in 2025, driven by their exceptionally high protein concentration (often above 80% purity), superior solubility, and neutral taste profile, making them the preferred choice for premium sports nutrition, functional beverages, and plant-based protein formulations. Isolates also deliver a hypoallergenic, gluten-free, and non-GMO solution, aligning perfectly with clean-label and vegan trends.

The strong growth of the isolates segment is further fueled by the rising demand for high-performance plant proteins in both developed and emerging markets. Food and beverage manufacturers are increasingly reformulating products to meet consumer preferences for sustainable and allergen-friendly protein sources, with isolates offering the highest functional and nutritional advantages. Additionally, advancements in extraction technology have improved yield, purity, and cost efficiency, making isolates more accessible for large-scale production.
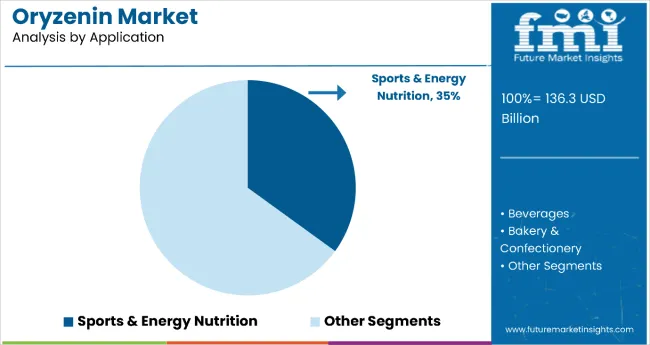
By Application, Sports & Energy Nutrition Segment Accounts for 35% Share in 2025

Oryzenin Market By Application

The sports & energy nutrition segment dominates with a 35% market share, making it the most lucrative application segment for oryzenin. Its dominance stems from the protein's clean-label appeal, high digestibility, and hypoallergenic profile, which align perfectly with the nutritional needs of athletes and fitness enthusiasts. Oryzenin isolates, in particular, are prized in this segment for their high protein purity, neutral flavor, and smooth texture, making them ideal for protein powders, recovery beverages, and performance bars.

Formulators increasingly favor oryzenin for its ability to deliver enhanced amino acid profiles while avoiding common allergens like soy and dairy a key differentiator amid rising gluten-free and vegan trends. Additionally, advances in protein extraction and processing techniques have boosted oryzenin's functional properties (solubility, mouthfeel, stability), enabling manufacturers to create next-gen sports nutrition products that meet both taste and performance demands.

What are the Drivers, Restraints, and Key Trends of the Oryzenin Market?

Between 2025 and 2035, the global rise in sports nutrition and plant-based diets is set to be the main growth driver for the oryzenin market. Health- and fitness-conscious consumers are increasingly seeking clean-label, allergen-free, and high-protein solutions, making oryzenin, particularly isolates with over 80% protein purity, a preferred ingredient in premium sports nutrition, functional foods, and nutraceutical formulations.

Rising Demand for Plant-Based Proteins Drives Oryzenin Market Growth

The steady increase in demand for plant-based nutrition and functional protein ingredients has been identified as the primary catalyst for growth in the oryzenin market. In 2024, breakthrough applications in sports nutrition, dairy alternatives, and gluten-free bakery products prompted food & beverage companies globally to incorporate oryzenin into innovative formulations. These developments indicate that consistent innovation in plant-based food and beverage segments, rather than short-term dietary trends, are fueling procurement cycles.

Integration as a Functional Ingredient Drives Market Growth

In 2024, food and beverage manufacturers began incorporating oryzenin into multi-functional product formulations to boost texture, protein content, and overall nutritional value, while preserving allergen-free positioning. By 2025, oryzenin-based ingredients were increasingly embedded in product development strategies across sports nutrition, energy bars, dairy alternatives, and bakery applications. These implementations highlight that positioning oryzenin as a core functional ingredient enhances product performance, market appeal, and nutritional credentials, supporting broader adoption and market expansion.
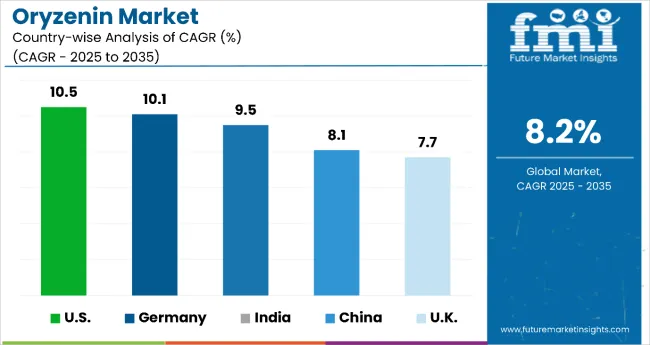
Oryzenin Market Analysis by Top Countries

Oryzenin Market By Country

Countries CAGR (2025 to 2035)
USA 10.5%
Germany 10.1%
India 9.5%
China 8.1%
UK 7.7%

In the oryzenin market, the USA leads with a CAGR at 10.5%, reflecting its mature sports nutrition sector, advanced R&D, and strong export capabilities. Germany follows closely at 10.1%, driven by its leadership in clean-label food manufacturing, strict allergen regulations, and plant protein innovation. India, with a 9.5% CAGR, benefits from abundant rice production, a growing middle-class consumer base, and government-backed agricultural exports, positioning it as a cost-competitive manufacturing hub. China records 8.1% CAGR, leveraging its massive rice supply and expanding functional food market, with e-commerce accelerating product reach. The UK, though growing at a relatively moderate 7.7% CAGR, stands out as a premium market with high per-capita plant-based consumption and strong retail penetration.

The report covers an in-depth analysis of 40+ countries; five top-performing OECD countries are highlighted below.

Demand Expansion in Oryzenin Market in United States

The USA oryzenin market is projected to grow at a CAGR of 10.5% from 2025 to 2035, fueled by surging consumer demand for plant-based, allergen-free proteins in sports nutrition, beverages, and functional foods. The country benefits from advanced food processing infrastructure, strong R&D capabilities, and a robust nutraceutical industry that actively incorporates high-purity isolates.

  • Growing awareness of plant-based dietary benefits among athletes.
  • Well-developed supply chain and processing facilities for rice protein.
  • Strong presence of major nutraceutical and sports nutrition brands.

Sustainable Growth Trends in Oryzenin Market in Germany

Demand for oryzenin is expected to expand at a CAGR of 10.1% from 2025 to 2035, supported by its leadership in clean-label manufacturing and functional nutrition innovation. With a mature vegan and flexitarian population, demand is strong across bakery, dairy alternatives, and high-protein snacks. Strict allergen labeling laws and traceability standards drive adoption of gluten-free, non-GMO ingredients like oryzenin.

  • Strong regulatory push for allergen-free and non-GMO protein sources.
  • High integration of plant-based proteins in bakery and confectionery.
  • Leading role in sustainable and traceable ingredient sourcing.

Consumption Growth in Oryzenin Market in India

The oryzenin market in India is projected to grow at a CAGR of 9.5% between 2025 and 2035, driven by rising health consciousness, an expanding middle class, and a growing vegetarian and vegan consumer base. Rapid urbanization has led to increased adoption of protein supplements, particularly in sports nutrition and functional beverages.

  • Expanding urban demand for high-protein, plant-based supplements.
  • Strong rice cultivation base supporting cost-effective raw material sourcing.
  • Rise in health clubs and fitness centers driving protein consumption.

Market Development in Oryzenin Market in China

Demand for oryzenin in China is expected to grow at a CAGR of 8.1% from 2025 to 2035, driven by rapid growth in the functional food and beverage sector, rising disposable incomes, and increased focus on healthy diets. The country’s vast rice production capacity ensures reliable raw material supply, supporting large-scale oryzenin processing. Chinese brands are integrating plant proteins into sports drinks, fortified snacks, and meal replacements to cater to a growing health-conscious urban population.

  • Strong domestic rice supply ensuring stable raw material availability.
  • Increasing integration of plant proteins in functional beverages.
  • Expanding e-commerce channels for protein-based health products.

Product Innovation Trends in Oryzenin Market in United Kingdom

Sales of oryzenin in the UK are projected to grow at a CAGR of 7.7% between 2025 and 2035, driven by high consumer awareness of plant-based nutrition, especially in dairy alternatives and sports performance products. Veganism and flexitarianism trends continue to shape product innovation, with leading brands introducing allergen-free, gluten-free protein options. The UK benefits from strong retail penetration of functional foods and well-developed online distribution networks.
  • High per-capita consumption of plant-based dairy alternatives.
  • Strong retail presence of functional and sports nutrition products.
  • Increasing consumer preference for gluten-free formulations.

Competitive Landscape of Oryzenin Market

Oryzenin Market By Company

The oryzenin market is moderately consolidated, featuring established plant-protein manufacturers with varying degrees of extraction expertise, product purity, and application specialization. Key leaders such as Axiom Foods Inc. and RiceBran Technologies dominate the high-purity segment, supplying allergen-free rice protein for sports nutrition, infant formula, and functional food applications. Their competitive edge lies in advanced enzymatic extraction processes, consistent amino acid profiling, and strong regulatory compliance across global markets.

BENEO GmbH differentiates through clean-label solutions and innovative plant-protein blends, catering to health-conscious consumers and premium food brands in Europe and beyond. Kerry Group and Nutrition Resource Inc. focus on large-scale production, cost-effective sourcing, and integration into mainstream food, beverage, and nutraceutical categories, enabling them to capture both mass-market and mid-premium segments.

Report Scope - Oryzenin Market

Item Value
Quantitative Units USD 136.3 Billion
Product Type Isolates, Concentrates, and Others (Protein Blends, Hydrolysates, and Derivatives)
Application Sports & Energy Nutrition, Beverages, Dairy Alternatives, Bakery & Confectionery, Meat Analogs & Extenders, and Others
Function Emulsifying, Texturizing, Gelling, and Others (Stabilizing and Binding)
Form Dry and Liquid
Regions Covered North America, Europe, Asia-Pacific, Latin America, Middle East & Africa
Countries Covered United States, Canada, Germany, France, United Kingdom, China, Japan, India, Brazil, South Africa, Australia and 40+ countries
Key Companies Profiled AIDP, Inc., BENEO GmbH, Kerry Group PLC, Shenzhen Beike Biotechnology Co. Ltd, Axiom Foods, Inc., Golden Grain Group Limited, Ribus, Inc., Ricebran Technologies, Inc., The Green Labs LLC, Bioway (Xi’An) Organic Ingredients Co., Ltd.
Additional Attributes Dollar sales by source and application sector, rising demand for plant-based proteins in sports nutrition and functional foods, expansion in dairy alternatives and meat analogs, growing interest in allergen-free and gluten-free protein solutions, innovations in extraction processes improving purity, texture, and amino acid profile

Key Segments

By Product Type:

  • Isolates
  • Concentrates
  • Other Type

By Application:

  • Sports & Energy Nutrition
  • Beverages
  • Bakery & Confectionery
  • Meat Analogs & Extenders
  • Dairy Alternatives

By Function:

  • Emulsifying
  • Texturizing
  • Gelling
  • Others (Stabilizing and Foaming)

By Form:

  • Dry
  • Liquid

By Region:

  • North America
  • Latin America
  • Western Europe
  • Eastern Europe
  • South Asia and Pacific
  • East Asia
  • Middle East and Africa

Frequently Asked Questions

How big is the oryzenin market in 2025?

The global oryzenin market is estimated to be valued at USD 136.3 billion in 2025.

What will be the size of oryzenin market in 2035?

The market size for the oryzenin market is projected to reach USD 288.6 billion by 2035.

How much will be the oryzenin market growth between 2025 and 2035?

The oryzenin market is expected to grow at a 7.8% CAGR between 2025 and 2035.

What are the key product types in the oryzenin market?

The key product types in oryzenin market are isolates, concentrates and other type.

Which application segment to contribute significant share in the oryzenin market in 2025?

In terms of application, sports & energy nutrition segment to command 37.4% share in the oryzenin market in 2025.

Table of Content

  1. Executive Summary
    • Global Market Outlook
    • Demand-side Trends
    • Supply-side Trends
    • Technology Roadmap Analysis
    • Analysis and Recommendations
  2. Market Overview
    • Market Coverage / Taxonomy
    • Market Definition / Scope / Limitations
  3. Market Background
    • Market Dynamics
      • Drivers
      • Restraints
      • Opportunity
      • Trends
    • Scenario Forecast
      • Demand in Optimistic Scenario
      • Demand in Likely Scenario
      • Demand in Conservative Scenario
    • Opportunity Map Analysis
    • Product Life Cycle Analysis
    • Supply Chain Analysis
    • Investment Feasibility Matrix
    • Value Chain Analysis
    • PESTLE and Porter’s Analysis
    • Regulatory Landscape
    • Regional Parent Market Outlook
    • Production and Consumption Statistics
    • Import and Export Statistics
  4. Global Market Analysis 2020 to 2024 and Forecast, 2025 to 2035
    • Historical Market Size Value (USD Million) Analysis, 2020 to 2024
    • Current and Future Market Size Value (USD Million) Projections, 2025 to 2035
      • Y-o-Y Growth Trend Analysis
      • Absolute $ Opportunity Analysis
  5. Global Market Pricing Analysis 2020 to 2024 and Forecast 2025 to 2035
  6. Global Market Analysis 2020 to 2024 and Forecast 2025 to 2035, By Product Type
    • Introduction / Key Findings
    • Historical Market Size Value (USD Million) Analysis By Product Type , 2020 to 2024
    • Current and Future Market Size Value (USD Million) Analysis and Forecast By Product Type , 2025 to 2035
      • Isolates
      • Concentrates
      • Other Type
    • Y-o-Y Growth Trend Analysis By Product Type , 2020 to 2024
    • Absolute $ Opportunity Analysis By Product Type , 2025 to 2035
  7. Global Market Analysis 2020 to 2024 and Forecast 2025 to 2035, By Application
    • Introduction / Key Findings
    • Historical Market Size Value (USD Million) Analysis By Application, 2020 to 2024
    • Current and Future Market Size Value (USD Million) Analysis and Forecast By Application, 2025 to 2035
      • Sports & Energy Nutrition
      • Beverages
      • Bakery & Confectionery
      • Meat Analogs & Extenders
      • Dairy Alternatives
    • Y-o-Y Growth Trend Analysis By Application, 2020 to 2024
    • Absolute $ Opportunity Analysis By Application, 2025 to 2035
  8. Global Market Analysis 2020 to 2024 and Forecast 2025 to 2035, By Function
    • Introduction / Key Findings
    • Historical Market Size Value (USD Million) Analysis By Function, 2020 to 2024
    • Current and Future Market Size Value (USD Million) Analysis and Forecast By Function, 2025 to 2035
      • Emulsifying
      • Texturizing
      • Gelling
      • Others (Stabilizing and Foaming)
    • Y-o-Y Growth Trend Analysis By Function, 2020 to 2024
    • Absolute $ Opportunity Analysis By Function, 2025 to 2035
  9. Global Market Analysis 2020 to 2024 and Forecast 2025 to 2035, By Form
    • Introduction / Key Findings
    • Historical Market Size Value (USD Million) Analysis By Form, 2020 to 2024
    • Current and Future Market Size Value (USD Million) Analysis and Forecast By Form, 2025 to 2035
      • Dry
      • Liquid
    • Y-o-Y Growth Trend Analysis By Form, 2020 to 2024
    • Absolute $ Opportunity Analysis By Form, 2025 to 2035
  10. Global Market Analysis 2020 to 2024 and Forecast 2025 to 2035, By Region
    • Introduction
    • Historical Market Size Value (USD Million) Analysis By Region, 2020 to 2024
    • Current Market Size Value (USD Million) Analysis and Forecast By Region, 2025 to 2035
      • North America
      • Latin America
      • Western Europe
      • Eastern Europe
      • East Asia
      • South Asia and Pacific
      • Middle East & Africa
    • Market Attractiveness Analysis By Region
  11. North America Market Analysis 2020 to 2024 and Forecast 2025 to 2035, By Country
    • Historical Market Size Value (USD Million) Trend Analysis By Market Taxonomy, 2020 to 2024
    • Market Size Value (USD Million) Forecast By Market Taxonomy, 2025 to 2035
      • By Country
        • USA
        • Canada
        • Mexico
      • By Product Type
      • By Application
      • By Function
      • By Form
    • Market Attractiveness Analysis
      • By Country
      • By Product Type
      • By Application
      • By Function
      • By Form
    • Key Takeaways
  12. Latin America Market Analysis 2020 to 2024 and Forecast 2025 to 2035, By Country
    • Historical Market Size Value (USD Million) Trend Analysis By Market Taxonomy, 2020 to 2024
    • Market Size Value (USD Million) Forecast By Market Taxonomy, 2025 to 2035
      • By Country
        • Brazil
        • Chile
        • Rest of Latin America
      • By Product Type
      • By Application
      • By Function
      • By Form
    • Market Attractiveness Analysis
      • By Country
      • By Product Type
      • By Application
      • By Function
      • By Form
    • Key Takeaways
  13. Western Europe Market Analysis 2020 to 2024 and Forecast 2025 to 2035, By Country
    • Historical Market Size Value (USD Million) Trend Analysis By Market Taxonomy, 2020 to 2024
    • Market Size Value (USD Million) Forecast By Market Taxonomy, 2025 to 2035
      • By Country
        • Germany
        • UK
        • Italy
        • Spain
        • France
        • Nordic
        • BENELUX
        • Rest of Western Europe
      • By Product Type
      • By Application
      • By Function
      • By Form
    • Market Attractiveness Analysis
      • By Country
      • By Product Type
      • By Application
      • By Function
      • By Form
    • Key Takeaways
  14. Eastern Europe Market Analysis 2020 to 2024 and Forecast 2025 to 2035, By Country
    • Historical Market Size Value (USD Million) Trend Analysis By Market Taxonomy, 2020 to 2024
    • Market Size Value (USD Million) Forecast By Market Taxonomy, 2025 to 2035
      • By Country
        • Russia
        • Poland
        • Hungary
        • Balkan & Baltic
        • Rest of Eastern Europe
      • By Product Type
      • By Application
      • By Function
      • By Form
    • Market Attractiveness Analysis
      • By Country
      • By Product Type
      • By Application
      • By Function
      • By Form
    • Key Takeaways
  15. East Asia Market Analysis 2020 to 2024 and Forecast 2025 to 2035, By Country
    • Historical Market Size Value (USD Million) Trend Analysis By Market Taxonomy, 2020 to 2024
    • Market Size Value (USD Million) Forecast By Market Taxonomy, 2025 to 2035
      • By Country
        • China
        • Japan
        • South Korea
      • By Product Type
      • By Application
      • By Function
      • By Form
    • Market Attractiveness Analysis
      • By Country
      • By Product Type
      • By Application
      • By Function
      • By Form
    • Key Takeaways
  16. South Asia and Pacific Market Analysis 2020 to 2024 and Forecast 2025 to 2035, By Country
    • Historical Market Size Value (USD Million) Trend Analysis By Market Taxonomy, 2020 to 2024
    • Market Size Value (USD Million) Forecast By Market Taxonomy, 2025 to 2035
      • By Country
        • India
        • ASEAN
        • Australia & New Zealand
        • Rest of South Asia and Pacific
      • By Product Type
      • By Application
      • By Function
      • By Form
    • Market Attractiveness Analysis
      • By Country
      • By Product Type
      • By Application
      • By Function
      • By Form
    • Key Takeaways
  17. Middle East & Africa Market Analysis 2020 to 2024 and Forecast 2025 to 2035, By Country
    • Historical Market Size Value (USD Million) Trend Analysis By Market Taxonomy, 2020 to 2024
    • Market Size Value (USD Million) Forecast By Market Taxonomy, 2025 to 2035
      • By Country
        • Kingdom of Saudi Arabia
        • Other GCC Countries
        • Turkiye
        • South Africa
        • Other African Union
        • Rest of Middle East & Africa
      • By Product Type
      • By Application
      • By Function
      • By Form
    • Market Attractiveness Analysis
      • By Country
      • By Product Type
      • By Application
      • By Function
      • By Form
    • Key Takeaways
  18. Key Countries Market Analysis
    • USA
      • Pricing Analysis
      • Market Share Analysis, 2024
        • By Product Type
        • By Application
        • By Function
        • By Form
    • Canada
      • Pricing Analysis
      • Market Share Analysis, 2024
        • By Product Type
        • By Application
        • By Function
        • By Form
    • Mexico
      • Pricing Analysis
      • Market Share Analysis, 2024
        • By Product Type
        • By Application
        • By Function
        • By Form
    • Brazil
      • Pricing Analysis
      • Market Share Analysis, 2024
        • By Product Type
        • By Application
        • By Function
        • By Form
    • Chile
      • Pricing Analysis
      • Market Share Analysis, 2024
        • By Product Type
        • By Application
        • By Function
        • By Form
    • Germany
      • Pricing Analysis
      • Market Share Analysis, 2024
        • By Product Type
        • By Application
        • By Function
        • By Form
    • UK
      • Pricing Analysis
      • Market Share Analysis, 2024
        • By Product Type
        • By Application
        • By Function
        • By Form
    • Italy
      • Pricing Analysis
      • Market Share Analysis, 2024
        • By Product Type
        • By Application
        • By Function
        • By Form
    • Spain
      • Pricing Analysis
      • Market Share Analysis, 2024
        • By Product Type
        • By Application
        • By Function
        • By Form
    • France
      • Pricing Analysis
      • Market Share Analysis, 2024
        • By Product Type
        • By Application
        • By Function
        • By Form
    • India
      • Pricing Analysis
      • Market Share Analysis, 2024
        • By Product Type
        • By Application
        • By Function
        • By Form
    • ASEAN
      • Pricing Analysis
      • Market Share Analysis, 2024
        • By Product Type
        • By Application
        • By Function
        • By Form
    • Australia & New Zealand
      • Pricing Analysis
      • Market Share Analysis, 2024
        • By Product Type
        • By Application
        • By Function
        • By Form
    • China
      • Pricing Analysis
      • Market Share Analysis, 2024
        • By Product Type
        • By Application
        • By Function
        • By Form
    • Japan
      • Pricing Analysis
      • Market Share Analysis, 2024
        • By Product Type
        • By Application
        • By Function
        • By Form
    • South Korea
      • Pricing Analysis
      • Market Share Analysis, 2024
        • By Product Type
        • By Application
        • By Function
        • By Form
    • Russia
      • Pricing Analysis
      • Market Share Analysis, 2024
        • By Product Type
        • By Application
        • By Function
        • By Form
    • Poland
      • Pricing Analysis
      • Market Share Analysis, 2024
        • By Product Type
        • By Application
        • By Function
        • By Form
    • Hungary
      • Pricing Analysis
      • Market Share Analysis, 2024
        • By Product Type
        • By Application
        • By Function
        • By Form
    • Kingdom of Saudi Arabia
      • Pricing Analysis
      • Market Share Analysis, 2024
        • By Product Type
        • By Application
        • By Function
        • By Form
    • Turkiye
      • Pricing Analysis
      • Market Share Analysis, 2024
        • By Product Type
        • By Application
        • By Function
        • By Form
    • South Africa
      • Pricing Analysis
      • Market Share Analysis, 2024
        • By Product Type
        • By Application
        • By Function
        • By Form
  19. Market Structure Analysis
    • Competition Dashboard
    • Competition Benchmarking
    • Market Share Analysis of Top Players
      • By Regional
      • By Product Type
      • By Application
      • By Function
      • By Form
  20. Competition Analysis
    • Competition Deep Dive
      • AIDP, Inc.
        • Overview
        • Product Portfolio
        • Profitability by Market Segments (Product/Age /Sales Channel/Region)
        • Sales Footprint
        • Strategy Overview
          • Marketing Strategy
          • Product Strategy
          • Channel Strategy
      • BENEO GmbH
      • Kerry Group PLC
      • Shenzhen Beike Biotechnology Co. Ltd
      • Axiom Foods, Inc.
      • Golden Grain Group Limited
      • Ribus, Inc.
      • Ricebran Technologies, Inc.
      • The Green Labs LLC
      • Bioway (Xi’An) Organic Ingredients Co., Ltd
  21. Assumptions & Acronyms Used
  22. Research Methodology

List of Tables

  • Table 1: Global Market Value (USD Million) Forecast by Region, 2020 to 2035
  • Table 2: Global Market Value (USD Million) Forecast by Product Type , 2020 to 2035
  • Table 3: Global Market Value (USD Million) Forecast by Application, 2020 to 2035
  • Table 4: Global Market Value (USD Million) Forecast by Function, 2020 to 2035
  • Table 5: Global Market Value (USD Million) Forecast by Form, 2020 to 2035
  • Table 6: North America Market Value (USD Million) Forecast by Country, 2020 to 2035
  • Table 7: North America Market Value (USD Million) Forecast by Product Type , 2020 to 2035
  • Table 8: North America Market Value (USD Million) Forecast by Application, 2020 to 2035
  • Table 9: North America Market Value (USD Million) Forecast by Function, 2020 to 2035
  • Table 10: North America Market Value (USD Million) Forecast by Form, 2020 to 2035
  • Table 11: Latin America Market Value (USD Million) Forecast by Country, 2020 to 2035
  • Table 12: Latin America Market Value (USD Million) Forecast by Product Type , 2020 to 2035
  • Table 13: Latin America Market Value (USD Million) Forecast by Application, 2020 to 2035
  • Table 14: Latin America Market Value (USD Million) Forecast by Function, 2020 to 2035
  • Table 15: Latin America Market Value (USD Million) Forecast by Form, 2020 to 2035
  • Table 16: Western Europe Market Value (USD Million) Forecast by Country, 2020 to 2035
  • Table 17: Western Europe Market Value (USD Million) Forecast by Product Type , 2020 to 2035
  • Table 18: Western Europe Market Value (USD Million) Forecast by Application, 2020 to 2035
  • Table 19: Western Europe Market Value (USD Million) Forecast by Function, 2020 to 2035
  • Table 20: Western Europe Market Value (USD Million) Forecast by Form, 2020 to 2035
  • Table 21: Eastern Europe Market Value (USD Million) Forecast by Country, 2020 to 2035
  • Table 22: Eastern Europe Market Value (USD Million) Forecast by Product Type , 2020 to 2035
  • Table 23: Eastern Europe Market Value (USD Million) Forecast by Application, 2020 to 2035
  • Table 24: Eastern Europe Market Value (USD Million) Forecast by Function, 2020 to 2035
  • Table 25: Eastern Europe Market Value (USD Million) Forecast by Form, 2020 to 2035
  • Table 26: East Asia Market Value (USD Million) Forecast by Country, 2020 to 2035
  • Table 27: East Asia Market Value (USD Million) Forecast by Product Type , 2020 to 2035
  • Table 28: East Asia Market Value (USD Million) Forecast by Application, 2020 to 2035
  • Table 29: East Asia Market Value (USD Million) Forecast by Function, 2020 to 2035
  • Table 30: East Asia Market Value (USD Million) Forecast by Form, 2020 to 2035
  • Table 31: South Asia and Pacific Market Value (USD Million) Forecast by Country, 2020 to 2035
  • Table 32: South Asia and Pacific Market Value (USD Million) Forecast by Product Type , 2020 to 2035
  • Table 33: South Asia and Pacific Market Value (USD Million) Forecast by Application, 2020 to 2035
  • Table 34: South Asia and Pacific Market Value (USD Million) Forecast by Function, 2020 to 2035
  • Table 35: South Asia and Pacific Market Value (USD Million) Forecast by Form, 2020 to 2035
  • Table 36: Middle East & Africa Market Value (USD Million) Forecast by Country, 2020 to 2035
  • Table 37: Middle East & Africa Market Value (USD Million) Forecast by Product Type , 2020 to 2035
  • Table 38: Middle East & Africa Market Value (USD Million) Forecast by Application, 2020 to 2035
  • Table 39: Middle East & Africa Market Value (USD Million) Forecast by Function, 2020 to 2035
  • Table 40: Middle East & Africa Market Value (USD Million) Forecast by Form, 2020 to 2035

List of Figures

  • Figure 1: Global Market Pricing Analysis
  • Figure 2: Global Market Value (USD Million) Forecast 2020-2035
  • Figure 3: Global Market Value Share and BPS Analysis by Product Type , 2025 and 2035
  • Figure 4: Global Market Y-o-Y Growth Comparison by Product Type , 2025-2035
  • Figure 5: Global Market Attractiveness Analysis by Product Type
  • Figure 6: Global Market Value Share and BPS Analysis by Application, 2025 and 2035
  • Figure 7: Global Market Y-o-Y Growth Comparison by Application, 2025-2035
  • Figure 8: Global Market Attractiveness Analysis by Application
  • Figure 9: Global Market Value Share and BPS Analysis by Function, 2025 and 2035
  • Figure 10: Global Market Y-o-Y Growth Comparison by Function, 2025-2035
  • Figure 11: Global Market Attractiveness Analysis by Function
  • Figure 12: Global Market Value Share and BPS Analysis by Form, 2025 and 2035
  • Figure 13: Global Market Y-o-Y Growth Comparison by Form, 2025-2035
  • Figure 14: Global Market Attractiveness Analysis by Form
  • Figure 15: Global Market Value (USD Million) Share and BPS Analysis by Region, 2025 and 2035
  • Figure 16: Global Market Y-o-Y Growth Comparison by Region, 2025-2035
  • Figure 17: Global Market Attractiveness Analysis by Region
  • Figure 18: North America Market Incremental Dollar Opportunity, 2025-2035
  • Figure 19: Latin America Market Incremental Dollar Opportunity, 2025-2035
  • Figure 20: Western Europe Market Incremental Dollar Opportunity, 2025-2035
  • Figure 21: Eastern Europe Market Incremental Dollar Opportunity, 2025-2035
  • Figure 22: East Asia Market Incremental Dollar Opportunity, 2025-2035
  • Figure 23: South Asia and Pacific Market Incremental Dollar Opportunity, 2025-2035
  • Figure 24: Middle East & Africa Market Incremental Dollar Opportunity, 2025-2035
  • Figure 25: North America Market Value Share and BPS Analysis by Country, 2025 and 2035
  • Figure 26: North America Market Value Share and BPS Analysis by Product Type , 2025 and 2035
  • Figure 27: North America Market Y-o-Y Growth Comparison by Product Type , 2025-2035
  • Figure 28: North America Market Attractiveness Analysis by Product Type
  • Figure 29: North America Market Value Share and BPS Analysis by Application, 2025 and 2035
  • Figure 30: North America Market Y-o-Y Growth Comparison by Application, 2025-2035
  • Figure 31: North America Market Attractiveness Analysis by Application
  • Figure 32: North America Market Value Share and BPS Analysis by Function, 2025 and 2035
  • Figure 33: North America Market Y-o-Y Growth Comparison by Function, 2025-2035
  • Figure 34: North America Market Attractiveness Analysis by Function
  • Figure 35: North America Market Value Share and BPS Analysis by Form, 2025 and 2035
  • Figure 36: North America Market Y-o-Y Growth Comparison by Form, 2025-2035
  • Figure 37: North America Market Attractiveness Analysis by Form
  • Figure 38: Latin America Market Value Share and BPS Analysis by Country, 2025 and 2035
  • Figure 39: Latin America Market Value Share and BPS Analysis by Product Type , 2025 and 2035
  • Figure 40: Latin America Market Y-o-Y Growth Comparison by Product Type , 2025-2035
  • Figure 41: Latin America Market Attractiveness Analysis by Product Type
  • Figure 42: Latin America Market Value Share and BPS Analysis by Application, 2025 and 2035
  • Figure 43: Latin America Market Y-o-Y Growth Comparison by Application, 2025-2035
  • Figure 44: Latin America Market Attractiveness Analysis by Application
  • Figure 45: Latin America Market Value Share and BPS Analysis by Function, 2025 and 2035
  • Figure 46: Latin America Market Y-o-Y Growth Comparison by Function, 2025-2035
  • Figure 47: Latin America Market Attractiveness Analysis by Function
  • Figure 48: Latin America Market Value Share and BPS Analysis by Form, 2025 and 2035
  • Figure 49: Latin America Market Y-o-Y Growth Comparison by Form, 2025-2035
  • Figure 50: Latin America Market Attractiveness Analysis by Form
  • Figure 51: Western Europe Market Value Share and BPS Analysis by Country, 2025 and 2035
  • Figure 52: Western Europe Market Value Share and BPS Analysis by Product Type , 2025 and 2035
  • Figure 53: Western Europe Market Y-o-Y Growth Comparison by Product Type , 2025-2035
  • Figure 54: Western Europe Market Attractiveness Analysis by Product Type
  • Figure 55: Western Europe Market Value Share and BPS Analysis by Application, 2025 and 2035
  • Figure 56: Western Europe Market Y-o-Y Growth Comparison by Application, 2025-2035
  • Figure 57: Western Europe Market Attractiveness Analysis by Application
  • Figure 58: Western Europe Market Value Share and BPS Analysis by Function, 2025 and 2035
  • Figure 59: Western Europe Market Y-o-Y Growth Comparison by Function, 2025-2035
  • Figure 60: Western Europe Market Attractiveness Analysis by Function
  • Figure 61: Western Europe Market Value Share and BPS Analysis by Form, 2025 and 2035
  • Figure 62: Western Europe Market Y-o-Y Growth Comparison by Form, 2025-2035
  • Figure 63: Western Europe Market Attractiveness Analysis by Form
  • Figure 64: Eastern Europe Market Value Share and BPS Analysis by Country, 2025 and 2035
  • Figure 65: Eastern Europe Market Value Share and BPS Analysis by Product Type , 2025 and 2035
  • Figure 66: Eastern Europe Market Y-o-Y Growth Comparison by Product Type , 2025-2035
  • Figure 67: Eastern Europe Market Attractiveness Analysis by Product Type
  • Figure 68: Eastern Europe Market Value Share and BPS Analysis by Application, 2025 and 2035
  • Figure 69: Eastern Europe Market Y-o-Y Growth Comparison by Application, 2025-2035
  • Figure 70: Eastern Europe Market Attractiveness Analysis by Application
  • Figure 71: Eastern Europe Market Value Share and BPS Analysis by Function, 2025 and 2035
  • Figure 72: Eastern Europe Market Y-o-Y Growth Comparison by Function, 2025-2035
  • Figure 73: Eastern Europe Market Attractiveness Analysis by Function
  • Figure 74: Eastern Europe Market Value Share and BPS Analysis by Form, 2025 and 2035
  • Figure 75: Eastern Europe Market Y-o-Y Growth Comparison by Form, 2025-2035
  • Figure 76: Eastern Europe Market Attractiveness Analysis by Form
  • Figure 77: East Asia Market Value Share and BPS Analysis by Country, 2025 and 2035
  • Figure 78: East Asia Market Value Share and BPS Analysis by Product Type , 2025 and 2035
  • Figure 79: East Asia Market Y-o-Y Growth Comparison by Product Type , 2025-2035
  • Figure 80: East Asia Market Attractiveness Analysis by Product Type
  • Figure 81: East Asia Market Value Share and BPS Analysis by Application, 2025 and 2035
  • Figure 82: East Asia Market Y-o-Y Growth Comparison by Application, 2025-2035
  • Figure 83: East Asia Market Attractiveness Analysis by Application
  • Figure 84: East Asia Market Value Share and BPS Analysis by Function, 2025 and 2035
  • Figure 85: East Asia Market Y-o-Y Growth Comparison by Function, 2025-2035
  • Figure 86: East Asia Market Attractiveness Analysis by Function
  • Figure 87: East Asia Market Value Share and BPS Analysis by Form, 2025 and 2035
  • Figure 88: East Asia Market Y-o-Y Growth Comparison by Form, 2025-2035
  • Figure 89: East Asia Market Attractiveness Analysis by Form
  • Figure 90: South Asia and Pacific Market Value Share and BPS Analysis by Country, 2025 and 2035
  • Figure 91: South Asia and Pacific Market Value Share and BPS Analysis by Product Type , 2025 and 2035
  • Figure 92: South Asia and Pacific Market Y-o-Y Growth Comparison by Product Type , 2025-2035
  • Figure 93: South Asia and Pacific Market Attractiveness Analysis by Product Type
  • Figure 94: South Asia and Pacific Market Value Share and BPS Analysis by Application, 2025 and 2035
  • Figure 95: South Asia and Pacific Market Y-o-Y Growth Comparison by Application, 2025-2035
  • Figure 96: South Asia and Pacific Market Attractiveness Analysis by Application
  • Figure 97: South Asia and Pacific Market Value Share and BPS Analysis by Function, 2025 and 2035
  • Figure 98: South Asia and Pacific Market Y-o-Y Growth Comparison by Function, 2025-2035
  • Figure 99: South Asia and Pacific Market Attractiveness Analysis by Function
  • Figure 100: South Asia and Pacific Market Value Share and BPS Analysis by Form, 2025 and 2035
  • Figure 101: South Asia and Pacific Market Y-o-Y Growth Comparison by Form, 2025-2035
  • Figure 102: South Asia and Pacific Market Attractiveness Analysis by Form
  • Figure 103: Middle East & Africa Market Value Share and BPS Analysis by Country, 2025 and 2035
  • Figure 104: Middle East & Africa Market Value Share and BPS Analysis by Product Type , 2025 and 2035
  • Figure 105: Middle East & Africa Market Y-o-Y Growth Comparison by Product Type , 2025-2035
  • Figure 106: Middle East & Africa Market Attractiveness Analysis by Product Type
  • Figure 107: Middle East & Africa Market Value Share and BPS Analysis by Application, 2025 and 2035
  • Figure 108: Middle East & Africa Market Y-o-Y Growth Comparison by Application, 2025-2035
  • Figure 109: Middle East & Africa Market Attractiveness Analysis by Application
  • Figure 110: Middle East & Africa Market Value Share and BPS Analysis by Function, 2025 and 2035
  • Figure 111: Middle East & Africa Market Y-o-Y Growth Comparison by Function, 2025-2035
  • Figure 112: Middle East & Africa Market Attractiveness Analysis by Function
  • Figure 113: Middle East & Africa Market Value Share and BPS Analysis by Form, 2025 and 2035
  • Figure 114: Middle East & Africa Market Y-o-Y Growth Comparison by Form, 2025-2035
  • Figure 115: Middle East & Africa Market Attractiveness Analysis by Form
  • Figure 116: Global Market - Tier Structure Analysis
  • Figure 117: Global Market - Company Share Analysis
Dashboard
Dashboard
Dashboard
Dashboard
Dashboard
Dashboard

Full Research Suite comprises of:

Market outlook & trends analysis

Market outlook & trends analysis

Interviews & case studies

Interviews & case studies

Strategic recommendations

Strategic recommendations

Vendor profiles & capabilities analysis

Vendor profiles & capabilities analysis

5-year forecasts

5-year forecasts

8 regions and 60+ country-level data splits

8 regions and 60+ country-level data splits

Market segment data splits

Market segment data splits

12 months of continuous data updates

12 months of continuous data updates

DELIVERED AS:

PDF EXCEL ONLINE

Full Research Suite


$3500

$5000

$6500

Buy Report Now
Future Market Insights

Oryzenin Market

Chat With MaRIA

Chat With

MaRIA

Hi There, I am MaRIA, Your Market Research Intelligence Assistant. How may I help you?