Reports

- Global Locations -

Headquarters

Future Market Insights, Inc.

Christiana Corporate, 200
Continental Drive, Suite 401,
Newark, Delaware - 19713,
United States

T: +1-845-579-5705

Americas

Future Market Insights, Inc.

616 Corporate Way, Suite 2-9018,
Valley Cottage, NY 10989, United States

T: +1-347-918-3531

MEA

Future Market Insights

1602-6 Jumeirah Bay X2 Tower, Plot No: JLT-PH2-X2A,
Jumeirah Lakes Towers, Dubai,
United Arab Emirates

Europe

Future Market Insights

3rd Floor, 207 Regent Street,
W1B 3HH London
United Kingdom

T: + 44 (0) 20 8123 9659
D: +44 (0) 20 3287 4268

Asia Pacific

Future Market Insights

IndiaLand Global Tech Park, Unit UG-1, Behind Grand HighStreet, Phase 1, Hinjawadi, MH, Pune – 411057, India

Periodontal Market Size - Industry Outlook (2022 to 2032)

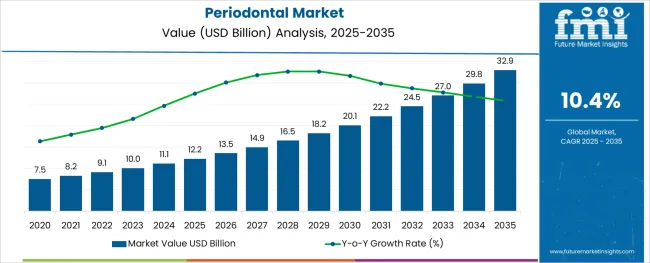
The global periodontal market size is expected to enjoy a valuation of US$ 9.1 billion in the year 2022, and further expand at a CAGR rate of 10.4% to reach a valuation of ~US$ 24.4 billion by the year 2032. According to a recent study by Future Market Insights, device type in the product segment is leading the market with a share of about 77.6% in the year 2021, within the global market.

Market Outlook:

Data Points Market Insights
Market Value 2022 US$ 9.1 billion
Market Value 2032 US$ 24.4 billion
CAGR 2022 to 2032 10.4%
Market Share of Top 5 Countries 55.4%
Key Market Players Dentsply Sirona, 3M Company, Danaher Corporation (Sybron Dental Specialties Inc./Kerr Corporation), Medtronic, Pfizer Inc., Novartis AG, ASA Dental S.p.A., Steris-Hu-Friedy, Carl Martin GmBH, Deppeler SA, AMD Lasers, Inc., Biolase, Inc., Straumann AG, Planmeca Oy, Karl Schumacher, GC Corporation, OraVu®, Micron Dental, and DENTAURUM GmbH & Co. KG

The growth of the periodontal market is very much inclined to the prevalence of periodontal diseases, which is constantly rising. Periodontal diseases or gum diseases are disorders that occur due to the infection and inflammation of mainly the gums and bone surrounding the teeth.

As per findings from the Centers for Disease Control and Prevention, 47.2% of people who are 30 years old and above, encounter some form of periodontal disease in the USA The prevalence of these diseases increases with natural aging. It has been estimated that 70.1% of the geriatric population who are 65 years and above are suffering from gum diseases in the USA

Since the prevalence of periodontal diseases is pretty high, therefore the adoption of the different devices used in the diagnosis, treatment, and surgery of periodontal diseases is quite high. Also, the recommendation of the drugs like antibiotics is rising in the same field. This is quite advantageous for the growth of the periodontal market.

Don't pay for what you don't need

Customize your report by selecting specific countries or regions and save 30%!

Sales Analysis of Periodontal Market from 2015 to 2021 Vs Market Outlook for 2022 to 2032

The market value of the periodontal market was approximately 24.2% of the overall ~US$ 34.2 billion of the global dental market in 2021.

The sale of the periodontal market expanded at a CAGR of 8.8% from 2015 to 2021. According to the WHO, age is the primary risk factor for the development of dental diseases and the risk for dental disorders increases with age, particularly for people aged >50 years. Hence, the rising geriatric population is one of the major drivers of the periodontal market.

As per the findings from WHO, the percentage of the population of people who are 60 years of age and above would nearly double in a time span of 35 years. It would increase from 12% to 22% between 2015 and 2050. This would positively impact the growth of the periodontal market.

Other than this, technological advancements can be considered a recognizable driver for this market. The shift from invasive techniques used for a root canal, crown troughing, implant recovery, gingivoplasty, and many more dental procedures towards advanced laser techniques such as diode lasers and CO2 lasers is also expected to contribute to the acceleration of the growth of this market, owing to the prevention of the oral infections. When it comes to periodontal disease diagnosis, 3D digital X-ray imaging is quite commonly used.

Thus, owing to the forenamed factors, the global periodontal market is expected to grow at a CAGR rate value of 10.4 % during the forecast period from 2022 to 2032.

Periodontal Market

What are the Key Opportunities for the Manufacturers Operating in Periodontal Market?

The market is set to have an assertive outlook, owing to the increased regulatory approvals for the products used in the periodontal market. Regulatory bodies like FDA regulate the approval of the medical devices being launched in the USA market.

Apart from this, drug approval is also governed by the FDA so that, it can be proved that the new drug is safe and effective for the patients. The introduction of novel products aligns with the entry of new and improved technology in the market, which ensures the enhancement and launch of new products in the market. This helps bring in new technology that eases treatment procedures and provides improved results to patients. This can be considered an opportunistic factor for the manufacturers operating within the periodontal market.

Sabyasachi Ghosh
Sabyasachi Ghosh

Principal Consultant

Talk to Analyst

Find your sweet spots for generating winning opportunities in this market.

What are the Factors Restraining Demand for Periodontal Market?

The cost linked with dental treatments and diagnostic procedures is quite high. The cost of treating periodontal disease can range from $1,700 to $8,000, depending on the severity level of the disease. These high costs along with the low reimbursement rate for dental procedures are the factors that can hamper the growth of the periodontal market.

Apart from this, the shortage of dental professionals in developing countries can be a major restraining factor for this market. As per a research article published by NCBI in 2021, a shortfall of dentists and specialists in South Africa is predicted till 2030. It was reported that in an ideal scenario, there would be a shortage of 853 dentists and specialists in 2018, 1655 in 2024, and 2267 in 2030.

The mentioned factors collectively propose an adverse effect on the developmental growth of the periodontal market.
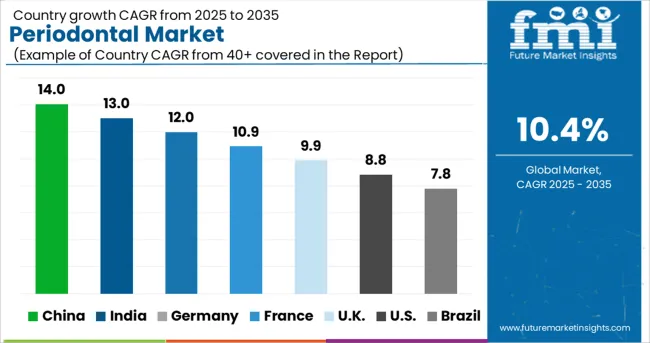
Country-wise Insights

What Makes the USA a Large Market for the Periodontal Treatment?

The USA dominates the North American region with a total market share of about 92.8% in 2021, and a similar trend is expected over the forecast period.

In the USA, October has been celebrated as National Dental Hygiene Month since 2009 as per the American Dental Hygienists’ Association. This has been initiated to increase awareness about oral heath so that, the general public can be aware of the risks that they can be prone to if they do not follow good oral habits. This would further increase the adoption of effective procedures for the treatment and diagnosis of periodontal diseases. Hence, the sales of periodontal treatment product including both drugs and devices in the USA is quite high and is anticipated to grow moving forward.

The presence of multiple manufacturers like Dentsply Sirona, AMD Lasers, Inc., BIOLASE, Inc., Karl Schumacher, and others is quite high in the USA market and this has boosted the availability of products in the USA periodontal market.

What Makes the United Kingdom a Highly Lucrative Market for Periodontal Treatment and Diagnosis?

United Kingdom is set to exhibit a CAGR growth rate of nearly 11.0% in the European periodontal market during the forecast period. In 2021, the United Kingdom held the highest market share of about 24.9% of 2021 the Europe periodontal market.

As per recent data from the Department of Health and Social Care, almost half of the adults in the United Kingdom get affected by irreversible periodontitis. This points to the high prevalence of periodontal diseases in the United Kingdom, hence, the periodontal market in the United Kingdom is quite lucrative.

What is the Outlook of India in the Periodontal Market?

India held approximately 45.2% market share in the South Asia periodontal market in 2021. It is projected to display growth at a lucrative CAGR rate of 11.1% during the forecast period.

The use of tobacco is very common in a country like India. As per a recent publication from the National Center for Biotechnology Information in 2021, the most significant risk factor for periodontal disease is tobacco smoking, since it worsens the condition and raises the risk of periodontal surgery. By inducing microvascular dysfunction, tobacco use harms the vasculature and is known to have a deleterious impact on periodontal health.

As per the Global Adult Tobacco Survey India, 2016 to 17, nearly 29% of all adults who are 15 years old and above are tobacco users. This data has been highlighted by the WHO as well. This scenario has contributed to the propelling growth of the periodontal market in India.

Get the data you need at a Fraction of the cost

Personalize your report by choosing insights you need
and save 40%!

Category-wise Insights

Which Periodontal Product Type is Driving Market Growth?

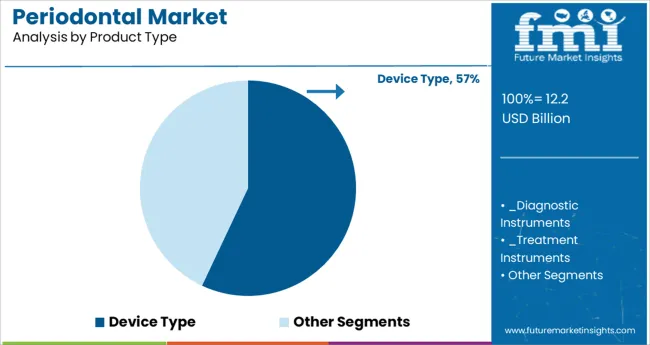
The device segment in the product category of the periodontal market is expected to present high growth at a CAGR rate of 11.3% by the end of the forecast period, with a projected market share of about 84.8% in the global market in 2032. Since the usage of either diagnostic, treatment or surgical instruments is more compared to the consumption of drugs in the periodontology field of dentistry, the device segment is significantly dominant in the product category.

Which Procedure in the Periodontal Market is Largely in Focus Globally?

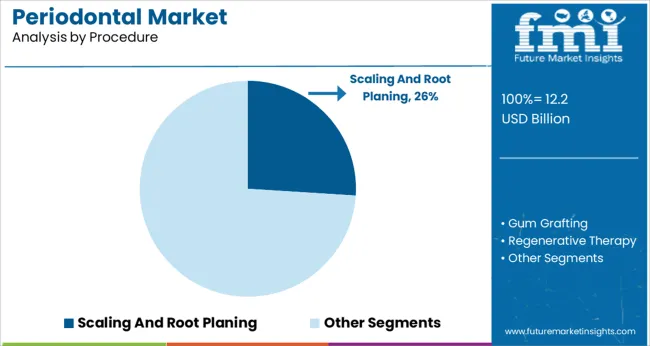
Scaling and root planning accounted for a revenue share of 36.1% in 2021 and are expected to display gradual growth over the forecast period. Scaling and root planing procedures are counted as non-surgical therapies for removing the infection above or below the gum line. Depending on the severity of the infection, the number of sessions is decided for scaling and root planning.

Which End User is preferred most for the Sales within Periodontal Market Globally?

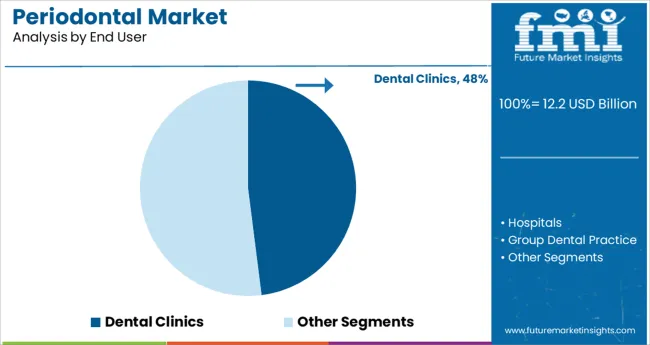
Dental Clinics held the highest market share of 57.4% during the year 2021. The increasing number of clinics specific to the field of dentistry is a major factor due to which dental clinics have been estimated to account for more than half of the share of the end-user segment in the forecast period as well.
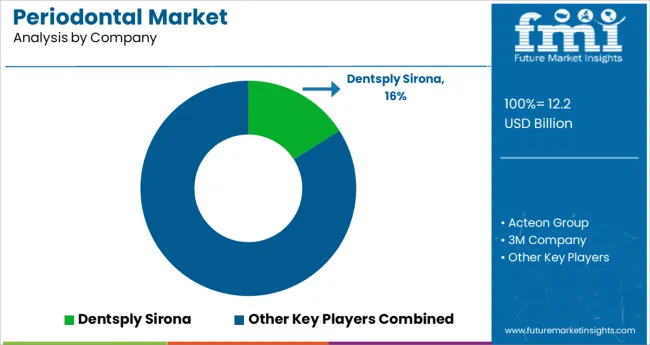
Competitive Landscape

To strengthen their presence around the globe and improve their business strategies, the key players are involved in various product launches, expansions, collaborations, and mergers and acquisitions. These are the top key promotional strategies adopted by the key players in the periodontal market.

  • For instance, in February 2020, AMD Lasers announced the development of the Monet™ laser curing light, the first handheld laser in curing light for dental materials.
  • For instance, in 2019, OraVu®, which is a dental technology company dealing in dental endoscopy solutions, launched a complete micro-endoscope system called DeVA-1® Dental Vision Assistant. It enables dentists and various dental specialists to have a deep vision of the gingival pocket, eliminating the risk of flap surgery. It is quite helpful in improving visibility in hard-to-access areas for dentists and other specialists.

Report Scope as per Periodontal Industry Analysis

Attribute Details
Forecast Period 2022 to 2032
Historical Data Available for 2015 to 2021
Market Analysis US$ million for Value
Key Regions Covered North America, Latin America, Europe, South Asia, East Asia, Oceania, and Middle East & Africa
Key Countries Covered The USA, Canada, Brazil, Mexico, Argentina, The United Kingdom, Germany, Italy, France, Spain, Russia, BENELUX, Nordic Countries, India, Malaysia, Thailand, Indonesia, China, Japan, South Korea, Australia, New Zealand, Turkey, GCC, and South Africa
Key Market Segments Covered Product, Procedures, End User, and Region
Key Companies Profiled
  • Dentsply Sirona
  • 3M Company
  • Danaher Corporation (Sybron Dental Specialties Inc./Kerr Corporation)
  • Medtronic
  • Pfizer Inc.
  • Novartis AG
  • ASA Dental S.p.A.
  • Steris-Hu-Friedy
  • Carl Martin GmBH
  • Deppeler SA
  • AMD Lasers, Inc.
  • Biolase, Inc.
  • Straumann AG
  • Planmeca Oy
  • Karl Schumacher
  • GC Corporation
  • OraVu®
  • Micron Dental
  • DENTAURUM GmbH & Co. KG

Key Market Segments Covered in Periodontal Industry Research

By Product:

  • Device Type
    • Diagnostic Instruments
      • Probes
        • Single Sided Probes
        • Double Sided Probes
      • Mouth Mirrors
      • Explorers
    • Treatment Instruments
      • Scalers & Curettes
      • Custom-Fit Trays
      • Cleansing & Polishing Instruments
      • Periodontal Endoscopes
      • Dental Lasers
      • Dental Implants
        • Endosteal Implants
        • Subperiosteal Implants
    • Surgical Instruments
  • Drug Type
    • Systemic Antibiotics
    • Local Antibiotics

By Procedures:

  • Scaling And Root Planing
  • Gum Grafting
  • Regenerative Therapy
  • Dental Crown Lengthening
  • Periodontal Pocket Procedures
  • Single Tooth Dental Implants
  • Multiple Tooth Dental Implants

By End User:

  • Hospitals
  • Dental Clinics
  • Group Dental Practice
  • Ambulatory Surgical Centers

By Region:

  • North America
  • Latin America
  • Europe
  • South Asia
  • East Asia
  • Oceania
  • Middle East and Africa (MEA)

Frequently Asked Questions

How much is the periodontal market estimated to be worth in 2022?

The global periodontal market is estimated to be worth US$ 9.1 billion in 2022.

What is the sales forecast for the periodontal market through 2032?

The periodontal market is expected to reach US$ 24.4 billion by end of 2032 at a CAGR of 10.4%.

What are the trends driving the demand outlook of the global periodontal market?

Growing awareness regarding oral hygiene, rising medical and dental tourism and consideration of non-surgical periodontal therapy are some of the key trends in this market.

Which region has the highest market share in the global periodontal market?

North America dominated the global periodontal market accounting for the highest market share of 34.4% in 2021

What is the outlook of United Kingdom’s periodontal market?

United Kingdom displays a market share of around 24.9% in 2021 in the Europe periodontal market and is set to present a lucrative CAGR growth rate of 11.0% during the forecasted years.

How likely is the periodontal market to grow in India?

India accounts for about 45.2% of the market share of the South Asian periodontal market in 2021 and is projected to grow with a CAGR of 11.1% in the forecast period.

Which are the top five countries driving demand for the periodontal market?

USA., United Kingdom, Germany, India and China are the top five countries, which are expected to drive demand in the periodontal market.

What was the last 6 years’ CAGR value growth for the periodontal market?

From 2015 to 2021, the market for periodontal expanded at the rate of 8.8%.

What are the key market statistics for China in the periodontal market?

China accounted for over 43% market share of the East Asia periodontal market in 2021. The periodontal market in China is expected to grow at 10.4% CAGR value during the forecast period.

What is the outlook of Germany in the periodontal market?

Germany held a market share of nearly 22% of the Europe periodontal market in 2021 and is set to present a lucrative CAGR growth rate of 10.3% during the forecast period.

Table of Content

1. Executive Summary | Periodontal Market 

    1.1. Global Market Outlook

    1.2. Demand Side Trends

    1.3. Supply-Side Trends

    1.4. Analysis and Recommendations

2. Market Overview

    2.1. Market Coverage / Taxonomy

    2.2. Market Definition / Scope / Limitations

    2.3. Inclusions and Exclusions

3. Key Market Trends

    3.1. Key Trends Impacting the Market

    3.2. Product Innovation / Development Trends

4. Key Success Factors

    4.1. Product Adoption / Usage Analysis

    4.2. Product USP Analysis

    4.3. Key Strategies Adopted by Manufacturers

    4.4. Value Chain Analysis

    4.5. PESTLE Analysis

    4.6. Porter’s Analysis

    4.7. Regulatory Scenario

    4.8. Pipeline Assessment

5. Global Market Demand in Volume (Units) Analysis 2015 to 2021 and Forecast, 2022 to 2032

    5.1. Historical Market Volume (Units) Analysis, 2015 to 2021

    5.2. Current and Future Market Volume (Units) Projections, 2022 to 2032

        5.2.1. Y-o-Y Growth Trend Analysis

6. Global Market - Pricing Analysis

    6.1. Regional Pricing Analysis, By Product

    6.2. Global Average Pricing Analysis Benchmark

7. Global Market Demand (in Value or Size in US$ million) Analysis 2015 to 2021 and Forecast, 2022 to 2032

    7.1. Historical Market Value (US$ million) Analysis, 2015 to 2021

    7.2. Current and Future Market Value (US$ million) Projections, 2022 to 2032

        7.2.1. Y-o-Y Growth Trend Analysis

        7.2.2. Absolute $ Opportunity Analysis

8. Market Background

    8.1. Macro-Economic Factors

        8.1.1. Global GDP Growth Outlook

        8.1.2. Global Healthcare Industry Market Outlook

    8.2. Forecast Factors - Relevance & Impact

        8.2.1. Rising demand for Dental Care

        8.2.2. Prevalence of Oral Diseases

        8.2.3. Growing Investment in Healthcare Expenditures

        8.2.4. Advancement and development in Technology

        8.2.5. Cost of the products

        8.2.6. Increased Pipeline products

        8.2.7. Increasing Adoption of Automated Equipment

    8.3. Market Dynamics

        8.3.1. Drivers

        8.3.2. Restraints

        8.3.3. Opportunity Analysis

9. COVID-19 Crisis - Impact Assessment

    9.1. Current COVID-19 Statistics and Probable Future Impact

    9.2. Current GDP Projection and Probable Impact

    9.3. COVID-19 and Impact Analysis

    9.4. 2021 Market Scenario

        9.4.1. By Product

        9.4.2. By Procedures

        9.4.3. By End User

        9.4.4. By Region

10. Global Market Analysis 2015 to 2021 and Forecast 2022 to 2032, By Product

    10.1. Introduction / Key Findings

    10.2. Historical Market Size (US$ million) and Volume (Units) Analysis, By Product, 2015 to 2021

    10.3. Current and Future Market Size (US$ million) and Volume (Units) Analysis and Forecast by Product, 2022 to 2032

        10.3.1. Devices Type

            10.3.1.1. Diagnostic Instruments

                10.3.1.1.1. Probes

                    10.3.1.1.1.1. Single-Sided Probes

                    10.3.1.1.1.2. Double-Sided Probes

                10.3.1.1.2. Mouth Mirrors

                10.3.1.1.3. Explorers

            10.3.1.2. Treatment Instruments

                10.3.1.2.1. Scalers And curettes

                10.3.1.2.2. Custom-Fit Trays

                10.3.1.2.3. Cleansing and Polishing Instruments

                10.3.1.2.4. Endoscopes

                10.3.1.2.5. Dental Lasers

                10.3.1.2.6. Dental Implants

                    10.3.1.2.6.1. Endosteal Implants

                    10.3.1.2.6.2. Subperiosteal Implants

            10.3.1.3. Surgical Instruments

        10.3.2. Drugs Type

            10.3.2.1. Systemic Antibiotics

            10.3.2.2. Local Antibiotics

    10.4. Market Attractiveness Analysis, By Product

11. Global Market Analysis 2015 to 2021 and Forecast 2022 to 2032, By Procedures

    11.1. Introduction / Key Findings

    11.2. Historical Market Size (US$ million) Analysis, By Procedures, 2015 to 2021

    11.3. Current and Future Market Size (US$ million) Analysis and Forecast by Procedures, 2022 to 2032

        11.3.1. Scaling And Root Planing

        11.3.2. Gum Grafting

        11.3.3. Regenerative Therapy

        11.3.4. Dental Crown Lengthening

        11.3.5. Pocket Procedures

        11.3.6. Single Tooth Dental Implants

        11.3.7. Multiple Tooth Dental Implants

    11.4. Market Attractiveness Analysis, By Procedures

12. Global Market Analysis 2015 to 2021 and Forecast 2022 to 2032, By End User

    12.1. Introduction / Key Findings

    12.2. Historical Market Size (US$ million) and Volume (Units), By End User, 2015 to 2021

    12.3. Current and Future Market Size (US$ million) Forecast by End User, 2022 to 2032

        12.3.1. Hospitals

        12.3.2. Dental Clinics

        12.3.3. Group Dental Practice

        12.3.4. Ambulatory Surgical Centers

    12.4. Market Attractiveness Analysis, By End User

13. Global Market Analysis 2015 to 2021 and Forecast 2022 to 2032, by Region

    13.1. Introduction

    13.2. Historical Market Size (US$ million) and Volume (Units) Analysis, By Region, 2015 to 2021

    13.3. Current and Future Market Size (US$ million) and Volume (Units) Analysis and Forecast by Region, 2022 to 2032

        13.3.1. North America

        13.3.2. Latin America

        13.3.3. Europe

        13.3.4. East Asia

        13.3.5. South Asia

        13.3.6. Oceania

        13.3.7. Middle East and Africa (MEA)

    13.4. Market Attractiveness Analysis, By Region

14. North America Market Analysis 2015 to 2021 and Forecast 2022 to 2032

    14.1. Introduction

    14.2. Historical Market Size (US$ million) and Volume (Units) Trend Analysis, By Market Taxonomy, 2015 to 2021

    14.3. Current and Future Market Size (US$ million) and Volume (Units) Analysis and Forecast by Market Taxonomy, 2022 to 2032

        14.3.1. By Country

            14.3.1.1. The USA

            14.3.1.2. Canada

        14.3.2. By Product

        14.3.3. By Procedures

        14.3.4. By End User

    14.4. Market Attractiveness Analysis

        14.4.1. By Country

        14.4.2. By Product

        14.4.3. By Procedures

        14.4.4. By End User

    14.5. Drivers and Restraints - Impact Analysis

    14.6. Country-Level Analysis & Forecast

        14.6.1. The USA Market Analysis

            14.6.1.1. Introduction

            14.6.1.2. Market Analysis and Forecast by Market Taxonomy

                14.6.1.2.1. By Product

                14.6.1.2.2. By Procedures

                14.6.1.2.3. By End User

        14.6.2. Canada Market Analysis

            14.6.2.1. Introduction

            14.6.2.2. Market Analysis and Forecast by Market Taxonomy

                14.6.2.2.1. By Product

                14.6.2.2.2. By Procedures

                14.6.2.2.3. By End User

15. Latin America Market Analysis 2015 to 2021 and Forecast 2022 to 2032

    15.1. Introduction

    15.2. Historical Market Size (US$ million) and Volume (Units) Trend Analysis, By Market Taxonomy, 2015 to 2021

    15.3. Current and Future Market Size (US$ million) and Volume (Units) Analysis and Forecast by Market Taxonomy, 2022 to 2032

        15.3.1. By Country

            15.3.1.1. Mexico

            15.3.1.2. Brazil

            15.3.1.3. Argentina

            15.3.1.4. Rest of Latin America

        15.3.2. By Product

        15.3.3. By Procedures

        15.3.4. By End User

    15.4. Market Attractiveness Analysis

        15.4.1. By Country

        15.4.2. By Product

        15.4.3. By Procedures

        15.4.4. By End User

    15.5. Drivers and Restraints - Impact Analysis

    15.6. Country Level Analysis & Forecast

        15.6.1. Mexico Market Analysis

            15.6.1.1. Introduction

            15.6.1.2. Market Analysis and Forecast by Market Taxonomy

                15.6.1.2.1. By Product

                15.6.1.2.2. By Procedures

                15.6.1.2.3. By End User

        15.6.2. Brazil Market Analysis

            15.6.2.1. Introduction

            15.6.2.2. Market Analysis and Forecast by Market Taxonomy

                15.6.2.2.1. By Product

                15.6.2.2.2. By Procedures

                15.6.2.2.3. By End User

        15.6.3. Argentina Market Analysis

            15.6.3.1. Introduction

            15.6.3.2. Market Analysis and Forecast by Market Taxonomy

                15.6.3.2.1. By Product

                15.6.3.2.2. By Procedures

                15.6.3.2.3. By End User

16. Europe Market Analysis 2015 to 2021 and Forecast 2022 to 2032

    16.1. Introduction

    16.2. Historical Market Size (US$ million) and Volume (Units) Trend Analysis, By Market Taxonomy, 2015 to 2021

    16.3. Current and Future Market Size (US$ million) and Volume (Units) Analysis and Forecast by Market Taxonomy, 2022 to 2032

        16.3.1. By Country

            16.3.1.1. Germany

            16.3.1.2. Italy

            16.3.1.3. France

            16.3.1.4. The United Kingdom

            16.3.1.5. Spain

            16.3.1.6. Russia

            16.3.1.7. BENELUX

            16.3.1.8. Nordic Countries

            16.3.1.9. Rest of Europe

        16.3.2. By Product

        16.3.3. By Procedures

        16.3.4. By End User

    16.4. Market Attractiveness Analysis

        16.4.1. By Country

        16.4.2. By Product

        16.4.3. By Procedures

        16.4.4. By End User

    16.5. Drivers and Restraints - Impact Analysis

    16.6. Country-Level Analysis & Forecast

        16.6.1. Germany Market Analysis

            16.6.1.1. Introduction

            16.6.1.2. Market Analysis and Forecast by Market Taxonomy

                16.6.1.2.1. By Product

                16.6.1.2.2. By Procedures

                16.6.1.2.3. By End User

        16.6.2. Italy Market Analysis

            16.6.2.1. Introduction

            16.6.2.2. Market Analysis and Forecast by Market Taxonomy

                16.6.2.2.1. By Product

                16.6.2.2.2. By Procedures

                16.6.2.2.3. By End User

        16.6.3. France Market Analysis

            16.6.3.1. Introduction

            16.6.3.2. Market Analysis and Forecast by Market Taxonomy

                16.6.3.2.1. By Product

                16.6.3.2.2. By Procedures

                16.6.3.2.3. By End User

        16.6.4. The United Kingdom Market Analysis

            16.6.4.1. Introduction

            16.6.4.2. Market Analysis and Forecast by Market Taxonomy

                16.6.4.2.1. By Product

                16.6.4.2.2. By Procedures

                16.6.4.2.3. By End User

        16.6.5. Spain Market Analysis

            16.6.5.1. Introduction

            16.6.5.2. Market Analysis and Forecast by Market Taxonomy

                16.6.5.2.1. By Product

                16.6.5.2.2. By Procedures

                16.6.5.2.3. By End User

        16.6.6. Russia Market Analysis

            16.6.6.1. Introduction

            16.6.6.2. Market Analysis and Forecast by Market Taxonomy

                16.6.6.2.1. By Product

                16.6.6.2.2. By Procedures

                16.6.6.2.3. By End User

        16.6.7. BENELUX Market Analysis

            16.6.7.1. Introduction

            16.6.7.2. Market Analysis and Forecast by Market Taxonomy

                16.6.7.2.1. By Product

                16.6.7.2.2. By Procedures

                16.6.7.2.3. By End User

        16.6.8. Nordic Countries Market Analysis

            16.6.8.1. Introduction

            16.6.8.2. Market Analysis and Forecast by Market Taxonomy

                16.6.8.2.1. By Product

                16.6.8.2.2. By Procedures

                16.6.8.2.3. By End User

17. East Asia Market Analysis 2015 to 2021 and Forecast 2022 to 2032

    17.1. Introduction

    17.2. Historical Market Size (US$ million) and Volume (Units) Trend Analysis, By Market Taxonomy, 2015 to 2021

    17.3. Current and Future Market Size (US$ million) and Volume (Units) Analysis and Forecast by Market Taxonomy, 2022 to 2032

        17.3.1. By Country

            17.3.1.1. China

            17.3.1.2. Japan

            17.3.1.3. South Korea

        17.3.2. By Product

        17.3.3. By End User

    17.4. Market Attractiveness Analysis

        17.4.1. By Country

        17.4.2. By Product

        17.4.3. By Procedures

        17.4.4. By End User

    17.5. Drivers and Restraints - Impact Analysis

    17.6. Country Level Analysis & Forecast

        17.6.1. China Market Analysis

            17.6.1.1. Introduction

            17.6.1.2. Market Analysis and Forecast by Market Taxonomy

                17.6.1.2.1. By Product

                17.6.1.2.2. By Procedures

                17.6.1.2.3. By End User

        17.6.2. Japan Market Analysis

            17.6.2.1. Introduction

            17.6.2.2. Market Analysis and Forecast by Market Taxonomy

                17.6.2.2.1. By Product

                17.6.2.2.2. By Procedures

                17.6.2.2.3. By End User

        17.6.3. South Korea Market Analysis

            17.6.3.1. Introduction

            17.6.3.2. Market Analysis and Forecast by Market Taxonomy

                17.6.3.2.1. By Product

                17.6.3.2.2. By Procedures

                17.6.3.2.3. By End User

18. South Asia Market Analysis 2015 to 2021 and Forecast 2022 to 2032

    18.1. Introduction

    18.2. Historical Market Size (US$ million) and Volume (Units) Trend Analysis, By Market Taxonomy, 2015 to 2021

    18.3. Current and Future Market Size (US$ million) and Volume (Units) Analysis and Forecast by Market Taxonomy, 2022 to 2032

        18.3.1. By Country

            18.3.1.1. India

            18.3.1.2. Indonesia

            18.3.1.3. Malaysia

            18.3.1.4. Thailand

            18.3.1.5. Rest of South Asia

        18.3.2. By Product

        18.3.3. By Procedures

        18.3.4. By End User

    18.4. Market Attractiveness Analysis

        18.4.1. By Country

        18.4.2. By Product

        18.4.3. By Procedures

        18.4.4. By End User

    18.5. Drivers and Restraints - Impact Analysis

    18.6. Country Level Analysis & Forecast

        18.6.1. India Market Analysis

            18.6.1.1. Introduction

            18.6.1.2. Market Analysis and Forecast by Market Taxonomy

                18.6.1.2.1. By Product

                18.6.1.2.2. By Procedures

                18.6.1.2.3. By End User

        18.6.2. Indonesia Market Analysis

            18.6.2.1. Introduction

            18.6.2.2. Market Analysis and Forecast by Market Taxonomy

                18.6.2.2.1. By Product

                18.6.2.2.2. By Procedures

                18.6.2.2.3. By End User

        18.6.3. Malaysia Market Analysis

            18.6.3.1. Introduction

            18.6.3.2. Market Analysis and Forecast by Market Taxonomy

                18.6.3.2.1. By Product

                18.6.3.2.2. By Procedures

                18.6.3.2.3. By End User

        18.6.4. Thailand Market Analysis

            18.6.4.1. Introduction

            18.6.4.2. Market Analysis and Forecast by Market Taxonomy

                18.6.4.2.1. By Product

                18.6.4.2.2. By Procedures

                18.6.4.2.3. By End User

19. Oceania Market 2015-2021 and Forecast 2022-2032

    19.1. Introduction

    19.2. Historical Market Size (US$ million) and Volume (Units) Trend Analysis, By Market Taxonomy, 2015 to 2021

    19.3. Current and Future Market Size (US$ million) and Volume (Units) Analysis and Forecast by Market Taxonomy, 2022 to 2032

        19.3.1. By Country

            19.3.1.1. Australia

            19.3.1.2. New Zealand

        19.3.2. By Product

        19.3.3. By Procedures

        19.3.4. By End User

    19.4. Market Attractiveness Analysis

        19.4.1. By Country

        19.4.2. By Product

        19.4.3. By Procedures

        19.4.4. By End User

    19.5. Drivers and Restraints - Impact Analysis

    19.6. Country Level Analysis & Forecast

        19.6.1. Australia Market Analysis

            19.6.1.1. Introduction

            19.6.1.2. Market Analysis and Forecast by Market Taxonomy

                19.6.1.2.1. By Product

                19.6.1.2.2. By Procedures

                19.6.1.2.3. By End User

        19.6.2. New Zealand Market Analysis

            19.6.2.1. Introduction

            19.6.2.2. Market Analysis and Forecast by Market Taxonomy

                19.6.2.2.1. By Product

                19.6.2.2.2. By Procedures

                19.6.2.2.3. By End User

20. Middle East and Africa (MEA) Market Analysis 2015 to 2021 and Forecast 2022 to 2032

    20.1. Introduction

    20.2. Historical Market Size (US$ million) and Volume (Units) Trend Analysis, By Market Taxonomy, 2015 to 2021

    20.3. Current and Future Market Size (US$ million) and Volume (Units) Analysis and Forecast by Market Taxonomy, 2022 to 2032

        20.3.1. By Country

            20.3.1.1. GCC Countries

            20.3.1.2. Turkey

            20.3.1.3. South Africa

            20.3.1.4. Rest of Middle East and Africa

        20.3.2. By Product

        20.3.3. By Procedures

        20.3.4. By End User

    20.4. Market Attractiveness Analysis

        20.4.1. By Country

        20.4.2. By Product

        20.4.3. By Procedures

        20.4.4. By End User

    20.5. Drivers and Restraints - Impact Analysis

    20.6. Country-Level Analysis & Forecast

        20.6.1. GCC Countries Market Analysis

            20.6.1.1. Introduction

            20.6.1.2. Market Analysis and Forecast by Market Taxonomy

                20.6.1.2.1. By Product

                20.6.1.2.2. By Procedures

                20.6.1.2.3. By End User

        20.6.2. Turkey Market Analysis

            20.6.2.1. Introduction

            20.6.2.2. Market Analysis and Forecast by Market Taxonomy

                20.6.2.2.1. By Product

                20.6.2.2.2. By Procedures

                20.6.2.2.3. By End User

        20.6.3. South Africa Market Analysis

            20.6.3.1. Introduction

            20.6.3.2. Market Analysis and Forecast by Market Taxonomy

                20.6.3.2.1. By Product

                20.6.3.2.2. By Procedures

                20.6.3.2.3. By End User

21. Market Structure Analysis

    21.1. Market Analysis, By Tier of Companies

    21.2. Market Share Analysis of Top Players

    21.3. Market Presence Analysis

22. Competition Analysis

    22.1. Competition Dashboard

    22.2. Competition Benchmarking

    22.3. Competition Deep Dive

        22.3.1. Acteon Group

            22.3.1.1. Overview

            22.3.1.2. Product Portfolio

            22.3.1.3. Key Financials

            22.3.1.4. Sales Footprint

            22.3.1.5. Strategy Overview

            22.3.1.6. Key Developments

        22.3.2. Dentsply Sirona

            22.3.2.1. Overview

            22.3.2.2. Product Portfolio

            22.3.2.3. Key Financials

            22.3.2.4. Sales Footprint

            22.3.2.5. Strategy Overview

            22.3.2.6. Key Developments

        22.3.3. 3M Company

            22.3.3.1. Overview

            22.3.3.2. Product Portfolio

            22.3.3.3. Key Financials

            22.3.3.4. Sales Footprint

            22.3.3.5. Strategy Overview

            22.3.3.6. Key Developments

        22.3.4. Danaher Corporation (Sybron Dental Specialties Inc./Kerr Corporation)

            22.3.4.1. Overview

            22.3.4.2. Product Portfolio

            22.3.4.3. Key Financials

            22.3.4.4. Sales Footprint

            22.3.4.5. Strategy Overview

            22.3.4.6. Key Developments

        22.3.5. Medtronic

            22.3.5.1. Overview

            22.3.5.2. Product Portfolio

            22.3.5.3. Key Financials

            22.3.5.4. Sales Footprint

            22.3.5.5. Strategy Overview

            22.3.5.6. Key Developments

        22.3.6. Pfizer Inc.

            22.3.6.1. Overview

            22.3.6.2. Product Portfolio

            22.3.6.3. Key Financials

            22.3.6.4. Sales Footprint

            22.3.6.5. Strategy Overview

            22.3.6.6. Key Developments

        22.3.7. Novartis AG

            22.3.7.1. Overview

            22.3.7.2. Product Portfolio

            22.3.7.3. Key Financials

            22.3.7.4. Sales Footprint

            22.3.7.5. Strategy Overview

            22.3.7.6. Key Developments

        22.3.8. ASA Dental S.p.A.

            22.3.8.1. Overview

            22.3.8.2. Product Portfolio

            22.3.8.3. Key Financials

            22.3.8.4. Sales Footprint

            22.3.8.5. Strategy Overview

            22.3.8.6. Key Developments

        22.3.9. Steris-Hu-Friedy

            22.3.9.1. Overview

            22.3.9.2. Product Portfolio

            22.3.9.3. Key Financials

            22.3.9.4. Sales Footprint

            22.3.9.5. Strategy Overview

            22.3.9.6. Key Developments

        22.3.10. Carl MartinGmBH

            22.3.10.1. Overview

            22.3.10.2. Product Portfolio

            22.3.10.3. Key Financials

            22.3.10.4. Sales Footprint

            22.3.10.5. Strategy Overview

            22.3.10.6. Key Developments

        22.3.11. Deppeler SA

            22.3.11.1. Overview

            22.3.11.2. Product Portfolio

            22.3.11.3. Key Financials

            22.3.11.4. Sales Footprint

            22.3.11.5. Strategy Overview

            22.3.11.6. Key Developments

        22.3.12. AMD Lasers, Inc.

            22.3.12.1. Overview

            22.3.12.2. Product Portfolio

            22.3.12.3. Key Financials

            22.3.12.4. Sales Footprint

            22.3.12.5. Strategy Overview

            22.3.12.6. Key Developments

        22.3.13. Biolase, Inc.

            22.3.13.1. Overview

            22.3.13.2. Product Portfolio

            22.3.13.3. Key Financials

            22.3.13.4. Sales Footprint

            22.3.13.5. Strategy Overview

            22.3.13.6. Key Developments

        22.3.14. Straumann AG

            22.3.14.1. Overview

            22.3.14.2. Product Portfolio

            22.3.14.3. Key Financials

            22.3.14.4. Sales Footprint

            22.3.14.5. Strategy Overview

            22.3.14.6. Key Developments

        22.3.15. Planmeca Oy

            22.3.15.1. Overview

            22.3.15.2. Product Portfolio

            22.3.15.3. Key Financials

            22.3.15.4. Sales Footprint

            22.3.15.5. Strategy Overview

            22.3.15.6. Key Developments

        22.3.16. Karl Schumacher

            22.3.16.1. Overview

            22.3.16.2. Product Portfolio

            22.3.16.3. Key Financials

            22.3.16.4. Sales Footprint

            22.3.16.5. Strategy Overview

            22.3.16.6. Key Developments

        22.3.17. GC Corporation

            22.3.17.1. Overview

            22.3.17.2. Product Portfolio

            22.3.17.3. Key Financials

            22.3.17.4. Sales Footprint

            22.3.17.5. Strategy Overview

            22.3.17.6. Key Developments

        22.3.18. OraVu®

            22.3.18.1. Overview

            22.3.18.2. Product Portfolio

            22.3.18.3. Key Financials

            22.3.18.4. Sales Footprint

            22.3.18.5. Strategy Overview

            22.3.18.6. Key Developments

        22.3.19. Micron Dental

            22.3.19.1. Overview

            22.3.19.2. Product Portfolio

            22.3.19.3. Key Financials

            22.3.19.4. Sales Footprint

            22.3.19.5. Strategy Overview

            22.3.19.6. Key Developments

        22.3.20. DENTAURUM GmbH & Co. KG

            22.3.20.1. Overview

            22.3.20.2. Product Portfolio

            22.3.20.3. Key Financials

            22.3.20.4. Sales Footprint

            22.3.20.5. Strategy Overview

            22.3.20.6. Key Developments

23. Assumptions and Acronyms Used

24. Research Methodology

Don't pay for what you don't need

Customize your report by selecting specific countries or regions and save 30%!

List of Tables

Table 01: Global Market Value (US$ million) Analysis 2015 to 2021, By Product

Table 02: Global Market Value (US$ million) Analysis 2022 to 2032, By Product

Table 03: Global Market Volume (Units) Analysis 2015 to 2021, By Product

Table 04: Global Market Volume (Units) Analysis 2015 to 2021, By Product

Table 05: Global Market Value (US$ million) Analysis 2015 to 2021, By Procedures

Table 06: Global Market Value (US$ million) Analysis 2022 to 2032, By Procedures

Table 07: Global Market Value (US$ million) Analysis 2015 to 2021, By End User

Table 08: Global Market Value (US$ million) Analysis 2022 to 2032, By End User

Table 09: Global Market Value (US$ million) Analysis 2015 to 2021, By Region

Table 10: Global Market Value (US$ million) Analysis 2022 to 2032, By Region

Table 11: North America Market Value (US$ million) Analysis 2015 to 2021, By Country

Table 12: North America Market Value (US$ million) Analysis 2022 to 2032, By Country

Table 13: North America Market Value (US$ million) Analysis 2015 to 2021, By Product

Table 14: North America Market Value (US$ million) Analysis 2022 to 2032, By Product

Table 15: North America Market Volume (Units) Analysis 2015 to 2021, By Product

Table 16: North America Market Volume (Units) Analysis 2022 to 2032, By Product

Table 17: North America Market Value (US$ million) Analysis 2015 to 2021, By Procedures

Table 18: North America Market Value (US$ million) Analysis 2022 to 2032, By Procedures

Table 19: North America Market Value (US$ million) Analysis 2015 to 2021, By End User

Table 20: North America Market Value (US$ million) Analysis 2022 to 2032, By End User

Table 21: Latin America Market Value (US$ million) Analysis 2015 to 2021, By Country

Table 22: Latin America Market Value (US$ million) Analysis 2022 to 2032, By Country

Table 23: Latin America Market Value (US$ million) Analysis 2015 to 2021, By Product

Table 24: Latin America Market Value (US$ million) Analysis 2022 to 2032, By Product

Table 25: Latin America Market Volume (Units) Analysis 2015 to 2021, By Product

Table 26: Latin America Market Volume (Units) Analysis 2022 to 2032, By Product

Table 27: Latin America Market Value (US$ million) Analysis 2015 to 2021, By Procedures

Table 28: Latin America Market Value (US$ million) Analysis 2022 to 2032, By Procedures

Table 29: Latin America Market Value (US$ million) Analysis 2015 to 2021, By End User

Table 30: Latin America Market Value (US$ million) Analysis 2022 to 2032, By End User

Table 31: Europe Market Value (US$ million) Analysis 2015 to 2021, By Country

Table 32: Europe Market Value (US$ million) Analysis 2022 to 2032, By Country

Table 33: Europe Market Value (US$ million) Analysis 2015 to 2021, By Product

Table 34: Europe Market Value (US$ million) Analysis 2022 to 2032, By Product

Table 35: Europe Market Volume (Units) Analysis 2015 to 2021, By Product

Table 36: Europe Market Volume (Units) Analysis 2022 to 2032, By Product

Table 37: Europe Market Value (US$ million) Analysis 2015 to 2021, By Procedures

Table 38: Europe Market Value (US$ million) Analysis 2022 to 2032, By Procedures

Table 39: Europe Market Value (US$ million) Analysis 2015 to 2021, By End User

Table 40: Europe Market Value (US$ million) Analysis 2022 to 2032, By End User

Table 41: South Asia Market Value (US$ million) Analysis 2015 to 2021, By Country

Table 42: South Asia Market Value (US$ million) Analysis 2022 to 2032, By Country

Table 43: South Asia Market Value (US$ million) Analysis 2015 to 2021, By Product

Table 44: South Asia Market Value (US$ million) Analysis 2022 to 2032, By Product

Table 45: South Asia Market Volume (Units) Analysis 2015 to 2021, By Product

Table 46: South Asia Market Volume (Units) Analysis 2022 to 2032, By Product

Table 47: South Asia Market Value (US$ million) Analysis 2015 to 2021, By Procedures

Table 48: South Asia Market Value (US$ million) Analysis 2022 to 2032, By Procedures

Table 49: South Asia Market Value (US$ million) Analysis 2015 to 2021, By End User

Table 50: South Asia Market Value (US$ million) Analysis 2022 to 2032, By End User

Table 51: East Asia Market Value (US$ million) Analysis 2015 to 2021, By Country

Table 52: East Asia Market Value (US$ million) Analysis 2022 to 2032, By Country

Table 53: East Asia Market Value (US$ million) Analysis 2015 to 2021, By Product

Table 54: East Asia Market Value (US$ million) Analysis 2022 to 2032, By Product

Table 55: East Asia Market Volume (Units) Analysis 2015 to 2021, By Product

Table 56: East Asia Market Volume (Units) Analysis 2022 to 2032, By Product

Table 57: East Asia Market Value (US$ million) Analysis 2015 to 2021, By Procedures

Table 58: East Asia Market Value (US$ million) Analysis 2022 to 2032, By Procedures

Table 59: East Asia Market Value (US$ million) Analysis 2015 to 2021, By End User

Table 60: East Asia Market Value (US$ million) Analysis 2022 to 2032, By End User

Table 61: Oceania Market Value (US$ million) Analysis 2012 to 2021, By Country

Table 62: Oceania Market Value (US$ million) Analysis 2022 to 2032, By Country

Table 63: Oceania Market Value (US$ million) Analysis 2015 to 2021, By Product

Table 64: Oceania Market Value (US$ million) Analysis 2022 to 2032, By Product

Table 65: Oceania Market Volume (Units) Analysis 2015 to 2021, By Product

Table 66: Oceania Market Volume (Units) Analysis 2022 to 2032, By Product

Table 67: Oceania Market Value (US$ million) Analysis 2015 to 2021, By Procedures

Table 68: Oceania Market Value (US$ million) Analysis 2022 to 2032, By Procedures

Table 69: Oceania Market Value (US$ million) Analysis 2015 to 2021, By End User

Table 70: Oceania Market Value (US$ million) Analysis 2022 to 2032, By End User

Table 71: MEA Market Value (US$ million) Analysis 2012 to 2021, By Country

Table 72: MEA Market Value (US$ million) Analysis 2022 to 2032, By Country

Table 73: MEA Market Value (US$ million) Analysis 2015 to 2021, By Product

Table 74: MEA Market Value (US$ million) Analysis 2022 to 2032, By Product

Table 75: MEA Market Volume (Units) Analysis 2015 to 2021, By Product

Table 76: MEA Market Volume (Units) Analysis 2022 to 2032, By Product

Table 77: MEA Market Value (US$ million) Analysis 2015 to 2021, By Procedures

Table 78: MEA Market Value (US$ million) Analysis 2022 to 2032, By Procedures

Table 79: MEA Market Value (US$ million) Analysis 2015 to 2021, By End User

Table 80: MEA Market Value (US$ million) Analysis 2022 to 2032, By End User
Sabyasachi Ghosh
Sabyasachi Ghosh

Principal Consultant

Talk to Analyst

Find your sweet spots for generating winning opportunities in this market.

List of Charts

Figure 01: Global Market Volume Analysis (Units), 2015 to 2021

Figure 02: Global Market Value Forecast Volume (Units), 2022 to 2032

Figure 03: Global Average Pricing Analysis Benchmark US$ By Product (2021)

Figure 04: Global Pricing Analysis per unit (US$), in 2021 (Diagnostic Instruments)

Figure 05: Global Pricing Forecast per unit (US$), in 2032 (Diagnostic Instruments)

Figure 06: Global Pricing Analysis per unit (US$), in 2021 (Treatment Instruments)

Figure 07: Global Pricing Forecast per unit (US$), in 2032 (Treatment Instruments)

Figure 08: Global Market Value Analysis (US$ million), 2015 to 2021

Figure 09: Global Market Value Forecast (US$ million), 2022 to 2032

Figure 10: Global Market Absolute $ Opportunity, 2022 to 2032

Figure 11: Global Market Share Analysis (%), By Product, 2021 to 2032

Figure 12: Global Market Y-o-Y Analysis (%), By Product, 2022 to 2032

Figure 13: Global Market Attractiveness Analysis, By Product, 2022 to 2032

Figure 14: Global Market Share Analysis (%), By Procedures, 2021 to 2032

Figure 15: Global Market Y-o-Y Analysis (%), By Procedures, 2022 to 2032

Figure 16: Global Market Attractiveness Analysis, By Procedures, 2022 to 2032

Figure 17: Global Market Share Analysis (%), By End User, 2021 to 2032

Figure 18: Global Market Y-o-Y Analysis (%), By End User, 2022 to 2032

Figure 19: Global Market Attractiveness Analysis, By End User, 2022 to 2032

Figure 20: Global Market Share Analysis (%), By Region, 2021 to 2032

Figure 21: Global Market Y-o-Y Analysis (%), By Region, 2022 to 2032

Figure 22: Global Market Attractiveness Analysis, By Region, 2022 to 2032

Figure 23: North America Market Split By Country, 2022 (E)

Figure 24: North America Market Split Product, 2022 (E)

Figure 25: North America Market Split By Procedures, 2022 (E)

Figure 26: North America Market, By End User, 2022 (E)

Figure 27: North America Market Value Analysis (US$ million), 2015 to 2021

Figure 28: North America Market Value Forecast (US$ million), 2022 to 2032

Figure 29: North America Market Attractiveness Analysis, By Product, 2022 to 2032

Figure 30: North America Market Attractiveness Analysis, By Procedures, 2022 to 2032

Figure 31: North America Market Attractiveness Analysis, By End-User, 2022 to 2032

Figure 32: North America Market Attractiveness Analysis, By Country, 2022 to 2032

Figure 33: USA Market Value Proportion Analysis, 2021

Figure 34: USA Market, Vs. Global Growth Y-o-Y (%) Comparison, 2022 to 2032

Figure 35: USA Market Share Analysis (%) By Product, 2021 to 2032

Figure 36: USA Market Share Analysis (%) By Procedures, 2021 to 2032

Figure 37: USA Market Share Analysis (%) By End User, 2021 to 2032

Figure 38: Canada Market Value Proportion Analysis, 2021

Figure 39: Canada Market, Vs. Global Growth Y-o-Y (%) Comparison, 2022 to 2032

Figure 40: Canada Market Share Analysis (%) By Product, 2021 to 2032

Figure 41: Canada Market Share Analysis (%) By Procedures, 2021 to 2032

Figure 42: Canada Market Share Analysis (%) By End User, 2021 to 2032

Figure 43: Latin America Market Split By Country, 2022 (E)

Figure 44: Latin America Market Split Product, 2022 (E)

Figure 45: Latin America Market Split By Procedures, 2022 (E)

Figure 46: Latin America Market, By End User, 2022 (E)

Figure 47: Latin America Market Value Analysis (US$ million), 2015 to 2021

Figure 48: Latin America Market Value Forecast (US$ million), 2022 to 2032

Figure 49: Latin America Market Attractiveness Analysis, By Product, 2022 to 2032

Figure 50: Latin America Market Attractiveness Analysis, By Procedures, 2022 to 2032

Figure 51: Latin America Market Attractiveness Analysis, By End-User, 2022 to 2032

Figure 52: Latin America Market Attractiveness Analysis, By Country, 2022 to 2032

Figure 53: Brazil Market Value Proportion Analysis, 2021

Figure 54: Brazil Market, Vs. Global Growth Y-o-Y (%) Comparison, 2022 to 2032

Figure 55: Brazil Market Share Analysis (%) By Product, 2021 to 2032

Figure 56: Brazil Market Share Analysis (%) By Procedures, 2021 to 2032

Figure 57: Brazil Market Share Analysis (%) By End User, 2021 to 2032

Figure 58: Mexico Market Value Proportion Analysis, 2021

Figure 59: Mexico Market, Vs. Global Growth Y-o-Y (%) Comparison, 2022 to 2032

Figure 60: Mexico Market Share Analysis (%) By Product, 2021 to 2032

Figure 61: Mexico Market Share Analysis (%) By Procedures, 2021 to 2032

Figure 62: Mexico Market Share Analysis (%) By End User, 2021 to 2032

Figure 63: Argentina Market Value Proportion Analysis, 2021

Figure 64: Argentina Market, Vs. Global Growth Y-o-Y (%) Comparison, 2022 to 2032

Figure 65: Argentina Market Share Analysis (%) By Product, 2021 to 2032

Figure 66: Argentina Market Share Analysis (%) By Procedures, 2021 to 2032

Figure 67: Argentina Market Share Analysis (%) By End User, 2021 to 2032

Figure 68: Europe Market Split By Country, 2022 (E)

Figure 69: Europe Market Split Product, 2022 (E)

Figure 70: Europe Market Split By Procedures, 2022 (E)

Figure 71: Europe Market, By End User, 2022 (E)

Figure 72: Europe Market Value Analysis (US$ million), 2015 to 2021

Figure 73: Europe Market Value Forecast (US$ million), 2022 to 2032

Figure 74: Europe Market Attractiveness Analysis, By Product, 2022 to 2032

Figure 75: Europe Market Attractiveness Analysis, By Procedures, 2022 to 2032

Figure 76: Europe Market Attractiveness Analysis, By End-User, 2022 to 2032

Figure 77: Europe Market Attractiveness Analysis, By Country, 2022 to 2032

Figure 78: United Kingdom Market Value Proportion Analysis, 2021

Figure 79: United Kingdom Market, Vs. Global Growth Y-o-Y (%) Comparison, 2022 to 2032

Figure 80: United Kingdom Market Share Analysis (%) By Product, 2021 to 2032

Figure 81: United Kingdom Market Share Analysis (%) By Procedures, 2021 to 2032

Figure 82: United Kingdom Market Share Analysis (%) By End User, 2021 to 2032

Figure 83: Germany Market Value Proportion Analysis, 2021

Figure 84: Germany Market, Vs. Global Growth Y-o-Y (%) Comparison, 2022 to 2032

Figure 85: Germany Market Share Analysis (%) By Product, 2021 to 2032

Figure 86: Germany Market Share Analysis (%) By Procedures, 2021 to 2032

Figure 87: Germany Market Share Analysis (%) By End User, 2021 to 2032

Figure 88: Italy Market Value Proportion Analysis, 2021

Figure 89: Italy Market, Vs. Global Growth Y-o-Y (%) Comparison, 2022 to 2032

Figure 90: Italy Market Share Analysis (%) By Product, 2021 to 2032

Figure 91: Italy Market Share Analysis (%) By Procedures, 2021 to 2032

Figure 92: Italy Market Share Analysis (%) By End User, 2021 to 2032

Figure 93: France Market Value Proportion Analysis, 2021

Figure 94: France Market, Vs. Global Growth Y-o-Y (%) Comparison, 2022 to 2032

Figure 95: France Market Share Analysis (%) By Product, 2021 to 2032

Figure 96: France Market Share Analysis (%) By Procedures, 2021 to 2032

Figure 97: France Market Share Analysis (%) By End User, 2021 to 2032

Figure 98: Spain Market Value Proportion Analysis, 2021

Figure 99: Spain Market, Vs. Global Growth Y-o-Y (%) Comparison, 2022 to 2032

Figure 100: Spain Market Share Analysis (%) By Product, 2021 to 2032

Figure 101: Spain Market Share Analysis (%) By Procedures, 2021 to 2032

Figure 102: Spain Market Share Analysis (%) By End User, 2021 to 2032

Figure 103: Russia Market Value Proportion Analysis, 2021

Figure 104: Russia Market, Vs. Global Growth Y-o-Y (%) Comparison, 2022 to 2032

Figure 105: Russia Market Share Analysis (%) By Product, 2021 to 2032

Figure 106: Russia Market Share Analysis (%) By Procedures, 2021 to 2032

Figure 107: Russia Market Share Analysis (%) By End User, 2021 to 2032

Figure 108: BENELUX Market Value Proportion Analysis, 2021

Figure 109: BENELUX Market, Vs. Global Growth Y-o-Y (%) Comparison, 2022 to 2032

Figure 110: BENELUX Market Share Analysis (%) By Product, 2021 to 2032

Figure 111: BENELUX Market Share Analysis (%) By Procedures, 2021 to 2032

Figure 112: BENELUX Market Share Analysis (%) By End User, 2021 to 2032

Figure 113: Nordic Countries Market Value Proportion Analysis, 2021

Figure 114: Nordic Countries Market, Vs. Global Growth Y-o-Y (%) Comparison, 2022 to 2032

Figure 115: Nordic Countries Market Share Analysis (%) By Product, 2021 to 2032

Figure 116: Nordic Countries Market Share Analysis (%) By Procedures, 2021 to 2032

Figure 117: Nordic Countries Market Share Analysis (%) By End User, 2021 to 2032

Figure 118: South Asia Market Split By Country, 2022 (E)

Figure 119: South Asia Market Split Product, 2022 (E)

Figure 120: South Asia Market Split By Procedures, 2022 (E)

Figure 121: South Asia Market, By End User, 2022 (E)

Figure 122: South Asia Market Value Analysis (US$ million), 2015 to 2021

Figure 123: South Asia Market Value Forecast (US$ million), 2022 to 2032

Figure 124: South Asia Market Attractiveness Analysis, By Product, 2022 to 2032

Figure 125: South Asia Market Attractiveness Analysis, By Procedures, 2022 to 2032

Figure 126: South Asia Market Attractiveness Analysis, By End-User, 2022 to 2032

Figure 127: South Asia Market Attractiveness Analysis, By Country, 2022 to 2032

Figure 128: India Market Value Proportion Analysis, 2021

Figure 129: India Market, Vs. Global Growth Y-o-Y (%) Comparison, 2022 to 2032

Figure 130: India Market Share Analysis (%) By Product, 2021 to 2032

Figure 131: India Market Share Analysis (%) By Procedures, 2021 to 2032

Figure 132: India Market Share Analysis (%) By End User, 2021 to 2032

Figure 133: Malaysia Market Value Proportion Analysis, 2021

Figure 134: Malaysia Market, Vs. Global Growth Y-o-Y (%) Comparison, 2022 to 2032

Figure 135: Malaysia Market Share Analysis (%) By Product, 2021 to 2032

Figure 136: Malaysia Market Share Analysis (%) By Procedures, 2021 to 2032

Figure 137: Malaysia Market Share Analysis (%) By End User, 2021 to 2032

Figure 138: Thailand Market Value Proportion Analysis, 2021

Figure 139: Thailand Market, Vs. Global Growth Y-o-Y (%) Comparison, 2022 to 2032

Figure 140: Thailand Market Share Analysis (%) By Product, 2021 to 2032

Figure 141: Thailand Market Share Analysis (%) By Procedures, 2021 to 2032

Figure 142: Thailand Market Share Analysis (%) By End User, 2021 to 2032

Figure 143: Indonesia Market Value Proportion Analysis, 2021

Figure 144: Indonesia Market, Vs. Global Growth Y-o-Y (%) Comparison, 2022 to 2032

Figure 145: Indonesia Market Share Analysis (%) By Product, 2021 to 2032

Figure 146: Indonesia Market Share Analysis (%) By Procedures, 2021 to 2032

Figure 147: Indonesia Market Share Analysis (%) By End User, 2021 to 2032

Figure 148: East Asia Market Split By Country, 2022 (E)

Figure 149: East Asia Market Split Product, 2022 (E)

Figure 150: East Asia Market Split By Procedures, 2022 (E)

Figure 151: East Asia Market, By End User, 2022 (E)

Figure 152: East Asia Market Value Analysis (US$ million), 2015 to 2021

Figure 153: East Asia Market Value Forecast (US$ million), 2022 to 2032

Figure 154: East Asia Market Attractiveness Analysis, By Product, 2022 to 2032

Figure 155: East Asia Market Attractiveness Analysis, By Procedures, 2022 to 2032

Figure 156: East Asia Market Attractiveness Analysis, By End-User, 2022 to 2032

Figure 157: East Asia Market Attractiveness Analysis, By Country, 2022 to 2032

Figure 158: China Market Value Proportion Analysis, 2021

Figure 159: China Market, Vs. Global Growth Y-o-Y (%) Comparison, 2022 to 2032

Figure 160: China Market Share Analysis (%) By Product, 2021 to 2032

Figure 161: China Market Share Analysis (%) By Procedures, 2021 to 2032

Figure 162: China Market Share Analysis (%) By End User, 2021 to 2032

Figure 163: Japan Market Value Proportion Analysis, 2021

Figure 164: Japan Market, Vs. Global Growth Y-o-Y (%) Comparison, 2022 to 2032

Figure 165: Japan Market Share Analysis (%) By Product, 2021 to 2032

Figure 166: Japan Market Share Analysis (%) By Procedures, 2021 to 2032

Figure 167: Japan Market Share Analysis (%) By End User, 2021 to 2032

Figure 168: South Korea Market Value Proportion Analysis, 2021

Figure 169: South Korea Market, Vs. Global Growth Y-o-Y (%) Comparison, 2022 to 2032

Figure 170: South Korea Market Share Analysis (%) By Product, 2021 to 2032

Figure 171: South Korea Market Share Analysis (%) By Procedures, 2021 to 2032

Figure 172: South Korea Market Share Analysis (%) By End User, 2021 to 2032

Figure 173: Oceania Market Split By Country, 2022 (E)

Figure 174: Oceania Market Split Product, 2022 (E)

Figure 175: Oceania Market Split By Procedures, 2022 (E)

Figure 176: Oceania Market, By End User, 2022 (E)

Figure 177: Oceania Market Value Analysis (US$ million), 2015 to 2021

Figure 178: Oceania Market Value Forecast (US$ million), 2022 to 2032

Figure 179: Oceania Market Attractiveness Analysis, By Product, 2022 to 2032

Figure 180: Oceania Market Attractiveness Analysis, By Procedures, 2022 to 2032

Figure 181: Oceania Market Attractiveness Analysis, By End-User, 2022 to 2032

Figure 182: Oceania Market Attractiveness Analysis, By Country, 2022 to 2032

Figure 183: Australia Market Value Proportion Analysis, 2021

Figure 184: Australia Market, Vs. Global Growth Y-o-Y (%) Comparison, 2022 to 2032

Figure 185: Australia Market Share Analysis (%) By Product, 2021 to 2032

Figure 186: Australia Market Share Analysis (%) By Procedures, 2021 to 2032

Figure 187: Australia Market Share Analysis (%) By End User, 2021 to 2032

Figure 188: New Zealand Market Value Proportion Analysis, 2021

Figure 189: New Zealand Market, Vs. Global Growth Y-o-Y (%) Comparison, 2022 to 2032

Figure 190: New Zealand Market Share Analysis (%) By Product, 2021 to 2032

Figure 191: New Zealand Market Share Analysis (%) By Procedures, 2021 to 2032

Figure 192: New Zealand Market Share Analysis (%) By End User, 2021 to 2032

Figure 193: MEA Market Split By Country, 2022 (E)

Figure 194: MEA Market Split Product, 2022 (E)

Figure 195: MEA Market Split By Procedures, 2022 (E)

Figure 196: MEA Market, By End User, 2022 (E)

Figure 197: MEA Market Value Analysis (US$ million), 2015 to 2021

Figure 198: MEA Market Value Forecast (US$ million), 2022 to 2032

Figure 199: MEA Market Attractiveness Analysis, By Product, 2022 to 2032

Figure 200: MEA Market Attractiveness Analysis, By Procedures, 2022 to 2032

Figure 201: MEA Market Attractiveness Analysis, By End-User, 2022 to 2032

Figure 202: MEA Market Attractiveness Analysis, By Country, 2022 to 2032

Figure 203: Turkey Market Value Proportion Analysis, 2021

Figure 204: Turkey Market, Vs. Global Growth Y-o-Y (%) Comparison, 2022 to 2032

Figure 205: Turkey Market Share Analysis (%) By Product, 2021 to 2032

Figure 206: Turkey Market Share Analysis (%) By Procedures, 2021 to 2032

Figure 207: Turkey Market Share Analysis (%) By End User, 2021 to 2032

Figure 208: GCC Countries Market Value Proportion Analysis, 2021

Figure 209: GCC Countries Market, Vs. Global Growth Y-o-Y (%) Comparison, 2022 to 2032

Figure 210: GCC Countries Market Share Analysis (%) By Product, 2021 to 2032

Figure 211: GCC Countries Market Share Analysis (%) By Procedures, 2021 to 2032

Figure 212: GCC Countries Market Share Analysis (%) By End User, 2021 to 2032

Figure 213: South Africa Market Value Proportion Analysis, 2021

Figure 214: South Africa Market, Vs. Global Growth Y-o-Y (%) Comparison, 2022 to 2032

Figure 215: South Africa Market Share Analysis (%) By Product, 2021 to 2032

Figure 216: South Africa Market Share Analysis (%) By Procedures, 2021 to 2032

Figure 217: South Africa Market Share Analysis (%) By End User, 2021 to 2032

Recommendations

Healthcare

Dental Service Market

Published : April 2024

Healthcare

Dental Imaging Equipment Market

Published : February 2024

Healthcare

Dental Caries and Endodontic Market

Published : September 2023

Explore Healthcare Insights

View Reports