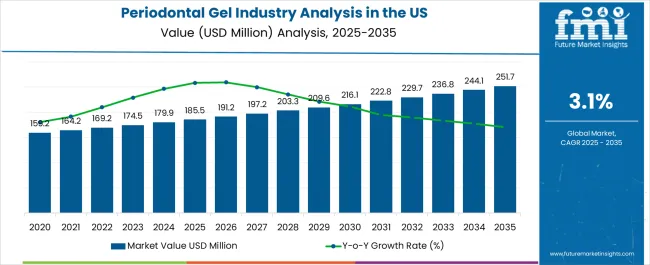
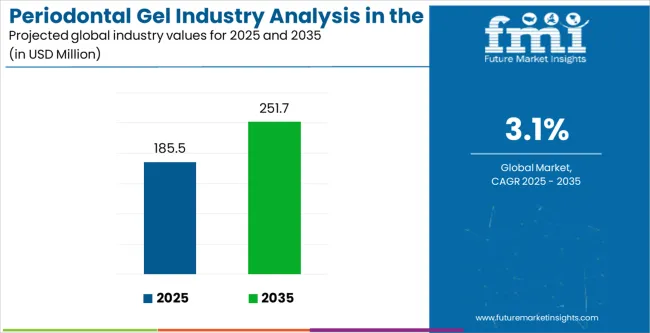
The Periodontal Gel Industry Analysis in the United States is estimated to be valued at USD 185.5 million in 2025 and is projected to reach USD 251.7 million by 2035, registering a compound annual growth rate (CAGR) of 3.1% over the forecast period.
| Metric | Value |
|---|---|
| Periodontal Gel Industry Analysis in the United States Estimated Value in (2025 E) | USD 185.5 million |
| Periodontal Gel Industry Analysis in the United States Forecast Value in (2035 F) | USD 251.7 million |
| Forecast CAGR (2025 to 2035) | 3.1% |
The United States periodontal gel industry is experiencing steady growth. Rising prevalence of periodontal diseases, increasing emphasis on non-invasive treatment options, and greater awareness of oral hygiene are shaping market demand. Current dynamics are influenced by technological advancements in formulation, supportive regulatory approvals, and growing integration of dental care products into preventive treatment protocols.
Pricing pressures and competition from alternative therapies are being offset by continuous innovation in active ingredient combinations and targeted drug delivery mechanisms. The future outlook is supported by expanding dental service networks, higher patient compliance with topical therapies, and increasing adoption of gels as adjunctive solutions alongside conventional periodontal treatments.
Growth rationale is built on the combination of effective clinical outcomes, rising acceptance among dental practitioners, and expanding institutional procurement. Together these factors are expected to sustain long-term industry expansion while ensuring deeper penetration into both professional and consumer markets across the United States.
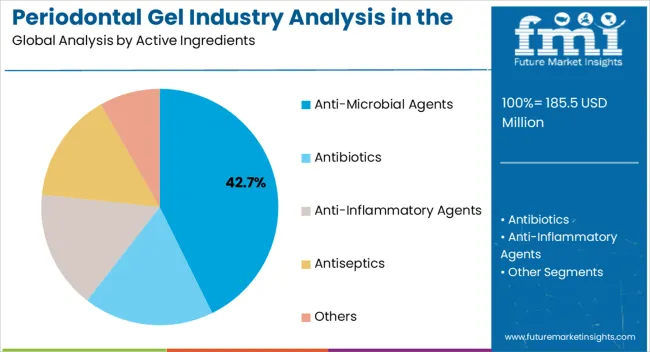
The anti-microbial agents segment, holding 42.7% of the active ingredients category, has remained dominant due to its effectiveness in reducing bacterial load and controlling inflammation in periodontal pockets. Clinical acceptance has been reinforced by consistent outcomes in slowing disease progression and reducing recurrence rates.
Product innovation has focused on enhancing bioavailability, prolonging drug release, and minimizing side effects, which have improved patient adherence. Regulatory compliance and quality assurance practices have further strengthened trust in anti-microbial formulations.
Demand has also been driven by their integration into routine dental procedures and their role as adjuncts to scaling and root planing. The segment’s share is expected to remain stable as manufacturers continue to invest in advanced formulations and targeted delivery systems that improve treatment efficacy and patient experience.
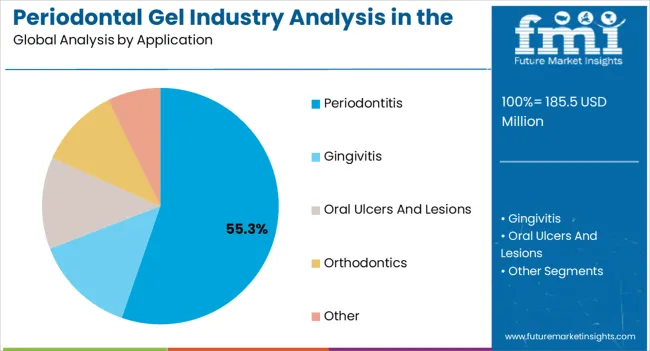
The periodontitis segment, accounting for 55.3% of the application category, has led the market as the primary condition treated with periodontal gels. Its dominance is supported by high prevalence rates in the United States and strong clinical evidence supporting the role of adjunctive gels in managing the disease. Adoption has been driven by the need for localized treatment solutions that reduce systemic side effects.
Strong integration into dental practice protocols and favorable patient acceptance have further reinforced usage. Advances in slow-release formulations and patient-friendly application methods have also supported adherence.
Continued education efforts among dentists and patients are expected to sustain demand for gels in periodontitis management. The segment’s prominence will remain critical as preventive and minimally invasive treatment approaches continue to gain preference in the oral care landscape.
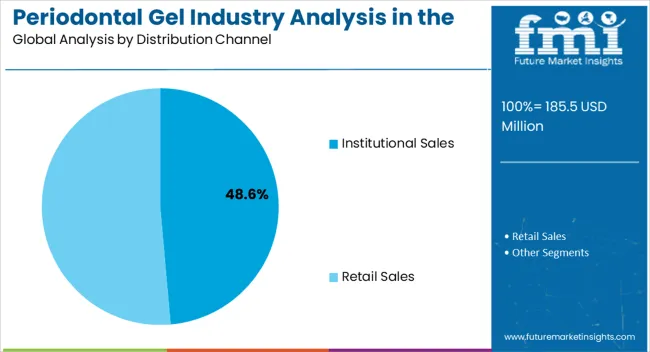
The institutional sales segment, representing 48.6% of the distribution channel category, has led the market due to bulk procurement by dental clinics, hospitals, and academic institutions. Its dominance has been reinforced by reliable supply chain networks and direct partnerships between manufacturers and healthcare providers. Institutional sales have supported wide availability of gels for professional treatments and clinical trials.
Favorable purchasing agreements and long-term supply contracts have added stability to this segment. Trust in institutional channels has been enhanced by adherence to stringent quality standards and timely delivery.
Expansion of dental service organizations and group practices in the United States is expected to further strengthen this channel. Institutional sales will remain a key driver of market share, ensuring consistent adoption and accessibility of periodontal gels in professional healthcare environments.
Non-surgical periodontal therapy methods, such as periodontal gels, are popular for various reasons, including their lack of invasiveness. Many people prefer non-surgical treatments because they are less painful and pose fewer risks. Non-surgical treatments are also available to help maintain and improve dental health over time, providing players with a lucrative opportunity to expand their offerings in the industry.
Furthermore, as technology and product formulations have advanced, non-surgical periodontal gels have become more effective in treating and managing periodontal disorders. Overall, the demand for non-surgical periodontal therapies reflects a shift toward a more patient-centered and holistic approach to periodontal care, which is fueling the popularity of periodontal gels.
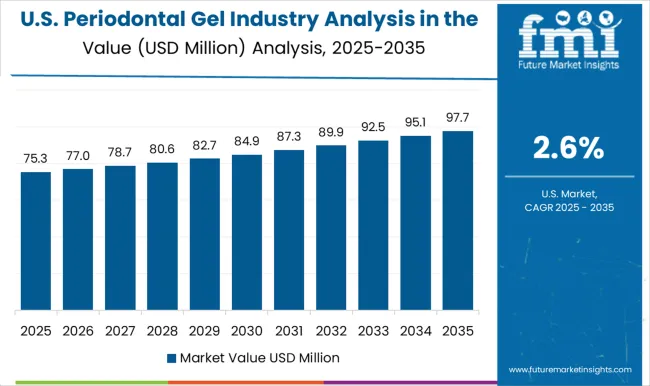
The United States periodontal gel sales recorded a historic CAGR of 2.4% in the last five years from 2020 to 2025. The periodontal gel demand in the United States has undergone significant transformations throughout its history, shaped by changing healthcare practices, technological advancements, and shifting consumer preferences. Periodontal treatments have traditionally relied on traditional scaling and root planing methods. The introduction of periodontal gels, which offer more targeted and efficient solutions for gum disease, has caused a paradigm shift in the industry.
Due to the rising prevalence of periodontal diseases and an aging population, sales of periodontal gel in the United States have historically experienced steady growth. The growing awareness of oral health issues, as well as the demand for minimally invasive treatments, have all contributed to the growth of market. Companies have invested in R&D to introduce novel formulations and delivery mechanisms that improve the efficacy of periodontal gels.
Looking ahead, the periodontal gel sales in the United States is expected to expand further. The aging population, combined with an increase in the prevalence of lifestyle-related risk factors, is expected to fuel demand for periodontal treatments. Biomaterials and nanotechnology advancements may lead to the development of more sophisticated and personalized gels, improving treatment outcomes even further.
Likewise, the integration of digital health technologies and telehealth services could be critical to the industry's future success. Remote monitoring and virtual consultations may become more common, providing patients with more convenient options and expanding the reach of periodontal care.
Challenges such as regulatory considerations, reimbursement policies, and the competitive landscape could impact the industry dynamics. Companies will need to navigate these complexities while capitalizing on opportunities presented by emerging technologies and changing healthcare paradigms.
Partnerships and collaborations with other leading companies are being explored to develop and commercialize new and innovative periodontal gels.
For example, on June 10, 2025, Oral-B and Straumann formed a new global partnership to promote the importance of prevention in periodontal and peri-implant health. The association will set a higher standard for high-quality scientific education for dentists while also assisting their patients in achieving better long-term outcomes.
This collaboration from the key player can assist with technological advancements and product developments, which further aid in the growth of demand for periodontal gel in the United States.
Similarly, this industry has projected lucrative opportunities in the coming years owing to the increased research and development into periodontal treatment devices.
As per data from ClinicalTrials.gov, at the moment, there are around 220 clinical studies related to periodontal diseases that are recruiting and enrolling patients through invitations.
Patients continue to lack access to primary healthcare facilities that can provide adequate treatment. Many countries' national capacity and resources (including trained professionals as well as financial and material resources) are still insufficient to ensure the availability and accessibility of high-quality fundamental health services for the entire population, particularly in underserved communities.
Some countries are making changes to their public services, including the health-care system. This is helping to restructure the methods for funding and delivering healthcare services.
Another restraining factor for the industry is the limited number of insured people in the country. As a result of the nation's large number of uninsured citizens, clinical visits for oral health may be limited or eliminated, reducing the market for periodontal gels.
The Northeast United States marks a sluggish rise in demand for periodontal gel with a CAGR of 1.8% through 2035. The rising prevalence of periodontal (gum) diseases is a key factor driving the periodontal gel demand in the Northeast. Periodontal diseases, such as gingivitis and periodontitis, are common oral health problems characterized by gum inflammation and potential damage to tooth-supporting structures.
As the prevalence of periodontal disease grows, more individuals seek professional dental care, leading to the diagnosis and treatment of periodontal diseases. The demand for convenient and efficient treatment options, such as periodontal gels, is consequently on the rise.
Southwest United States witnessed an increase in demand for periodontal gel at a CAGR of 4.0% through 2035. The periodontal gel market in this region is anticipated to witness a change in momentum as a result of oral health awareness efforts. As more individuals become aware of the value of maintaining good dental health and the necessity of taking preventative steps against potential oral diseases, there may be a rise in demand for periodontal gels from those looking for items that will help them keep their gums healthy.
Public awareness marketing about periodontal gels and other dental care products is common. This can promote the use of these items by assisting individuals in realizing their advantages.
Growth Outlook by Active Ingredients
| Active Ingredients | Value CAGR |
|---|---|
| Anti-microbial Agents | 1.8% |
| Antibiotics | 2.9% |
| Anti-inflammatory Agents | 3.8% |
| Antiseptics | 5.2% |
| Others | 4.6% |
Anti-microbial agents within the active ingredient segment hold a revenue share of 37.7% in 2025, and the same trend is being followed over the forecasted period. Dental professionals prefer antimicrobial agents as active ingredients in periodontal gels due to their effectiveness in treating and managing periodontal diseases. Bacterial plaque buildup on teeth and gums is the primary cause of periodontal diseases. These bacteria are specifically targeted and combated by antimicrobial agents such as chlorhexidine, triclosan, or metronidazole. This targeted approach aids in bacterial load reduction and infection control at the source.
Growth Outlook by Key Application
| Application | Value CAGR |
|---|---|
| Periodontitis | 3.1% |
| Gingivitis | 1.7% |
| Oral Ulcers and Lesions | 4.1% |
| Orthodontics | 5.9% |
| Other | 5.1% |
The increasing prevalence of Gingivitis in the United States has been a primary driver of the demand for periodontal gels. Gingivitis is becoming more common for a variety of reasons. Poor oral hygiene practices, tobacco use, and unhealthy diet choices all play a significant role. Furthermore, the aging population is at a higher risk of gum disease due to natural wear and tear on oral tissues over time.
Growth Outlook by Key Distribution Channel
| Distribution Channel | Value CAGR |
|---|---|
| Institutional Sales | 3.8% |
| Retail Sales | 2.5% |
The retail sales segment dominates the end-user category, holding a 58.5% share in 2025. Retail outlets, including pharmacies, drugstores, and supermarkets, provide widespread accessibility to consumers. These locations are frequented by a broad demographic, making it convenient for individuals to purchase periodontal gels without the need for a prescription. Many periodontal gels are available over-the-counter (OTC), allowing consumers to buy them without consulting a healthcare professional. This accessibility promotes self-care and empowers consumers to address their oral health needs proactively.
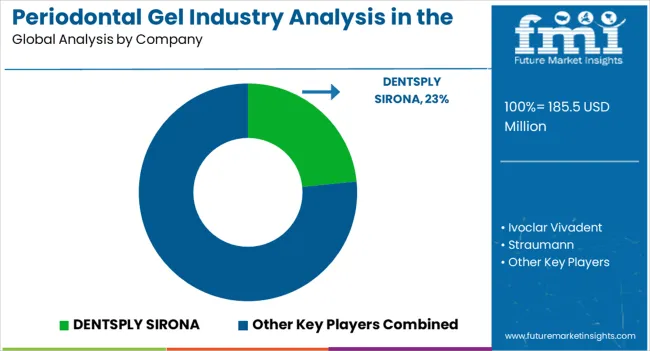
Geographic expansions are a priority for leading periodontal gel companies as they work to create new product lines and expand their consumer base. An increase in research and development is helping manufacturers to achieve better options as per the needs of the patients.
Recent Development
| Attribute | Details |
|---|---|
| Forecast Period | 2025 to 2035 |
| Historical Data Available for | 2020 to 2025 |
| Analysis | USD million for Value |
| Key Regions Covered | Northeast; Midwest; Southeast; Southwest and West |
| Key States Covered | New York, New Jersey, Massachusetts, Minnesota, Wisconsin, North Carolina, South Carolina, Florida, Virginia, Louisiana, Oklahoma, Texas, Washington, California, and New Mexico |
| Key Segments Covered | Active Ingredients, Applications, Distribution Channel and Region |
|
Key Companies Profiled |
Ivoclar Vivadent; Straumann; 3M; Dentaid; Dentovations Inc. (Oxyfresh); DENTSPLY SIRONA; Himalaya Wellness; Sunstar Group; Septodont; Henry Schein; Perio Protect; Den-Mat Holdings, LLC; FREZYDERM S.A; Curaden AG |
| Report Coverage | Industry Forecast, Competition Intelligence, DROT Analysis, Dynamics and Challenges, Strategic Growth Initiatives |
| Pricing | Available upon Request |
The global periodontal gel industry analysis in the United States is estimated to be valued at USD 185.5 million in 2025.
The market size for the periodontal gel industry analysis in the United States is projected to reach USD 251.7 million by 2035.
The periodontal gel industry analysis in the United States is expected to grow at a 3.1% CAGR between 2025 and 2035.
The key product types in periodontal gel industry analysis in the United States are anti-microbial agents, antibiotics, anti-inflammatory agents, antiseptics and others.
In terms of application, periodontitis segment to command 55.3% share in the periodontal gel industry analysis in the United States in 2025.


Full Research Suite comprises of:
Market outlook & trends analysis
Interviews & case studies
Strategic recommendations
Vendor profiles & capabilities analysis
5-year forecasts
8 regions and 60+ country-level data splits
Market segment data splits
12 months of continuous data updates
DELIVERED AS:
PDF EXCEL ONLINE
Periodontal Market Size and Share Forecast Outlook 2025 to 2035
Gel Stent Market Size and Share Forecast Outlook 2025 to 2035
Gel Dryer Market Size and Share Forecast Outlook 2025 to 2035
Gel Warmers Market Size and Share Forecast Outlook 2025 to 2035
Gel Air Fresheners Market Size and Share Forecast Outlook 2025 to 2035
Gellan Gum Market Analysis - Size, Share, and Forecast Outlook 2025 to 2035
Gel Packs Market Size and Share Forecast Outlook 2025 to 2035
Gel Implants Market Analysis - Trends, Share & Forecast 2025 to 2035
Gelling Agent Market Insights – Texture & Food Innovation 2025 to 2035
Gelatin Films Market Size and Share Forecast Outlook 2025 to 2035
Gelatin Substitutes Market Analysis - Size, Share, & Forecast Outlook 2025 to 2035
Gelatin Market Trends - Food, Pharma & Nutritional Growth 2025 to 2035
Gelatin Hydrolysates Market
Gel Imaging Documentation Market Size and Share Forecast Outlook 2025 to 2035
Gel Column Agglutination Test System Market
Gel-Type Strong Acid Cation Exchange Resin Market Size and Share Forecast Outlook 2025 to 2035
Softgel Capsules Market Overview - Growth & Forecast 2025 to 2035
Aerogel Market Size, Growth, and Forecast for 2025 to 2035
Aerogel Film Market Analysis - Size, Share, and Forecast Outlook 2025 to 2035
Pyrogel Insulation Market Size and Share Forecast Outlook 2025 to 2035

Thank you!
You will receive an email from our Business Development Manager. Please be sure to check your SPAM/JUNK folder too.
Chat With
MaRIA