Phospholipid Market
Market Insights on Phospholipid covering sales outlook, demand forecast & up-to-date key trends
Phospholipid Market By Product Type (Natural Phospholipids, Synthetic Phospholipids), Function (Emulsifiers, Texturizers, Stabilizers, Binding Agent, Releasing Agent), Application (Cosmetics, Pharmaceuticals, Nutraceuticals) & Region - Forecast to 2021 - 2031
About the Phospholipids Market
The market for phospholipids is expected to witness surge in demand owing to increasing application in cosmetics, nutrition & supplements, pharmaceutical and industries. Moreover, consumer inclination towards naturally sourced ingredients is driving the phospholipids market. Additionally, increasing awareness about healthy life style with rising consumption of functional and convenience foods are increasing the use of phospholipids ingredient in final product.
Phospholipids are important for health and they act as a key component of cell membranes and facilitate transportation and absorption of essential omega-3 fat in the body. These factors are responsible for increasing use of phospholipids as a key ingredient in various food products.
In its new study, ESOMAR-certified market research and consulting firm Future Market Insights (FMI) offers insights about key factors driving demand for phospholipids. The report tracks the global sales of edible nuts in 20+ high-growth markets, along with analyzing the impact COVID-19 has had on the food and beverage industry in general, and phospholipids in particular.
Let us know your requirement to get
100% FREE customization
How the Historical and Future Outlook for Phospholipids Market Match Up?
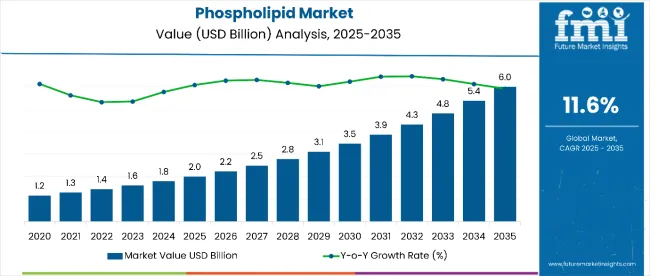
The positive effects of dietary phospholipid have been mentioned from early 1900’s in relation to different symptoms and illnesses such as cancer, coronary heart disease and inflammation. According to FMI’s analysis, phospholipids sales has grown 5% CAGR between 2016 and 2020.
In developing countries such as Brazil, Argentina, India and others, investment in healthy foods, pharmaceutical, and nutraceutical products is increasing. Additionally, awareness about various natural cosmetics and personal care products in the developed countries has triggered the demand for phospholipids.
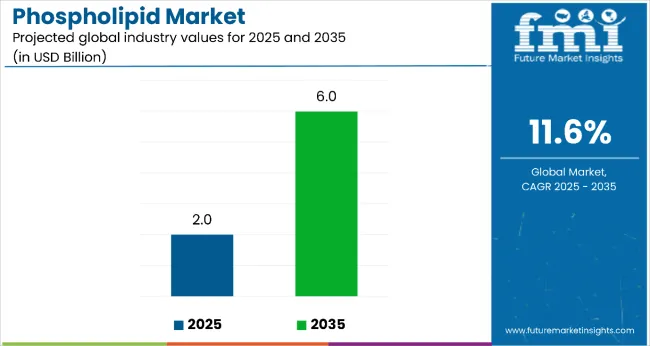
Natural phospholipids have been witnessing increasing demand since they are produced from renewable sources, with more ecologically friendly processes and are available in larger scale at relatively low costs compared to synthetic phospholipids. In addition, they are used in products for any administration route and are fully accepted by regulatory authorities. In contrast, synthetic phospholipids are only used in a few pharmaceutical products. These factors are enabling growth in the phospholipids market at a CAGR of 7.4% in the forecast period 2021-2031.
Why is there Surge in Demand for Phospholipids in Cosmetic Industry?
Consumers are becoming more careful about appearance and are using various cosmetics and cream to maintain their skin. But the cosmetic products available in the market have many chemicals which can damage the skin and may cause skin irritation. Hence, people are inclining towards cosmetics made with ingredients derived from natural sources.
Phospholipids are considered an ideal component because of their natural origin and multifunctional properties that help in solving various skin problems. Hence the demand for phospholipids is increasing, a trend which is expected to continue though the forecast period and will catapult the cosmetics and personal care industry as a key end user.
Find your sweet spots for generating winning opportunities in this market.
Talk to AnalystWhy are Phospholipids Used in Food Sector?
Phosphatidylcholine (PC) is a phospholipid attached to choline particle. Lecithin is a part of phospholipid which is made up of PC. Food products that contain lecithin are considered as the best dietary source of PC. PC helps to boost cognitive function, it improve liver function and keep in control the cholesterol level.
Moreover, some medicine such as NSAIDs nonsteroidal anti-inflammatory drugs may cause gastrointestinal side effects such as intestinal perforation, stomach pain and gastric bleeding. PC helps in preventing gastrointestinal damage. Furthermore, phospholipids have been an essential ingredient in infant formula with containing rich source of omega-3, omega-6 and fatty acids. Phospholipid is gaining traction in the infant supplementary industry also. The health attribute associated with phospholipids will boost the market.
How is Multiple Application of Phospholipids Propelling Growth?
The demand for phospholipids is increasing due to its versatile application in different sectors. This is particularly true in case of phospholipids derived from natural sources. The availability of raw material had enabled manufacturers utilize the resource and expand their product portfolio. Hence, they are investing more on R&D to innovate products. Key players of global phospholipids are focusing on new product launch and offer wide range of products to the customers in the market.
- For instance, in 2017, A global key manufacturer LECICO GmbH from Germany launched new phosphatidylcholine from soy source named as LIPAMINE PC 30 P IP. Specially launched this product for as nutraceuticals in functional foods formulations, excipients in pharmaceutical and liposomes.
- In 2021, the New Zealand market player Fonterra Co-Operative Group Limited launched milk phospholipids under its brand name of NZMP, called “NZMP milk phospholipids 70”. This product specially manufactured for solve nutraceuticals and mental stress problems.

An unified Market Research Subscription Platform, built for today’s disparate research needs.
Country-wise Insights
How big is the Opportunity in India for Phospholipids Sales?
Increasing consumer preference towards green and natural components have fuelled the demand for phospholipid products in the market. With the increase in young population and growing awareness towards health, more consumers are opting for healthier alternatives like food supplements.
Owing to increase in demand as functional food and easy availability of raw materials the demand for phospholipids is expected to surge. The increasing demand of phospholipid for nutraceutical for treating illnesses like aging problem and cognitive disorder is will enable growth in the country, especially since consumers are likelier to spend on maintaining a healthy living.
Why the Demand for Phospholipids is rising in Argentina?
Due to changing lifestyle and urbanization, the demand for packed and convenience foods is rising and this is in turn fuelling the demand for phospholipids in the market. Consumers in Argentina are progressively looking for wellness and health packed food.
Phospholipid is used as an emulsifier in food industry, flow agent for manufacturer of chocolate, baking stabilizer, wetting agent for food instantising and animal feed additive. Infant formula segment is one of the fastest growing segment. Many companies are producing baby food and supplement such as DHA/ALA. This attribute will impact positively the phospholipid based nutritional supplement segment in the market.
For instance, in 2019 Advanced Lipids has launched two new products in infant formula range. Two premium products are Infat pro which offers high level of sn-2 palmitate and Infat MF, it is a special blend containing milk fat.
What are the Factors Driving Phospholipid Sales in U.S?
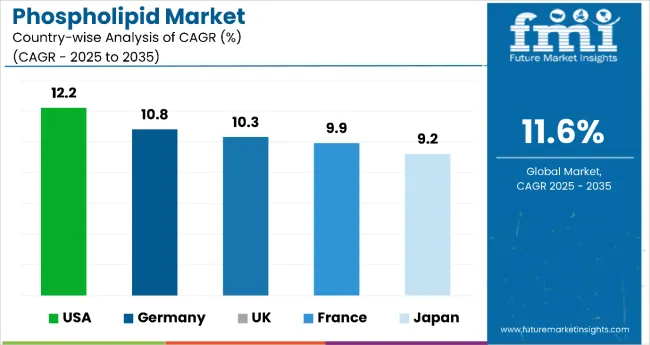
The U.S is expected to witness surge in the demand of phospholipid over the forecast period. Increasing demand for cosmetic products and rising willingness to spend on haircare and skincare products including natural ingredients will boost sales in the country.
Expansion of the cosmetics sectors will remain a chief driver of the market in the U.S. The U.S. also has emerged as a key market for packed food. However, increasing focus on health and wellness have rendered consumers skeptical about ingredients used in food. This has been compelling manufacturers to include natural ingredients, which will aid the expansion of the phospholipids market in the U.S.
Demand in Pharmaceutical Sector Driving Sales in Germany
Germany has emerged as a key market for phospholipids in Europe. The application of phospholipid in pharmaceutical ingredients boost the demand of phospholipid in the market. Phospholipid is widely used in pharma technology as emulsifier, wetting agent and many more.
These functional properties are used in many pharmaceutical formulations such as solid dispersion, suspension, emulsions, drug complexes, and others. The increasing application of phospholipid in pharmaceutical industry will increase the demand of phospholipid in Germany.
What is Driving Phospholipid Sales in China?
China hold the largest market share of the phospholipids market in East Asia. The demand for phospholipids is expected to rise at an accelerated pace in China. Due to its multi functionality such as rising application in feed industry, food and beverage industry, the demand for phospholipids is increasing.
China is home to several thriving industries, food and cosmetics industries are included in the list. Food sector in China has remain a compelling proposition for foreign investors. According to 2019 Taobao Food Live Streaming Trend Repor, dietary supplements are among the list of popular foods in live shows in China. This is indicative of attractive prospects for the expansion of phospholipids market in China.
Category Wise
Which is the Key Application of Phospholipids?
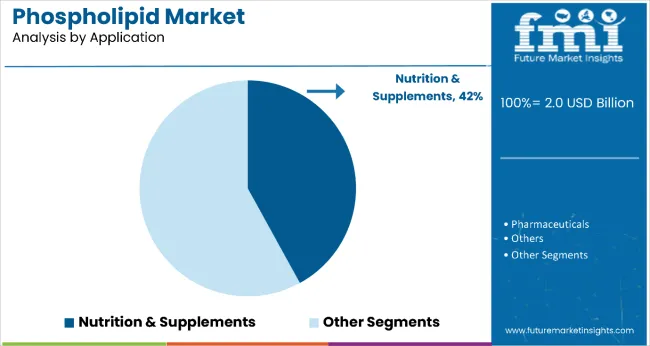
The fast altering consumer standard of living and increasing health awareness amid consumers, specifically in urban regions, have led to a sudden development of nutraceutical market. Additionally, increasing focus on general well-being and fitness is fuelling the demand for additional requirements of antioxidants, proteins, vitamins, and other. Increasing awareness about healthy food and living standard, has been fuelling the demand for nutritious food and supplements. This will in turn increase applications of phospholipids.
Why are Natural Phospholipids Preferred More?
Increasing awareness about environmental wellbeing and human health is inspiring food manufacturers to utilize more sustainable and natural food ingredients. Precisely, there is growing interest in replacing artificial ingredients with natural ingredients, and in substituting animal-based ingredients with plant-based ingredients. This is expected to fuel the demand for natural phospholipids.
Which is the Key Function of Phospholipids?
Phospholipid is used as an emulsifier because they migrate to interface between water and oil and reduce the inter-facial tension and stabilizing an emulsion. Emulsifiers are used in many food products because of to their ability to stabilize water and oil dispersions. Emulsifiers also control crystallization, prevent separation and reduce stickiness.
Competitive Landscape
Phospholipids market is estimated to grow on account of increasing application in food and beverages, personal care, cosmetics products, and pharmaceuticals industries. Key manufacturers are focusing on strategic collaborations to gain competitive advantage:
- For instance, in 2016 American Lecithin company has launched sunflower derived phospholipid and lecithins, including glycerophosphocholine, phosphatidylserine and phosphatidylcholine. These product is launched under the brand ALCOLEC of natural emulsifiers.
- In 2020, Avanti acquired Croda to expand its pharmaceutical services, life science products, pharmaceutical and life science research consumer globally.
- In Jan 2021, Fonterra has launched milk phospholipid in US market. This product is launched with aim of expanding the product portfolio into mental wellness space.
- In 2017, VAV Life Science has inaugurated it manufacturing facility in Ratnagiri, Maharashtra. The facility is set up in India due to emerging application of phospholipids in pharmaceuticals, functional food, cosmetic and nutritional supplements.
Some of the leading companies operating in the phospholipids market are:
- ADM (Archer Daniels Midland Company)
- Avanti Polar Lipids, Inc.
- Bunge Ltd.
- Cargill, Inc.
- DowDuPont, Inc.
- Kewpie Corporation
- Lasenor Emul SL
- Lecico GmbH
- Lipoid GmbH
- Sime Darby Unimills B.V. (The Netherlands)
- SojaProtein a.d.
- Stern-Wywiol Gruppe
- VAV Life Sciences Pvt. Ltd.
- Wilmar International Ltd.
*The list is not exhaustive, and only for representational purposes. Full competitive intelligence with SWOT analysis available in the report.
Scope of the Report
Attribute |
Details |
Forecast Period |
2021-2031 |
Historical Data Available for |
2016-2020 |
Market Analysis |
USD Million for Value and MT for Volume |
Key Regions Covered |
North America, Latin America, Europe, East Asia, South Asia, Oceania, MEA |
Key Countries Covered |
US, Canada, Brazil, Mexico, Argentina, Rest of Latin America, Germany, Italy, France, U.K., Spain, BENELUX, Nordic, Russia, Poland, Rest of Europe, Japan, China, South Korea, India, Thailand, Indonesia, Malaysia, Vietnam, Philippines, Singapore, Rest of South Asia, Australia, New Zealand, GCC Countries, Turkey, South Africa, Rest of MEA |
Key Segments Covered |
Product Type, Application, Function and Region |
Key Companies Profiled |
|
Report Coverage |
Market Forecast, brand share analysis, competition intelligence, Drivers, Restraints, Opportunities and Threats analysis, Key factors, Market Dynamics and Challenges, Strategic Growth Initiatives |
Customization & Pricing |
Frequently Asked Questions
The global phospholipids market is estimated to grow at a CAGR of 7.4% in the next 5 years due to increasing awareness about natural cosmetics and personal care products.
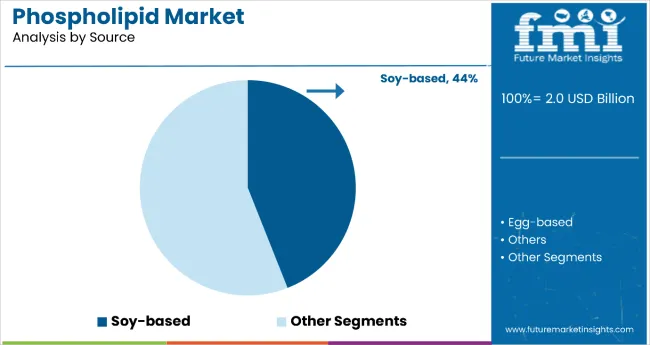
The natural phospholipids hold leading share in the market. The rising demand for ingredients derived from organic sources will fuel the demand for natural phospholipids.
Some of the leading companies offering phospholipids are ADM (Archer Daniels Midland Company), Avanti Polar Lipids, Inc., Bunge Ltd., Cargill, Inc., DowDuPont, Inc., Kewpie Corporation, Lasenor Emul SL, Lecico GmbH, Lipoid GmbH, Sime Darby Unimills B.V. (The Netherlands), SojaProtein a.d., Stern-Wywiol Gruppe, VAV Life Sciences Pvt. Ltd., Wilmar International Ltd among others.
Increasing demand for cosmetics made from natural ingredients will fuel the demand for phospholipids. Besides this, application is expected to rise in pharmaceutical and nutraceutical segments, increasing phospholipids sales.
Some of the key factors affecting the phospholipids market growth are: unpredictable timeline of the virus that led to shortage of raw materials and created logistic and trade restraints. Low per capita disposable income in most affected countries could hamper phospholipids sales.
Table of Content
1. Executive Summary
1.1. Global Market Outlook
1.2. Vertical Specific Market Penetration
1.3. Application – Product Mapping
1.4. Opportunity Assessment- Winning & Loosing Components
1.5. Proprietary Wheel of Fortune
1.6. FMI Analysis and Recommendations
2. Market Introduction
2.1. Market Taxonomy
2.2. Market Definition
3. Scenario Assessment of the Impact of COVID-19 on Phospholipids Market
3.1. Global Phospholipids Market Forecast Scenario Comparison of Annual Growth Rates for short Term (2021-2023) and Long Term (2024-2031)
3.1.1. Optimistic Scenario
3.1.1.1. China
3.1.1.2. US
3.1.1.3. Euro Zone
3.1.1.4. Asia Pacific
3.1.1.5. Rest of the World
3.1.2. Likely Scenario
3.1.2.1. China
3.1.2.2. US
3.1.2.3. Euro Zone
3.1.2.4. Asia Pacific
3.1.2.5. Rest of the World
3.1.3. Pessimistic Scenario
3.1.3.1. China
3.1.3.2. US
3.1.3.3. Euro Zone
3.1.3.4. Asia Pacific
3.1.3.5. Rest of the World
3.2. Key Factors Impacting the Market
3.3. Case Studies- Lessons from the companies that survived & thrived in the last recession
3.4. Customers will change some behaviors permanently- accelerating prior trends; bold action now can set you up for success through the downturn and beyond
4. Market Background
4.1. Production Process Overview
4.2. Production Capacity Analysis by Key countries
4.3. Strategic Promotional Strategies
4.4. Investments in Product R&D Activities
4.5. Macro-Economic Factors
4.5.1. Global GDP Growth Outlook
4.5.2. Global Food Sector GVA
4.5.3. Consumer Confidence Index
4.5.4. Consumer Demographics
4.5.5. Wages Growth
4.5.6. Urbanization Growth
4.5.7. Median Household Income
4.5.8. Unemployment Rate
4.6. Forecast Factors - Relevance & Impact
4.6.1. Top Companies Historical Growth
4.6.2. Foodservice Industry Growth
4.6.3. Packaged Food Industry Growth
4.6.4. Cosmeceuticals Industry Growth
4.6.5. Per Capita Consumption of Spices
4.6.6. Spice Harvest Yield Growth
4.6.7. Price Trend of Agriculture Support Products (Fertilizers, Equipment etc.)
4.6.8. Financing availability to agriculture sector
4.7. Value Chain Analysis
4.7.1. Supply Side Participants and their Roles
4.7.1.1. Producers
4.7.1.2. Mid-Level Participants (Traders/ Agents/ Brokers
4.7.1.3. Wholesalers and Distributors
4.7.2. Profit Margin Analysis
4.7.2.1. Traders/ Agents/ Brokers
4.7.2.2. Retailers
4.7.3. Operating Margins By Region
4.7.4. Notes on Value Added at Each Node in the Value Chain
4.8. Market Dynamics
4.8.1. Drivers
4.8.2. Restraints
4.8.3. Opportunity Analysis
4.9. Key Regulations
4.9.1. Federal Food & Cosmetics Act
4.9.2. China Food & Safety Authority
4.9.3. State Food and Drug Administration (SFDA)
4.9.4. Foods for Specified Health Uses
4.9.5. FSSAI
4.9.6. Food Packaging Claims
4.9.7. Labelling and Claims
4.9.8. Import/Export Regulations
5. Global Phospholipids Market - Pricing Analysis
5.1. Regional Pricing Analysis By Product Type
5.2. Import Vs Domestic Sales Price Analysis
5.3. Pricing Break-up
5.3.1. Manufacturer Level Pricing
5.3.2. Distributor Level Pricing
5.3.3. Import Based F.O.B. Pricing
5.4. Global Average Pricing Analysis Benchmark
6. Global Phospholipids Market Demand (in Value or Size in US$ Mn) Analysis 2016-2020 and Forecast, 2021-2031
6.1. Historical Market Value (US$ Mn) Analysis, 2016-2020
6.2. Current and Future Market Value (US$ Mn) Projections, 2021-2031
6.2.1. Y-o-Y Growth Trend Analysis
6.2.2. Absolute $ Opportunity Analysis
7. Global Phospholipids Market Analysis 2016-2020 and Forecast 2021-2031, By Product Type
7.1. Introduction / Key Findings
7.2. Historical Market Size (US$ Mn) and Volume Analysis By Product Type, 2016-2020
7.3. Current and Future Market Size (US$ Mn) and Volume Analysis and Forecast By Product Type, 2021-2031
7.3.1. Natural Phospholipids
7.3.1.1. Soybean Phospholipids
7.3.1.2. Sunflower Phospholipids
7.3.1.3. Rapeseed Phospholipids
7.3.1.4. Egg Phospholipids
7.3.1.5. Others (corn Phospholipids, canola Phospholipids, etc.)
7.3.2. Synthetic Phospholipids
7.3.3. Market Attractiveness Analysis By Product Type
7.4. Market Attractiveness Analysis By Product Type
8. Global Phospholipids Market Analysis 2016-2020 and Forecast 2021-2031, by Function
8.1. Introduction / Key Findings
8.2. Historical Market Size (US$ Mn) and Volume Analysis By Function, 2016-2020
8.3. Current and Future Market Size (US$ Mn) and Volume Analysis and Forecast By Function, 2021-2031
8.3.1. Emulsifiers
8.3.2. Texturizers
8.3.3. Stabilizers
8.3.4. Binding Agent
8.3.5. Releasing agent
8.4. Market Attractiveness Analysis By Function
9. Global Phospholipids Market Analysis 2016-2020 and Forecast 2021-2031, by Application
9.1. Introduction / Key Findings
9.2. Historical Market Size (US$ Mn) and Volume Analysis By End Use, 2016-2020
9.3. Current and Future Market Size (US$ Mn) and Volume Analysis and Forecast By End Use, 2021-2031
9.3.1. Cosmetics
9.3.1.1. Skin Care
9.3.1.2. Hair Care
9.3.2. Pharmaceuticals
9.3.3. Nutraceuticals
9.4. Market Attractiveness Analysis By End Use
10. Global Phospholipids Market Analysis 2016-2020 and Forecast 2021-2031, by Region
10.1. Introduction
10.2. Historical Market Size (US$ Mn) and Volume Analysis By Region, 2016-2020
10.3. Current Market Size (US$ Mn) and Volume Analysis and Forecast By Region, 2021-2031
10.3.1. North America
10.3.2. Latin America
10.3.3. Europe
10.3.4. Middle East and Africa (MEA)
10.3.5. East Asia
10.3.6. South Asia
10.3.7. Oceania
10.4. Market Attractiveness Analysis By Region
10.5. North America Phospholipids Market Analysis 2016-2020 and Forecast 2021-2031
10.6.
11. North America Phospholipids Market Analysis 2016-2020 and Forecast 2021-2031
11.1. Introduction
11.2. Pricing Analysis
11.3. Historical Market Size (US$ Mn) and Volume Trend Analysis By Market Taxonomy, 2016-2020
11.4. Market Size (US$ Mn) and Volume Forecast By Market Taxonomy, 2021-2031
11.4.1. By Country
11.4.1.1. U.S
11.4.1.2. Canada
11.4.2. By Product Type
11.4.3. By Function
11.4.4. By Application
11.5. Market Attractiveness Analysis
11.5.1. By Country
11.5.2. By Product Type
11.5.3. By Function
11.5.4. By Application
11.6. Market Share (%) Analysis, 2020
11.6.1. U.S.
11.6.1.1. By Product Type
11.6.1.2. By Function
11.6.1.3. By Application
11.6.2. Canada
11.6.2.1. By Product Type
11.6.2.2. By Function
11.6.2.3. By Application
11.7. Market Trends
11.8. Key Market Participants - Intensity Mapping
11.9. Drivers and Restraints - Impact Analysis
12. Latin America Phospholipids Market Analysis 2016-2020 and Forecast 2021-2031
12.1. Introduction
12.2. Pricing Analysis
12.3. Historical Market Size (US$ Mn) and Volume Trend Analysis By Market Taxonomy, 2016-2020
12.4. Market Size (US$ Mn) and Volume Forecast By Market Taxonomy, 2021-2031
12.4.1. By Country
12.4.1.1. Brazil
12.4.1.2. Mexico
12.4.1.3. Rest of Latin America
12.4.2. By Application
12.5. Market Share (%) Analysis, 2020
12.5.1. U.S
12.5.1.1. By Product Type
12.5.1.2. By Function
12.5.1.3. By Application
12.5.2. Canada
12.5.2.1. By Product Type
12.5.2.2. By Function
12.5.2.3. By Function
12.6. Market Trends
12.7. Key Market Participants - Intensity Mapping
12.8. Drivers and Restraints - Impact Analysis
13. Europe Phospholipid Market Analysis 2016-2020 and Forecast 2021-2031
13.1. Introduction
13.2. Pricing Analysis
13.3. Historical Market Size (US$ Mn) and Volume Trend Analysis By Market Taxonomy, 2016-2020
13.4. Market Size (US$ Mn) and Volume Forecast By Market Taxonomy, 2021-2031
13.4.1. By Country
13.4.1.1. Germany
13.4.1.2. Italy
13.4.1.3. France
13.4.1.4. U.K
13.4.1.5. Spain
13.4.1.6. BENELUX
13.4.1.7. Russia
13.4.1.8. Rest of Europe
13.4.2. By Product Type
13.4.3. By Function
13.4.4. By Application
13.5. Market Attractiveness Analysis
13.5.1. By Country
13.5.2. By Product Type
13.5.3. By Function
13.5.4. By Application
13.6. Market Share (%) Analysis, 2020
13.6.1. Germany
13.6.1.1. By Product Type
13.6.1.2. By Function
13.6.1.3. By Application
13.6.2. Italy
13.6.2.1. By Product Type
13.6.2.2. By Function
13.6.2.3. By Application
13.6.3. France
13.6.3.1. By Product Type
13.6.3.2. By Function
13.6.3.3. By Application
13.6.4. U.K
13.6.4.1. By Product Type
13.6.4.2. By Function
13.6.4.3. By Application
13.6.5. Spain
13.6.5.1. By Product Type
13.6.5.2. By Function
13.6.5.3. By Application
13.6.6. Benelux
13.6.6.1. By Product Type
13.6.6.2. By Function
13.6.6.3. By Application
13.6.7. Russia
13.6.7.1. By Product Type
13.6.7.2. By Function
13.6.7.3. By Application
13.7. Market Trends
13.8. Key Market Participants - Intensity Mapping
13.9. Drivers and Restraints - Impact Analysis
14. South Asia Phospholipids Market Analysis 2016-2020 and Forecast 2021-2031
14.1. Introduction
14.2. Pricing Analysis
14.3. Historical Market Size (US$ Mn) and Volume Trend Analysis By Market Taxonomy, 2016-2020
14.4. Market Size (US$ Mn) and Volume Forecast By Market Taxonomy, 2021-2031
14.4.1. By Country
14.4.1.1. India
14.4.1.2. Thailand
14.4.1.3. Indonesia
14.4.1.4. Malaysia
14.4.1.5. Rest of South Asia
14.4.2. By Product Type
14.4.3. By Function
14.4.4. By Application
14.5. Market Attractiveness Analysis
14.5.1. By Country
14.5.2. By Product Type
14.5.3. By Function
14.5.4. By Application
14.6. Market Share (%) Analysis, 2020
14.6.1.1. India
14.6.1.1.1. By Product Type
14.6.1.1.2. By Function
14.6.1.1.3. By Application
14.6.1.2. Thailand
14.6.1.2.1. By Product Type
14.6.1.2.2. By Function
14.6.1.2.3. By Application
14.6.1.3. Indonesia
14.6.1.3.1. By Product Type
14.6.1.3.2. By Function
14.6.1.3.3. By Application
14.6.1.4. Malaysia
14.6.1.4.1. By Product Type
14.6.1.4.2. By Function
14.6.1.4.3. By Application
14.6.1.5. Rest of South Asia
14.6.1.5.1. By Product Type
14.6.1.5.2. By Function
14.6.1.5.3. By Application
14.7. Market Trends
14.8. Key Market Participants - Intensity Mapping
14.9. Drivers and Restraints - Impact Analysis
15. East Asia Phospholipids Market Analysis 2016-2020 and Forecast 2021-2031
15.1. Introduction
15.2. Pricing Analysis
15.3. Historical Market Size (US$ Mn) and Volume Trend Analysis By Market Taxonomy, 2016-2020
15.4. Market Size (US$ Mn) and Volume Forecast By Market Taxonomy, 2021-2031
15.4.1. By Country
15.4.1.1. China
15.4.1.2. Japan
15.4.1.3. South Korea
15.4.2. By Product Type
15.4.3. By Function
15.4.4. By Application
15.5. Market Attractiveness Analysis
15.5.1. By Country
15.5.2. By Product Type
15.5.3. By Function
15.5.4. By Application
15.6. Market Share (%) Analysis, 2020
15.6.1. China
15.6.1.1. By Product Type
15.6.1.2. By Function
15.6.1.3. By Application
15.6.2. Japan
15.6.2.1. By Product Type
15.6.2.2. By Function
15.6.2.3. By Application
15.6.3. South Korea
15.6.3.1. By Product Type
15.6.3.2. By Function
15.6.3.3. By Application
15.7. Market Trends
15.8. Key Market Participants - Intensity Mapping
15.9. Drivers and Restraints - Impact Analysis
16. Oceania Phospholipids Market Analysis 2016-2020 and Forecast 2021-2031
16.1. Introduction
16.2. Pricing Analysis
16.3. Historical Market Size (US$ Mn) and Volume Trend Analysis By Market Taxonomy, 2016-2020
16.4. Market Size (US$ Mn) and Volume Forecast By Market Taxonomy, 2021-2031
16.4.1. By Country
16.4.1.1. Australia
16.4.1.2. New Zealand
16.4.2. By Product Type
16.4.3. By Function
16.4.4. By Application
16.5. Market Attractiveness Analysis
16.5.1. By Country
16.5.2. By Product Type
16.5.3. By Function
16.5.4. By Application
16.6. Market Share (%) Analysis, 2020
16.6.1. Australia
16.6.1.1. By Product Type
16.6.1.2. . By Function
16.6.1.3. By Application
16.6.2. New Zealand
16.6.2.1. By Product Type
16.6.2.2. By Function
16.6.2.3. By Application
16.7. Market Trends
16.8. Key Market Participants - Intensity Mapping
16.9. Drivers and Restraints - Impact Analysis
17. Middle East and Africa Phospholipids Market Analysis 2016-2020 and Forecast 2021-2031
17.1. Introduction
17.2. Pricing Analysis
17.3. Historical Market Size (US$ Mn) and Volume Trend Analysis By Market Taxonomy, 2016-2020
17.4. Market Size (US$ Mn) and Volume Forecast By Market Taxonomy, 2021-2031
17.4.1. By Country
17.4.1.1. GCC Countries
17.4.1.2. Turkey
17.4.1.3. North Africa
17.4.1.4. South Africa
17.4.1.5. Rest of Middle East and Africa
17.4.2. By Product Type
17.4.3. By Function
17.4.4. By Application
17.5. Market Attractiveness Analysis
17.5.1. By Country
17.5.2. By Product Type
17.5.3. By Function
17.5.4. By Application
17.6. Market Share Analysis By Country, 2020
17.6.1. GCC Countries
17.6.1.1. By product
17.6.1.2. By function
17.6.1.3. By application
17.6.2. Turkey
17.6.2.1. By product
17.6.2.2. By function
17.6.2.3. By application
17.6.3. Northern Africa
17.6.3.1. By product
17.6.3.2. By function
17.6.3.3. By application
17.6.4. South Africa
17.6.4.1. By product
17.6.4.2. By function
17.6.4.3. By application
17.6.5. MEA
17.6.5.1. By product
17.6.5.2. By function
17.6.5.3. By application
17.7. Market Trends
17.8. Key Market Participants - Intensity Mapping
17.9. Drivers and Restraints - Impact Analysis
18. Emerging Countries Phospholipids Market Analysis 2016-2020 and Forecast 2021-2031
18.1. Introduction
18.1.1. Market Value Proportion Analysis, By Key Countries
18.1.2. Global Vs. Country Growth Comparison
18.2. China Phospholipids Market Analysis
18.2.1. Introduction
18.2.2. Pricing Analysis
18.2.3. Market Value Proportion Analysis by Market Taxonomy
18.2.4. Market Volume (Metric Tons) and Value (US$ Mn) Analysis and Forecast by Market Taxonomy
18.2.4.1. By Product
18.2.4.2. By Function
18.2.4.3. By Application
18.2.5. China Phospholipids Market - Competition Landscape
18.3. India Clean Label Pectin Market Analysis
18.3.1. Introduction
18.3.2. Pricing Analysis
18.3.3. Market Value Proportion Analysis by Market Taxonomy
18.3.4. Market Volume (Metric Tons) and Value (US$ Mn) Analysis and Forecast by Market Taxonomy
18.3.4.1. By Product
18.3.4.2. By Function
18.3.4.3. By Application
18.3.5. India Phospholipids Market - Competition Landscape
19. Market Structure Analysis
19.1. Market Analysis by Tier of Companies (Phospholipids)
19.2. Company Share Analysis of Top Players
19.2.1. Company share by Region
19.2.2. Company Share By Product Type
19.3. Market Presence Analysis
19.3.1. By Regional footprint of Players
19.3.2. Product foot print by Players
19.3.3. Channel Foot Print by Players
20. Competition Analysis
20.1. Competition Dashboard
20.2. Pricing Analysis by Competition
20.3. Competition Benchmarking
20.4. Competition Deep Dive
20.4.1. ADM (Archer Daniels Midland Company)
20.4.1.1. Overview
20.4.1.2. Total Production Capacity and Actual Utilization Rate
20.4.1.3. Product Portfolio
20.4.1.4. Profitability by Market Segments (Product/Channel/Region)
20.4.1.5. Sales Footprint
20.4.1.6. Strategy Overview
20.4.2. Avanti Polar Lipids, Inc.
20.4.2.1. Overview
20.4.2.2. Total Production Capacity and Actual Utilization Rate
20.4.2.3. Product Portfolio
20.4.2.4. Profitability by Market Segments (Product/Channel/Region)
20.4.2.5. Sales Footprint
20.4.2.6. Strategy Overview
20.4.3. Bunge Ltd.
20.4.3.1. Overview
20.4.3.2. Total Production Capacity and Actual Utilization Rate
20.4.3.3. Product Portfolio
20.4.3.4. Profitability by Market Segments (Product/Channel/Region)
20.4.3.5. Sales Footprint
20.4.3.6. Strategy Overview
20.4.4. Cargill, Inc
20.4.4.1. Overview
20.4.4.2. Total Production Capacity and Actual Utilization Rate
20.4.4.3. Product Portfolio
20.4.4.4. Profitability by Market Segments (Product/Channel/Region)
20.4.4.5. Sales Footprint
20.4.4.6. Strategy Overview
20.4.5. DowDuPont, Inc.
20.4.5.1. Overview
20.4.5.2. Total Production Capacity and Actual Utilization Rate
20.4.5.3. Product Portfolio
20.4.5.4. Profitability by Market Segments (Product/Channel/Region)
20.4.5.5. Sales Footprint
20.4.5.6. Strategy Overview
20.4.6. Kewpie Corporation
20.4.6.1. Overview
20.4.6.2. Total Production Capacity and Actual Utilization Rate
20.4.6.3. Product Portfolio
20.4.6.4. Profitability by Market Segments (Product/Channel/Region)
20.4.6.5. Sales Footprint
20.4.6.6. Strategy Overview
20.4.7. Lasenor Emul SL
20.4.7.1. Overview
20.4.7.2. Total Production Capacity and Actual Utilization Rate
20.4.7.3. Product Portfolio
20.4.7.4. Profitability by Market Segments (Product/Channel/Region)
20.4.7.5. Sales Footprint
20.4.7.6. Strategy Overview
20.4.8. Lecico GmbH
20.4.8.1. Overview
20.4.8.2. Total Production Capacity and Actual Utilization Rate
20.4.8.3. Product Portfolio
20.4.8.4. Profitability by Market Segments (Product/Channel/Region)
20.4.8.5. Sales Footprint
20.4.8.6. Strategy Overview
20.4.9. Lipoid GmbH
20.4.9.1. Overview
20.4.9.2. Total Production Capacity and Actual Utilization Rate
20.4.9.3. Product Portfolio
20.4.9.4. Profitability by Market Segments (Product/Channel/Region)
20.4.9.5. Sales Footprint
20.4.9.6. Strategy Overview
20.4.10. Sime Darby Unimills B.V. (The Netherlands)
20.4.10.1. Overview
20.4.10.2. Total Production Capacity and Actual Utilization Rate
20.4.10.3. Product Portfolio
20.4.10.4. Profitability by Market Segments (Product/Channel/Region)
20.4.10.5. Sales Footprint
20.4.10.6. Strategy Overview
20.4.11. SojaProtein a.d
20.4.11.1. Overview
20.4.11.2. Total Production Capacity and Actual Utilization Rate
20.4.11.3. Product Portfolio
20.4.11.4. Profitability by Market Segments (Product/Channel/Region)
20.4.11.5. Sales Footprint
20.4.11.6. Strategy Overview
20.4.12. Stern-Wywiol Gruppe
20.4.12.1. Overview
20.4.12.2. Total Production Capacity and Actual Utilization Rate
20.4.12.3. Product Portfolio
20.4.12.4. Profitability by Market Segments (Product/Channel/Region)
20.4.12.5. Sales Footprint
20.4.12.6. Strategy Overview
20.4.13. VAV Life Sciences Pvt. Ltd.
20.4.13.1. Overview
20.4.13.2. Total Production Capacity and Actual Utilization Rate
20.4.13.3. Product Portfolio
20.4.13.4. Profitability by Market Segments (Product/Channel/Region)
20.4.13.5. Sales Footprint
20.4.13.6. Strategy Overview
20.4.14. Wilmar International Ltd.
20.4.14.1. Overview
20.4.14.2. Total Production Capacity and Actual Utilization Rate
20.4.14.3. Product Portfolio
20.4.14.4. Profitability by Market Segments (Product/Channel/Region)
20.4.14.5. Sales Footprint
20.4.14.6. Strategy Overview
20.4.15. Others on Additional Request
20.4.15.1. Overview
20.4.15.2. Total Production Capacity and Actual Utilization Rate
20.4.15.3. Product Portfolio
20.4.15.4. Profitability by Market Segments (Product/Channel/Region)
20.4.15.5. Sales Footprint
20.4.15.6. Strategy Overview
21. Assumptions and Acronyms Used
22. Research Methodology
Let us know your requirement to get
100% FREE customization
List of Tables
Table 01: Global Phospholipids Market Size and Incremental $ Opportunity (US$ Mn), 2016-2031
Table 02: Global Phospholipids Market Share and BPS Analysis by Product Type – 2021 & 2031
Table 03: Global Phospholipids Market Attractiveness Analysis by Product Type, 2021-2031
Table 04 : Global Phospholipids Market by Natural Product Type Market Value (US$ Mn), Volume (MT) 2016-2031
Table 05: Global Phospholipids Market Natural Product Type Incremental $ Opportunity, 2021-2031
Table 06: Global Phospholipids Market by Synthetic Product Type Market Value (US$ Mn), Volume (MT) 2016-2031
Table 07: Global Phospholipids Market Synthetic Product Type Incremental $ Opportunity, 2021-2031
Table 08: Global Phospholipids Market Share and BPS Analysis by Applications– 2021 & 2031
Table 09: Global Phospholipids Market Attractiveness Analysis by Applications, 2021-2031
Table 10: Global Phospholipids Market by Cosmetics Application Market Value (US$ Mn), Volume (MT) 2016-2031
Table 11: Global Phospholipids Market Cosmetics Application Incremental $ Opportunity, 2021-2031
Table 12: Global Phospholipids Market by Pharmaceuticals Application Market Value (US$ Mn), Volume (MT) 2016-2031
Table 13: Global Phospholipids Market Pharmaceuticals Application Incremental $ Opportunity, 2021-2031
Table 14: Global Phospholipids Market by Nutraceuticals Application Market Value (US$ Mn), Volume (MT) 2016-2031
Table 15: Global Phospholipids Market Nutraceuticals Application Incremental $ Opportunity, 2021-2031
Table 16: Global Phospholipids Market Share and BPS Analysis by Function– 2021 & 2031
Table 17: Global Phospholipids Market Attractiveness Analysis by Function, 2021-2031
Table 18: Global Phospholipids Market by Emulsifier Function Market Value (US$ Mn), Volume (MT) 2016-2031
Table 19: Global Phospholipids Market Emulsifier Function Incremental $ Opportunity, 2021-2031
Table 20: Global Phospholipids Market by Texturizer Function Market Value (US$ Mn), Volume (MT) 2016-2031
Table 21: Global Phospholipids Market Texturizer Function Incremental $ Opportunity, 2021-2031
Table 22: Global Phospholipids Market by Stabilizer Function Market Value (US$ Mn), Volume (MT) 2016-2031
Table 23: Global Phospholipids Market Stabilizer Function Incremental $ Opportunity, 2021-2031
Table 24: Global Phospholipids Market by Binding Agent Function Market Value (US$ Mn), Volume (MT) 2016-2031
Table 25: Global Phospholipids Market Binding Agent Function Incremental $ Opportunity, 2021-2031
Table 26: Global Phospholipids Market by Releasing agent Function Market Value (US$ Mn), Volume (MT) 2016-2031
Table 27: Global Phospholipids Market Releasing agent Function Incremental $ Opportunity, 2021-2031
Table 28: Global Phospholipids Market Value Share (%) and BPS Analysis by Region, 2016, 2021 & 2031
Table 29: Global Phospholipids Market Y-o-Y Growth (%) Projections by Segment, 2021-2031
Table 30: North America Phospholipids Absolute $ Opportunity Analysis, 2021-2031
Table 31: Latin America Phospholipids Absolute $ Opportunity Analysis, 2021-2031
Table 32: Europe Phospholipids Absolute $ Opportunity Analysis, 2021-2031
Table 33: East Asia Phospholipids Absolute $ Opportunity Analysis, 2021-2031
Table 34: South Asia Phospholipids Absolute $ Opportunity Analysis, 2021-2031
Table 35: Oceania Phospholipids Absolute $ Opportunity Analysis, 2021-2031
Table 36: Middle East & Africa Phospholipids Absolute $ Opportunity Analysis, 2021-2031
Table 37: Global Phospholipids Market Attractiveness Analysis by Region, 2021-2031
Table 38: North America Phospholipids Market Value (US$ Mn), Volume (MT) Forecast and Analysis, 2021-2031
Table 39: North America Phospholipids Market Share and BPS Analysis by Country – 2021 & 2031
Table 40: North America Phospholipids Market Attractiveness Analysis by Country, 2021-2031
Table 41: U.S. Phospholipids Market Incremental $ Opportunity, 2021-2031
Table 42: Canada Phospholipids Market Incremental $ Opportunity, 2021-2031
Table 43: North America Phospholipids Market Share and BPS Analysis by Product Type – 2021 & 2031
Table 44: North America Phospholipids Market Attractiveness Analysis by Product Type, 2021-2031
Table 45: North America Phospholipids Market Share and BPS Analysis by Application– 2021 & 2031
Table 46: North America Phospholipids Market Attractiveness Analysis by Application, 2021-2031
Table 47: North America Phospholipids Market Share and BPS Analysis by Function– 2021 & 2031
Table 48: North America Phospholipids Market Attractiveness Analysis by Function, 2021-2031
Table 49: United States Market Value Share Analysis by Product Type, 2020
Table 50: United States Market Value Share Analysis by Application, 2020
Table 51: United States Market Value Share Analysis by Function, 2020
Table 52: Canada Market Value Share Analysis by Product Type, 2020
Table 53: Canada Market Value Share Analysis by Application, 2020
Table 54: Canada Market Value Share Analysis by Function, 2020
Table 55: Latin America Phospholipids Market Value (US$ Mn), Volume (MT) Forecast and Analysis, 2021-2031
Table 56: Latin America Phospholipids Market Share and BPS Analysis by Country – 2021 & 2031
Table 57: Latin America Phospholipids Market Attractiveness Analysis by Country, 2021-2031
Table 58: Brazil Phospholipids Market Incremental $ Opportunity, 2021-2031
Table 59: Mexico Phospholipids Market Incremental $ Opportunity, 2021-2031
Table 60: Rest of Latin America Phospholipids Market Incremental $ Opportunity, 2021-2031
Table 61: Latin America Phospholipids Market Share and BPS Analysis by Application– 2021 & 2031
Table 62: Latin America Phospholipids Market Attractiveness Analysis by Application, 2021-2031
Table 63: Latin America Phospholipids Market Share and BPS Analysis by Function– 2021 & 2031
Table 64: Latin America Phospholipids Market Attractiveness Analysis by Function, 2021-2031
Table 65: Brazil Market Value Share Analysis by Product Type, 2020
Table 66: Brazil Market Value Share Analysis by Application, 2020
Table 67: Brazil Market Value Share Analysis by Function, 2020
Table 68: Mexico Market Value Share Analysis by Product Type, 2020
Table 69: Mexico Market Value Share Analysis by Application, 2020
Table 70: Mexico Market Value Share Analysis by Function, 2020
Table 71: Rest of Latin America Market Value Share Analysis by Product Type, 2020
Table 72: Rest of Latin America Market Value Share Analysis by Application, 2020
Table 73: Rest of Latin America Market Value Share Analysis by Function, 2020
Table 74: Europe Phospholipids Market Value (US$ Mn), Volume (MT) Forecast and Analysis, 2021-2031
Table 75: Europe Phospholipids Market Share and BPS Analysis by Country – 2021 & 2031
Table 76: Europe Phospholipids Market Attractiveness Analysis by Country, 2021-2031
Table 77: Germany Phospholipids Market Incremental $ Opportunity, 2021-2031
Table 78: France Phospholipids Market Incremental $ Opportunity, 2021-2031
Table 79: Italy Phospholipids Market Incremental $ Opportunity, 2021-2031
Table 80: U.K Phospholipids Market Incremental $ Opportunity, 2021-2031
Table 81: Spain Phospholipids Market Incremental $ Opportunity, 2021-2031
Table 82: BENELUX Phospholipids Market Incremental $ Opportunity, 2021-2031
Table 83: Russia Phospholipids Market Incremental $ Opportunity, 2021-2031
Table 84: Rest of Europe Phospholipids Market Incremental $ Opportunity, 2021-2031
Table 85: Europe Phospholipids Market Share and BPS Analysis by Product Type – 2021 & 2031
Table 86: Europe Phospholipids Market Attractiveness Analysis by Product Type, 2021-2031
Table 87: Europe Phospholipids Market Share and BPS Analysis by Application– 2021 & 2031
Table 88: Europe Phospholipids Market Attractiveness Analysis by Application, 2021-2031
Table 89: Europe Phospholipids Market Share and BPS Analysis by Function– 2021 & 2031
Table 90: Europe Phospholipids Market Attractiveness Analysis by Function, 2021-2031
Table 91: Germany Market Value Share Analysis by Product Type, 2020
Table 92: Germany Market Value Share Analysis by Application, 2020
Table 93: Germany Market Value Share Analysis by Function, 2020
Table 94: Italy Market Value Share Analysis by Product Type, 2020
Table 95: Italy Market Value Share Analysis by Application, 2020
Table 96: Italy Market Value Share Analysis by Function, 2020
Table 97: France Market Value Share Analysis by Product Type, 2020
Table 98: France Market Value Share Analysis by Application, 2020
Table 99: France Market Value Share Analysis by Function, 2020
Table 100: U.K Market Value Share Analysis by Product Type, 2020
Table 101: U.K Market Value Share Analysis by Application, 2020
Table 102: U.K Market Value Share Analysis by Function, 2020
Table 103: Spain Market Value Share Analysis by Product Type, 2020
Table 104: Spain Market Value Share Analysis by Application, 2020
Table 105: Spain Market Value Share Analysis by Function, 2020
Table 106: BENELUX Market Value Share Analysis by Product Type, 2020
Table 107: BENELUX Market Value Share Analysis by Application, 2020
Table 108: BENELUX Market Value Share Analysis by Function, 2020
Table 109: Russia Market Value Share Analysis by Product Type, 2020
Table 110: Russia Market Value Share Analysis by Application, 2020
Table 111: Russia Market Value Share Analysis by Function, 2020
Table 112: Rest of Europe Market Value Share Analysis by Product Type, 2020
Table 113: Rest of Europe Market Value Share Analysis by Application, 2020
Table 114: Rest of Europe Market Value Share Analysis by Function, 2020
Table 115: South Asia Phospholipids Market Value (US$ Mn), Volume (MT) Forecast and Analysis, 2021-2031
Table 116: South Asia Phospholipids Market Share and BPS Analysis by Country – 2021 & 2031
Table 117: South Asia Phospholipids Market Attractiveness Analysis by Country, 2021-2031
Table 118: India Phospholipids Market Incremental $ Opportunity, 2021-2031
Table 119: Malaysia Phospholipids Market Incremental $ Opportunity, 2021-2031
Table 120: Indonesia Phospholipids Market Incremental $ Opportunity, 2021-2031
Table 121: Thailand Phospholipids Market Incremental $ Opportunity, 2021-2031
Table 122: Rest of South Asia Phospholipids Market Incremental $ Opportunity, 2021-2031
Table 123: South Asia Phospholipids Market Share and BPS Analysis by Product Type – 2021 & 2031
Table 124: South Asia Phospholipids Market Attractiveness Analysis by Product Type, 2021-2031
Table 125: South Asia Phospholipids Market Share and BPS Analysis by Application– 2021 & 2031
Table 126: South Asia Phospholipids Market Attractiveness Analysis by Application, 2021-2031
Table 127: South Asia Phospholipids Market Share and BPS Analysis by Function– 2021 & 2031
Table 128: South Asia Phospholipids Market Attractiveness Analysis by Function, 2021-2031
Table 129: India Market Value Share Analysis by Product Type, 2020
Table 130: India Market Value Share Analysis by Application, 2020
Table 131: India Market Value Share Analysis by Function, 2020
Table 132: Malaysia Market Value Share Analysis by Product Type, 2020
Table 133: Malaysia Market Value Share Analysis by Application, 2020
Table 134: Malaysia Market Value Share Analysis by Function, 2020
Table 135: Indonesia Market Value Share Analysis by Product Type, 2020
Table 136: Indonesia Market Value Share Analysis by Application, 2020
Table 137: Indonesia Market Value Share Analysis by Function, 2020
Table 138: Thailand Market Value Share Analysis by Product Type, 2020
Table 139: Thailand Market Value Share Analysis by Application, 2020
Table 140: Thailand Market Value Share Analysis by Function, 2020
Table 141: Rest of South Asia Market Value Share Analysis by Product Type, 2020
Table 142: Rest of South Asia Market Value Share Analysis by Application, 2020
Table 143: Thailand Market Value Share Analysis by Function, 2020
Table 144: East Asia Phospholipids Market Value (US$ Mn), Volume (MT) Forecast and Analysis, 2021-2031
Table 145: South Asia Phospholipids Market Share and BPS Analysis by Country – 2021 & 2031
Table 146: South Asia Phospholipids Market Attractiveness Analysis by Country, 2021-2031
Table 147: China Phospholipids Market Incremental $ Opportunity, 2021-2031
Table 148: Japan Phospholipids Market Incremental $ Opportunity, 2021-2031
Table 149: South Korea Phospholipids Market Incremental $ Opportunity, 2021-2031
Table 150: East Asia Phospholipids Market Share and BPS Analysis by Product Type – 2021 & 2031
Table 151: East Asia Phospholipids Market Attractiveness Analysis by Product Type, 2021-2031
Table 152: East Asia Phospholipids Market Share and BPS Analysis by Application– 2021 & 2031
Table 153: East Asia Phospholipids Market Attractiveness Analysis by Application, 2021-2031
Table 154: East Asia Phospholipids Market Share and BPS Analysis by Function– 2021 & 2031
Table 155: East Asia Phospholipids Market Attractiveness Analysis by Function, 2021-2031
Table 156: China Market Value Share Analysis by Product Type, 2020
Table 157: China Market Value Share Analysis by Application, 2020
Table 158: China Market Value Share Analysis by Function, 2020
Table 159: Japan Market Value Share Analysis by Product Type, 2020
Table 160: Japan Market Value Share Analysis by Application, 2020
Table 161: Japan Market Value Share Analysis by Function, 2020
Table 162: South Korea Market Value Share Analysis by Product Type, 2020
Table 163: South Korea Market Value Share Analysis by Application, 2020
Table 164: South Korea Market Value Share Analysis by Function, 2020
Table 165: Oceania Phospholipids Market Value (US$ Mn), Volume (MT) Forecast and Analysis, 2021-2031
Table 166: Oceania Phospholipids Market Share and BPS Analysis by Country – 2021 & 2031
Table 167: Oceania Phospholipids Market Attractiveness Analysis by Country, 2021-2031
Table 168: Australia Phospholipids Market Incremental $ Opportunity, 2021-2031
Table 169: New Zealand Phospholipids Market Incremental $ Opportunity, 2021-203
Table 170: Oceania Phospholipids Market Share and BPS Analysis by Product Type – 2021 & 2031
Table 171: Oceania Phospholipids Market Attractiveness Analysis by Product Type, 2021-2031
Table 172: Oceania Phospholipids Market Share and BPS Analysis by Application– 2021 & 2031
Table 173: Oceania Phospholipids Market Attractiveness Analysis by Application, 2021-2031
Table 174: Oceania Phospholipids Market Share and BPS Analysis by Function– 2021 & 2031
Table 175: Oceania Phospholipids Market Attractiveness Analysis by Function, 2021-2031
Table 176: Australia Market Value Share Analysis by Product Type, 2020
Table 177: Australia Market Value Share Analysis by Application, 2020
Table 178: Australia Market Value Share Analysis by Function, 2020
Table 179: New Zealand Market Value Share Analysis by Product Type, 2020
Table 180: New Zealand Market Value Share Analysis by Application, 2020
Table 181: New Zealand Market Value Share Analysis by Function, 2020
Table 182 MEA Phospholipids Market Value (US$ Mn), Volume (MT) Forecast and Analysis, 2021-2031
Table 183: MEA Phospholipids Market Share and BPS Analysis by Country – 2021 & 2031
Table 184: MEA Phospholipids Market Attractiveness Analysis by Country, 2021-2031
Table 185: GCC Countries Phospholipids Market Incremental $ Opportunity, 2021-2031
Table 186: South Africa Phospholipids Market Incremental $ Opportunity, 2021-2031
Table 187: Turkey Phospholipids Market Incremental $ Opportunity, 2021-2031
Table 188: North Africa Phospholipids Market Incremental $ Opportunity, 2021-2031
Table 189: Rest of MEA Phospholipids Market Incremental $ Opportunity, 2021-2031
Table 190: MEA Phospholipids Market Share and BPS Analysis by Product Type – 2021 & 2031
Table 191: MEA Phospholipids Market Attractiveness Analysis by Product Type, 2021-2031
Table 192: MEA Phospholipids Market Share and BPS Analysis by Application– 2021 & 2031
Table 193: MEA Phospholipids Market Attractiveness Analysis by Application, 2021-2031
Table 194: MEA Phospholipids Market Share and BPS Analysis by Function– 2021 & 2031
Table 195: MEA Phospholipids Market Attractiveness Analysis by Function, 2021-2031
Table 196: GCC Countries Market Value Share Analysis by Product Type, 2020
Table 197: GCC Countries Market Value Share Analysis by Application, 2020
Table 198: GCC Countries Market Value Share Analysis by Function, 2020
Table 199: South Africa Market Value Share Analysis by Product Type, 2020
Table 200: South Africa Market Value Share Analysis by Application, 2020
Table 201: South Africa Market Value Share Analysis by Function, 2020
Table 202: Turkey Market Value Share Analysis by Product Type, 2020
Table 203: Turkey Market Value Share Analysis by Application, 2020
Table 204: Turkey Market Value Share Analysis by Function, 2020
Table 205: North Africa Market Value Share Analysis by Product Type, 2020
Table 206: North Africa Market Value Share Analysis by Application, 2020
Table 207: North Africa Market Value Share Analysis by Function, 2020
Table 208: Rest of MEA Market Value Share Analysis by Product Type, 2020
Table 209: Rest of MEA Market Value Share Analysis by Application, 2020
Table 210: Rest of MEA Market Value Share Analysis by Function, 2020
Table 211: Market Value Proportion Analysis, By Key Countries, 2021
Table 212: Growth Comparison of Global Market v/s Emerging Countries, 2021-2031
Table 213: Phospholipids Pricing analysis US$/MT (2021)
Table 214: China Phospholipids Market Share and BPS Analysis by Product Type– 2021 & 2031
Table 215: China Phospholipids Market Attractiveness Analysis by Product Type, 2021-2031
Table 216: China Phospholipids Market Share and BPS Analysis by Application– 2021 & 2031
Table 217: China Phospholipids Market Attractiveness Analysis by Application, 2021-2031
Table 218: China Phospholipids Market Share and BPS Analysis by Function– 2021 & 2031
Table 219: China Phospholipids Market Attractiveness Analysis by Function, 2021-2031
Table 220: India Phospholipids Market Share and BPS Analysis by Product Type– 2021 & 2031
Table 221: India Phospholipids Market Attractiveness Analysis by Product Type, 2021-2031
Table 222: India Phospholipids Market Share and BPS Analysis by Application– 2021 & 2031
Table 223: India Phospholipids Market Attractiveness Analysis by Application, 2021-2031
Table 224: India Phospholipids Market Share and BPS Analysis by Function– 2021 & 2031
Table 225: India Phospholipids Market Attractiveness Analysis by Function, 2021-2031
Table 226: Phospholipids Industry Structure Analysis, 2020
Table 227: Key players in Phospholipids Industry (market share in % of value), 2020
Find your sweet spots for generating winning opportunities in this market.
Talk to AnalystList of Charts
Figure 01: Global Phospholipids Market Size and Incremental $ Opportunity (US$ Mn), 2016-2031
Figure 02: Global Phospholipids Market Share and BPS Analysis by Product Type – 2021 & 2031
Figure 03: Global Phospholipids Market Attractiveness Analysis by Product Type, 2021-2031
Figure 04: Global Phospholipids Market by Natural Product Type Market Value (US$ Mn), Volume (MT) 2016-2031
Figure 05: Global Phospholipids Market Natural Product Type Incremental $ Opportunity, 2021-2031
Figure 06: Global Phospholipids Market by Synthetic Product Type Market Value (US$ Mn), Volume (MT) 2016-2031
Figure 07: Global Phospholipids Market Synthetic Product Type Incremental $ Opportunity, 2021-2031
Figure 08: Global Phospholipids Market Share and BPS Analysis by Applications– 2021 & 2031
Figure 09: Global Phospholipids Market Attractiveness Analysis by Applications, 2021-2031
Figure 10: Global Phospholipids Market by Cosmetics Application Market Value (US$ Mn), Volume (MT) 2016-2031
Figure 11: Global Phospholipids Market Cosmetics Application Incremental $ Opportunity, 2021-2031
Figure 12: Global Phospholipids Market by Pharmaceuticals Application Market Value (US$ Mn), Volume (MT) 2016-2031
Figure 13: Global Phospholipids Market Pharmaceuticals Application Incremental $ Opportunity, 2021-2031
Figure 14: Global Phospholipids Market by Nutraceuticals Application Market Value (US$ Mn), Volume (MT) 2016-2031
Figure 15: Global Phospholipids Market Nutraceuticals Application Incremental $ Opportunity, 2021-2031
Figure 16: Global Phospholipids Market Share and BPS Analysis by Function– 2021 & 2031
Figure 17: Global Phospholipids Market Attractiveness Analysis by Function, 2021-2031
Figure 18: Global Phospholipids Market by Emulsifier Function Market Value (US$ Mn), Volume (MT) 2016-2031
Figure 19: Global Phospholipids Market Emulsifier Function Incremental $ Opportunity, 2021-2031
Figure 20: Global Phospholipids Market by Texturizer Function Market Value (US$ Mn), Volume (MT) 2016-2031
Figure 22: Global Phospholipids Market by Stabilizer Function Market Value (US$ Mn), Volume (MT) 2016-2031
Figure 23: Global Phospholipids Market Stabilizer Function Incremental $ Opportunity, 2021-2031
Figure 24: Global Phospholipids Market by Binding Agent Function Market Value (US$ Mn), Volume (MT) 2016-2031
Figure 25: Global Phospholipids Market Binding Agent Function Incremental $ Opportunity, 2021-2031
Figure 26: Global Phospholipids Market by Releasing agent Function Market Value (US$ Mn), Volume (MT) 2016-2031
Figure 27: Global Phospholipids Market Releasing agent Function Incremental $ Opportunity, 2021-2031
Figure 28: Global Phospholipids Market Value Share (%) and BPS Analysis by Region, 2016, 2021 & 2031
Figure 29: Global Phospholipids Market Y-o-Y Growth (%) Projections by Segment, 2021-2031
Figure 30: North America Phospholipids Absolute $ Opportunity Analysis, 2021-2031
Figure 31: Latin America Phospholipids Absolute $ Opportunity Analysis, 2021-2031
Figure 32: Europe Phospholipids Absolute $ Opportunity Analysis, 2021-2031
Figure 33: East Asia Phospholipids Absolute $ Opportunity Analysis, 2021-2031
Figure 34: South Asia Phospholipids Absolute $ Opportunity Analysis, 2021-2031
Figure 35: Oceania Phospholipids Absolute $ Opportunity Analysis, 2021-2031
Figure 36: Middle East & Africa Phospholipids Absolute $ Opportunity Analysis, 2021-2031
Figure 37: Global Phospholipids Market Attractiveness Analysis by Region, 2021 - 2031
Figure 38: North America Phospholipids Market Value (US$ Mn), Volume (MT) Forecast and Analysis, 2021-2031
Figure 39: North America Phospholipids Market Share and BPS Analysis by Country – 2021 & 2031
Figure 40: North America Phospholipids Market Attractiveness Analysis by Country, 2021-2031
Figure 41: U.S. Phospholipids Market Incremental $ Opportunity, 2021-2031
Figure 42: Canada Phospholipids Market Incremental $ Opportunity, 2021-2031
Figure 43: North America Phospholipids Market Share and BPS Analysis by Product Type – 2021 & 2031
Figure 44: North America Phospholipids Market Attractiveness Analysis by Product Type, 2021-2031
Figure 45: North America Phospholipids Market Share and BPS Analysis by Application– 2021 & 2031
Figure 46: North America Phospholipids Market Attractiveness Analysis by Application, 2021-2031
Figure 47: North America Phospholipids Market Share and BPS Analysis by Function– 2021 & 2031
Figure 48: North America Phospholipids Market Attractiveness Analysis by Function, 2021-2031
Figure 49: United States Market Value Share Analysis by Product Type, 2020
Figure 50: United States Market Value Share Analysis by Application, 2020
Figure 51: United States Market Value Share Analysis by Function, 2020
Figure 52: Canada Market Value Share Analysis by Product Type, 2020
Figure 53: Canada Market Value Share Analysis by Application, 2020
Figure 54: Canada Market Value Share Analysis by Function, 2020
Figure 55: Latin America Phospholipids Market Value (US$ Mn), Volume (MT) Forecast and Analysis, 2021-2031
Figure 56: Latin America Phospholipids Market Share and BPS Analysis by Country – 2021 & 2031
Figure 57: Latin America Phospholipids Market Attractiveness Analysis by Country, 2021-2031
Figure 58: Brazil Phospholipids Market Incremental $ Opportunity, 2021-2031
Figure 59: Mexico Phospholipids Market Incremental $ Opportunity, 2021-2031
Figure 60: Rest of Latin America Phospholipids Market Incremental $ Opportunity, 2021-2031
Figure 61: Latin America Phospholipids Market Share and BPS Analysis by Application– 2021 & 2031
Figure 62: Latin America Phospholipids Market Attractiveness Analysis by Application, 2021-2031
Figure 63: Latin America Phospholipids Market Share and BPS Analysis by Function– 2021 & 2031
Figure 64: Latin America Phospholipids Market Attractiveness Analysis by Function, 2021-2031
Figure 65: Brazil Market Value Share Analysis by Product Type, 2020
Figure 66: Brazil Market Value Share Analysis by Application, 2020
Figure 67: Brazil Market Value Share Analysis by Function, 2020
Figure 68: Mexico Market Value Share Analysis by Product Type, 2020
Figure 69: Mexico Market Value Share Analysis by Application, 2020
Figure 70: Mexico Market Value Share Analysis by Function, 2020
Figure 71: Rest of Latin America Market Value Share Analysis by Product Type, 2020
Figure 72: Rest of Latin America Market Value Share Analysis by Application, 2020
Figure 73: Rest of Latin America Market Value Share Analysis by Function, 2020
Figure 74: Europe Phospholipids Market Value (US$ Mn), Volume (MT) Forecast and Analysis, 2021-2031
Figure 75: Europe Phospholipids Market Share and BPS Analysis by Country – 2021 & 2031
Figure 76: Europe Phospholipids Market Attractiveness Analysis by Country, 2021-2031
Figure 77: Germany Phospholipids Market Incremental $ Opportunity, 2021-2031
Figure 78: Italy Phospholipids Market Incremental $ Opportunity, 2021-2031
Figure 79: France Phospholipids Market Incremental $ Opportunity, 2021-2031
Figure 80: U.K Phospholipids Market Incremental $ Opportunity, 2021-2031
Figure 81: Spain Phospholipids Market Incremental $ Opportunity, 2021-2031
Figure 82: BENELUX Phospholipids Market Incremental $ Opportunity, 2021-2031
Figure 83: Russia Phospholipids Market Incremental $ Opportunity, 2021-2031
Figure 84: Rest of Europe Phospholipids Market Incremental $ Opportunity, 2021-2031
Figure 85: Europe Phospholipids Market Share and BPS Analysis by Product Type – 2021 & 2031
Figure 86: Europe Phospholipids Market Attractiveness Analysis by Product Type, 2021-2031
Figure 87: Europe Phospholipids Market Share and BPS Analysis by Application– 2021 & 2031
Figure 88: Europe Phospholipids Market Attractiveness Analysis by Application, 2021-2031
Figure 89: Europe Phospholipids Market Share and BPS Analysis by Function– 2021 & 2031
Figure 90: Europe Phospholipids Market Attractiveness Analysis by Function, 2021-2031
Figure 91: Germany Market Value Share Analysis by Product Type, 2020
Figure 92: Germany Market Value Share Analysis by Application, 2020
Figure 93: Germany Market Value Share Analysis by Function, 2020
Figure 94: Italy Market Value Share Analysis by Product Type, 2020
Figure 95: Italy Market Value Share Analysis by Application, 2020
Figure 96: Italy Market Value Share Analysis by Function, 2020
Figure 97: France Market Value Share Analysis by Product Type, 2020
Figure 98: France Market Value Share Analysis by Application, 2020
Figure 99: France Market Value Share Analysis by Function, 2020
Figure 100: U.K Market Value Share Analysis by Product Type, 2020
Figure 101: U.K Market Value Share Analysis by Application, 2020
Figure 102: U.K Market Value Share Analysis by Function, 2020
Figure 103: Spain Market Value Share Analysis by Product Type, 2020
Figure 104: Spain Market Value Share Analysis by Application, 2020
Figure 105: Spain Market Value Share Analysis by Function, 2020
Figure 106: BENELUX Market Value Share Analysis by Product Type, 2020
Figure 107: BENELUX Market Value Share Analysis by Application, 2020
Figure 108: BENELUX Market Value Share Analysis by Function, 2020
Figure 109: Russia Market Value Share Analysis by Product Type, 2020
Figure 110: Russia Market Value Share Analysis by Application, 2020
Figure 111: Russia Market Value Share Analysis by Function, 2020
Figure 112: Rest of Europe Market Value Share Analysis by Product Type, 2020
Figure 113: Rest of Europe Market Value Share Analysis by Application, 2020
Figure 114: Rest of Europe Market Value Share Analysis by Function, 2020
Figure 115: South Asia Phospholipids Market Value (US$ Mn), Volume (MT) Forecast and Analysis, 2021-2031
Figure 116: South Asia Phospholipids Market Share and BPS Analysis by Country – 2021 & 2031
Figure 117: South Asia Phospholipids Market Attractiveness Analysis by Country, 2021-2031
Figure 118: India Phospholipids Market Incremental $ Opportunity, 2021-2031
Figure 119: Malaysia Phospholipids Market Incremental $ Opportunity, 2021-2031
Figure 120: Indonesia Phospholipids Market Incremental $ Opportunity, 2021-2031
Figure 121: Thailand Phospholipids Market Incremental $ Opportunity, 2021-2031
Figure 122: Rest of South Asia Phospholipids Market Incremental $ Opportunity, 2021-2031
Figure 123: South Asia Phospholipids Market Share and BPS Analysis by Product Type – 2021 & 2031
Figure 124: South Asia Phospholipids Market Attractiveness Analysis by Product Type, 2021-2031
Figure 125: South Asia Phospholipids Market Share and BPS Analysis by Application– 2021 & 2031
Figure 126: South Asia Phospholipids Market Attractiveness Analysis by Application, 2021-2031
Figure 127: South Asia Phospholipids Market Share and BPS Analysis by Function– 2021 & 2031
Figure 128: South Asia Phospholipids Market Attractiveness Analysis by Function, 2021-2031
Figure 129: India Market Value Share Analysis by Product Type, 2020
Figure 130: India Market Value Share Analysis by Application, 2020
Figure 131: India Market Value Share Analysis by Function, 2020
Figure 132: Malaysia Market Value Share Analysis by Product Type, 2020
Figure 133: Malaysia Market Value Share Analysis by Application, 2020
Figure 134: Malaysia Market Value Share Analysis by Function, 2020
Figure 135: Indonesia Market Value Share Analysis by Product Type, 2020
Figure 136: Indonesia Market Value Share Analysis by Application, 2020
Figure 137: Indonesia Market Value Share Analysis by Function, 2020
Figure 138: Thailand Market Value Share Analysis by Product Type, 2020
Figure 139: Thailand Market Value Share Analysis by Application, 2020
Figure 140: Thailand Market Value Share Analysis by Function, 2020
Figure 141: Rest of South Asia Market Value Share Analysis by Product Type, 2020
Figure 142: Rest of South Asia Market Value Share Analysis by Application, 2020
Figure 143: Thailand Market Value Share Analysis by Function, 2020
Figure 144: East Asia Phospholipids Market Value (US$ Mn), Volume (MT) Forecast and Analysis, 2021-2031
Figure 145: South Asia Phospholipids Market Share and BPS Analysis by Country – 2021 & 2031
Figure 146: South Asia Phospholipids Market Attractiveness Analysis by Country, 2021-2031
Figure 147: China Phospholipids Market Incremental $ Opportunity, 2021-2031
Figure 148: Japan Phospholipids Market Incremental $ Opportunity, 2021-2031
Figure 149: South Korea Phospholipids Market Incremental $ Opportunity, 2021-2031
Figure 150: East Asia Phospholipids Market Share and BPS Analysis by Product Type – 2021 & 2031
Figure 151: East Asia Phospholipids Market Attractiveness Analysis by Product Type, 2021-2031
Figure 152: East Asia Phospholipids Market Share and BPS Analysis by Application– 2021 & 2031
Figure 153: East Asia Phospholipids Market Attractiveness Analysis by Application, 2021-2031
Figure 154: East Asia Phospholipids Market Share and BPS Analysis by Function– 2021 & 2031
Figure 155: East Asia Phospholipids Market Attractiveness Analysis by Function, 2021-2031
Figure 156: China Market Value Share Analysis by Product Type, 2020
Figure 157: China Market Value Share Analysis by Application, 2020
Figure 158: China Market Value Share Analysis by Function, 2020
Figure 159: Japan Market Value Share Analysis by Product Type, 2020
Figure 160: Japan Market Value Share Analysis by Application, 2020
Figure 161: Japan Market Value Share Analysis by Function, 2020
Figure 162: South Korea Market Value Share Analysis by Product Type, 2020
Figure 163: South Korea Market Value Share Analysis by Application, 2020
Figure 164: South Korea Market Value Share Analysis by Function, 2020
Figure 165: Oceania Phospholipids Market Value (US$ Mn), Volume (MT) Forecast and Analysis, 2021-2031
Figure 166: Oceania Phospholipids Market Share and BPS Analysis by Country – 2021 & 2031
Figure 167: Oceania Phospholipids Market Attractiveness Analysis by Country, 2021-2031
Figure 168: Australia Phospholipids Market Incremental $ Opportunity, 2021-2031
Figure 169: New Zealand Phospholipids Market Incremental $ Opportunity, 2021-2031
Figure 170: Oceania Phospholipids Market Share and BPS Analysis by Product Type – 2021 & 2031
Figure 171: Oceania Phospholipids Market Attractiveness Analysis by Product Type, 2021-2031
Figure 172: Oceania Phospholipids Market Share and BPS Analysis by Application– 2021 & 2031
Figure 173: Oceania Phospholipids Market Attractiveness Analysis by Application, 2021-2031
Figure 174: Oceania Phospholipids Market Share and BPS Analysis by Function– 2021 & 2031
Figure 175: Oceania Phospholipids Market Attractiveness Analysis by Function, 2021-2031
Figure 176: Australia Market Value Share Analysis by Product Type, 2020
Figure 177: Australia Market Value Share Analysis by Application, 2020
Figure 178: Australia Market Value Share Analysis by Function, 2020
Figure 179: New Zealand Market Value Share Analysis by Product Type, 2020
Figure 180: New Zealand Market Value Share Analysis by Application, 2020
Figure 181: New Zealand Market Value Share Analysis by Function, 2020
Figure 182 MEA Phospholipids Market Value (US$ Mn), Volume (MT) Forecast and Analysis, 2021-2031
Figure 183: MEA Phospholipids Market Share and BPS Analysis by Country – 2021 & 2031
Figure 184: MEA Phospholipids Market Attractiveness Analysis by Country, 2021-2031
Figure 185: GCC Countries Phospholipids Market Incremental $ Opportunity, 2021-2031
Figure 186: South Africa Phospholipids Market Incremental $ Opportunity, 2021-2031
Figure 187: Turkey Phospholipids Market Incremental $ Opportunity, 2021-2031
Figure 188: North Africa Phospholipids Market Incremental $ Opportunity, 2021-2031
Figure 189: Rest of MEA Phospholipids Market Incremental $ Opportunity, 2021-2031
Figure 190: MEA Phospholipids Market Share and BPS Analysis by Product Type – 2021 & 2031
Figure 191: MEA Phospholipids Market Attractiveness Analysis by Product Type, 2021-2031
Figure 192: MEA Phospholipids Market Share and BPS Analysis by Application– 2021 & 2031
Figure 193: MEA Phospholipids Market Attractiveness Analysis by Application, 2021-2031
Figure 194: MEA Phospholipids Market Share and BPS Analysis by Function– 2021 & 2031
Figure 195: MEA Phospholipids Market Attractiveness Analysis by Function, 2021-2031
Figure 196: GCC Countries Market Value Share Analysis by Product Type, 2020
Figure 197: GCC Countries Market Value Share Analysis by Application, 2020
Figure 198: GCC Countries Market Value Share Analysis by Function, 2020
Figure 199: South Africa Market Value Share Analysis by Product Type, 2020
Figure 200: South Africa Market Value Share Analysis by Application, 2020
Figure 201: South Africa Market Value Share Analysis by Function, 2020
Figure 202: Turkey Market Value Share Analysis by Product Type, 2020
Figure 203: Turkey Market Value Share Analysis by Application, 2020
Figure 204: Turkey Market Value Share Analysis by Function, 2020
Figure 205: North Africa Market Value Share Analysis by Product Type, 2020
Figure 206: North Africa Market Value Share Analysis by Application, 2020
Figure 207: North Africa Market Value Share Analysis by Function, 2020
Figure 208: Rest of MEA Market Value Share Analysis by Product Type, 2020
Figure 209: Rest of MEA Market Value Share Analysis by Application, 2020
Figure 210: Rest of MEA Market Value Share Analysis by Function, 2020
Figure 211: Market Value Proportion Analysis, By Key Countries, 2021
Figure 212: Growth Comparison of Global Market v/s Emerging Countries, 2021-2031
Figure 213: Phospholipids Pricing analysis US$/MT (2021)
Figure 214: China Phospholipids Market Share and BPS Analysis by Product Type– 2021 & 2031
Figure 215: China Phospholipids Market Attractiveness Analysis by Product Type, 2021-2031
Figure 216: China Phospholipids Market Share and BPS Analysis by Application– 2021 & 2031
Figure 217: China Phospholipids Market Attractiveness Analysis by Application, 2021-2031
Figure 218: China Phospholipids Market Share and BPS Analysis by Function– 2021 & 2031
Figure 219: China Phospholipids Market Attractiveness Analysis by Function, 2021-2031
Figure 220: India Phospholipids Market Share and BPS Analysis by Product Type– 2021 & 2031
Figure 221: India Phospholipids Market Attractiveness Analysis by Product Type, 2021-2031
Figure 222: India Phospholipids Market Share and BPS Analysis by Application– 2021 & 2031
Figure 223: India Phospholipids Market Attractiveness Analysis by Application, 2021-2031
Figure 224: India Phospholipids Market Share and BPS Analysis by Function– 2021 & 2031
Figure 225: India Phospholipids Market Attractiveness Analysis by Function, 2021-2031
Figure 226: Phospholipids Industry Structure Analysis, 2020
Figure 227: Key players in Phospholipids Industry (market share in % of value), 2020
Need specific information?
Request CustomizationExplore Food and Beverage Insights
View Reports