Phytobiotics Palatants Market Size and Share Forecast Outlook 2025 to 2035

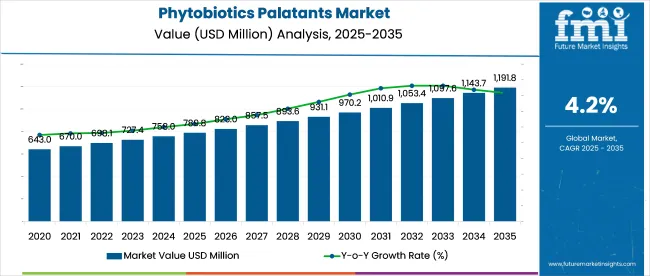
The phytobiotics palatants market, a vital segment of feed-additive solutions, is projected to grow from USD 789.8 million in 2025 to USD 1,192.9 million by 2035, at an 4.2% CAGR. Demand is being supported by rising livestock and pet nutrition needs, with plant-derived flavor enhancers particularly liquid, solid, and paste palatants being favored for improved feed intake in poultry, swine, and companion animals.
Quick Stats of the Phytobiotics Palatants Market

  • Industry Size (2025): USD 789.8 million
  • Industry Value (2035): USD 1,192.9 million
  • Forecast CAGR (2025 to 2035): 4.2%
  • Leading Segment: Flavor Enhancement (42%)
  • Key Growth Region: Asia Pacific(India)
  • Key Players: Phytobiotics Futterzusatzstoffe GmbH, Delacon Biotechnik GmbH (Cargill), Pancosma SA (ADM), Ayurvet Limited, Aromex

Phytobiotics Palatants Market

Attribute Detail
Market Size (2025) USD 789.8 million
Market Size (2035) USD 1,192.9 million
CAGR (2025 to 2035) 4.2%

It is argued that suppliers investing in natural-extract palatants, functional blends, and clean-label credentials will outperform commodity-based counterparts. However, it is suggested that regulatory inconsistencies and cost pressures may limit broader adoption unless scale efficiencies are realized. Industry concentration is expected to increase as major agritech firms like ADM, Cargill, and DSM-Firmenich acquire niche palatant specialists to enhance their feed-additive portfolios.

In January 2024, Phytobiotics Futterzusatzstoffe GmbH expanded its presence in the industry by launching nine new “smart flavours” designed to improve feed palatability across livestock species, including ruminants, poultry, pigs, and aquaculture. These additions aim to optimize feed intake and animal performance, reflecting rising industry demand for taste-driven nutrition solutions.

The launch supports Phytobiotics’ strategic focus on sensory feed enhancements and positions the company competitively within the evolving feed palatant industry, which continues to see increased attention from producers prioritizing feed efficiency and species-specific intake behavior.

The industry holds a specialized share within its parent markets. In the animal feed market, it accounts for approximately 5-7%, as palatants are widely used to improve the acceptance of feed by animals. In the pet food market, the share is around 3-5%, driven by the demand for palatable, high-quality pet food.

Within the nutraceuticals market, its share is approximately 2-3%, as phytobiotics palatants are used to enhance flavor in functional foods and supplements. In the agricultural chemicals market, its share is about 1-2%, as palatants are used in some agricultural products. In the food and beverage market, the share is around 1-2%, used for flavor enhancement in specific functional products.

Analyzing Phytobiotics Palatants Market by Top Investment Segments

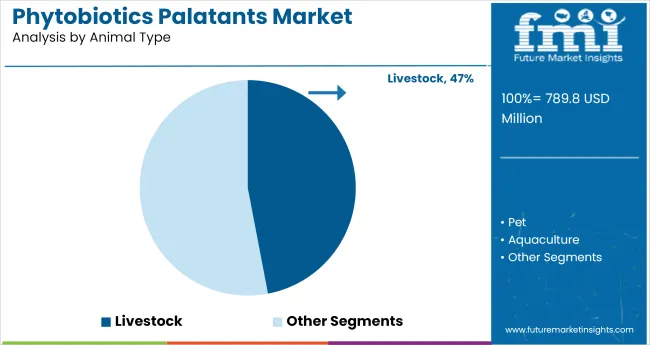
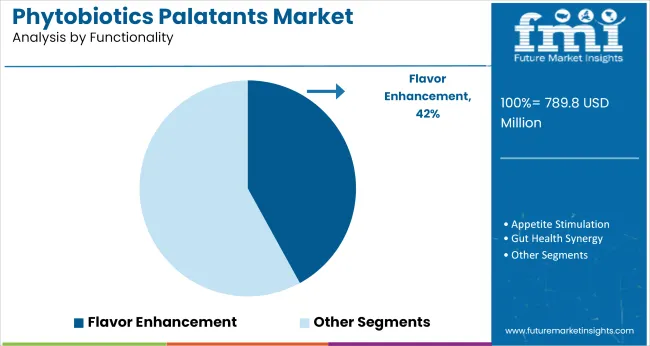
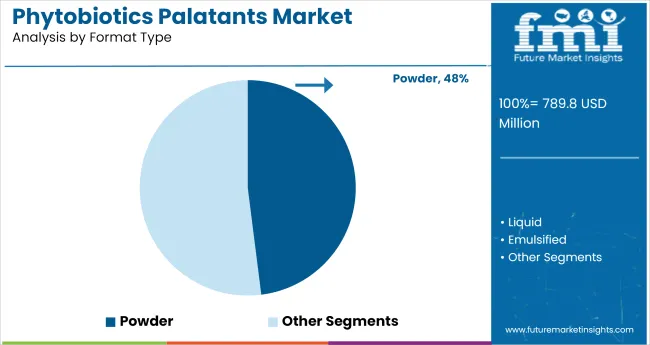
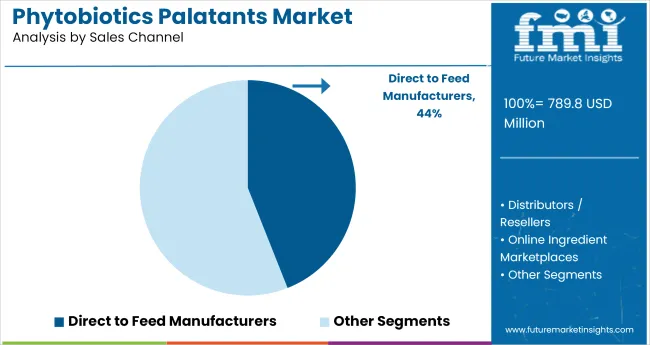
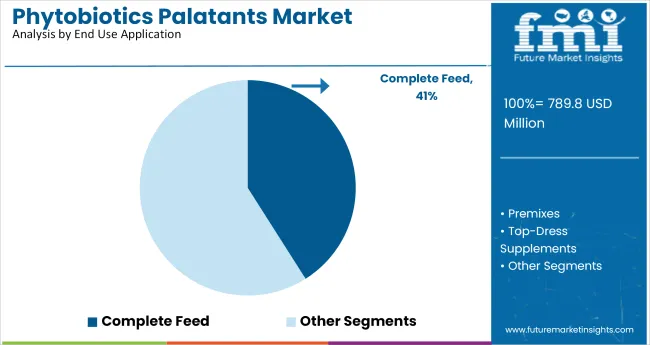
The industry is projected to see essential oil-based products leading the source type segment with 35%, livestock as the dominant animal type with 47%, flavor enhancement as the top functionality at 42%, powder as the leading format type with 48%, and direct-to-feed manufacturers accounting for 44% of the sales channel share. Complete feed will dominate the end-use application with 41% industry share.
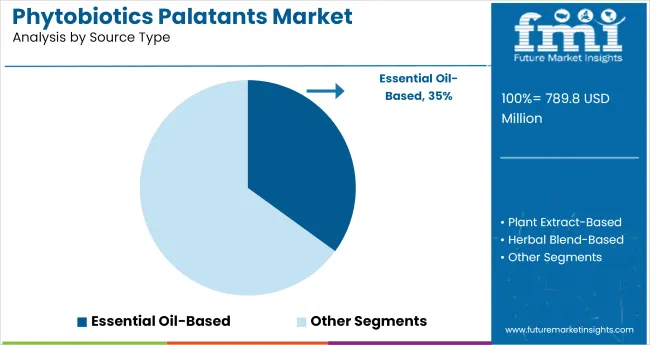
Essential oil-based source leads segment with 35% industry share

Phytobiotics Palatants Market Analysis By Source Type

Essential oil-based phytobiotics palatants are expected to capture 35% of the industry share in 2025. These palatants are popular due to their natural, safe, and effective properties in enhancing the flavor of animal feed. Essential oils such as oregano, thyme, and garlic offer antimicrobial benefits, while also improving the palatability of feed, ensuring better consumption by livestock. The increasing preference for natural ingredients and clean-label products in animal nutrition drives the growth of essential oil-based palatants in the industry.
  • Natural and safe ingredients like oregano and thyme improve feed flavor and palatability
  • Increasing demand for clean-label, natural solutions boosts essential oil-based palatants
  • Essential oils also provide antimicrobial benefits, enhancing feed quality and health

Livestock dominates animal type segment with 47% industry share

Phytobiotics Palatants Market Analysis By Animal Type

Livestock, including swine, poultry, and ruminants, is expected to hold 47% of the industry share in 2025. The dominant presence of livestock in the industry is driven by the significant demand for animal feed additives to improve feed intake, digestion, and overall health. With the growing need for effective feed solutions that support optimal growth, immunity, and disease resistance in livestock, phytobiotics palatants remain a key tool in the agricultural sector, driving high industry demand for these segments.
  • Livestock includes swine, poultry, and ruminants, key drivers of feed consumption
  • Phytobiotics palatants improve feed intake, digestion, and overall health of livestock
  • Rising focus on animal health and productivity drives livestock dominance in the industry

Flavor enhancement functionality leads with 42% industry share

Phytobiotics Palatants Market Analysis By Functionality

Flavor enhancement is projected to dominate the functionality segment with 42% of the industry share in 2025. Phytobiotics palatants designed for flavor enhancement play a crucial role in improving the palatability of animal feed, ensuring better feed intake and nutritional uptake. By masking the bitter taste of certain feed ingredients and improving flavor profiles, these palatants encourage higher consumption, resulting in better growth rates, improved health, and optimized feed conversion.
  • Enhances palatability by masking bitter feed tastes and improving flavor profiles
  • Drives higher feed consumption and improves feed conversion rates
  • Critical for improving animal growth and overall health in feed applications

Powder format leads with 48% industry share

Phytobiotics Palatants Market Analysis By Format Type

The powder format is expected to capture 48% of the industry share in 2025. The powder form is preferred due to its ease of mixing with animal feed, versatility, and compatibility with various feed formulations. Powdered palatants offer convenient application, and they allow for precise dosing, ensuring that animals receive the optimal amount of active ingredients. This format is especially popular in large-scale feed production, where uniform mixing and ease of handling are essential.
  • Powder format allows for precise dosing and ease of mixing in feed
  • Highly versatile and compatible with different types of animal feed formulations
  • Preferred in large-scale feed production for its convenience and consistency

Direct to feed manufacturers dominates sales channel with 44% industry share

Phytobiotics Palatants Market Analysis By Sales Channel

The direct-to-feed manufacturers channel is expected to capture 44% of the industry share in 2025. This distribution model allows for efficient and large-scale supply of phytobiotics palatants to feed manufacturers who can incorporate these ingredients into their feed formulations.

By working directly with feed manufacturers, palatant producers can ensure the quality and consistency of the product while also meeting the specific needs of the feed industry. This channel’s dominance is further reinforced by the increasing demand for customized and effective feed solutions.
  • Direct supply to feed manufacturers ensures product consistency and quality
  • Enables large-scale distribution to meet the demand for high-quality feed additives
  • Supports customization of palatants to meet specific animal health and nutrition needs

Complete feed leads end-use application with 41% industry share

Phytobiotics Palatants Market Analysis By End Use Application

Complete feed is projected to hold 41% of the industry share in the end-use application segment by 2025. Phytobiotics palatants are crucial for inclusion in complete feed formulations, where they enhance the overall quality, taste, and nutritional value of the feed. As the demand for complete and balanced feed formulations grows, the need for palatants that can improve flavor and nutritional content in these products continues to rise.

  • Essential for improving flavor, taste, and nutritional value of complete feed
  • Growing demand for complete and balanced feed formulations drives industry share
  • Key for improving overall feed quality and animal health in various sectors

Top Phytobiotics Palatants Market Dynamics

The industry is expanding due to the increasing demand for natural and effective feed additives in animal nutrition. However, challenges such as limited awareness, regulatory complexities, and competition from synthetic alternatives are hindering broader adoption.

Growing Demand for Natural Feed Additives

The industry is experiencing growth driven by the increasing preference for natural feed additives in animal nutrition. Phytobiotics, derived from plant-based sources, offer benefits such as enhanced palatability, improved digestion, and better overall health in animals.

As consumers and producers seek alternatives to synthetic additives, the demand for phytobiotics palatants is rising. This trend is particularly evident in the poultry and swine sectors, where feed acceptance and performance are critical.

  • Consumer preference for natural additives boosts phytobiotics demand.
  • Enhanced animal health drives adoption in poultry and swine.
  • Regulatory support for natural ingredients encourages industry growth.

Challenges in Industry Penetration and Awareness

Despite the benefits, the industry faces challenges related to limited awareness and understanding among producers. Many are accustomed to synthetic additives and may be hesitant to switch to plant-based alternatives due to perceived efficacy concerns or unfamiliarity. Additionally, the higher cost of phytobiotics compared to traditional additives can be a deterrent, especially for small-scale producers operating on tight margins.

  • Limited awareness hinders widespread adoption among producers.
  • Perceived efficacy concerns affect producer confidence.
  • Higher costs pose challenges for small-scale producers.

Top Countries Innovating, Blending, and Scaling Phytobiotics Palatants

Global industry demand is projected to rise at a 4.2% CAGR from 2025 to 2035. Of the five profiled countries out of 40 covered, India leads at 3.6%, followed by China at 3.2%, and the United States and Australia, both at 3.4%, while the United Kingdom records 2.8%.

These rates translate to a growth premium of -14% for India, -24% for China, and -19% for the United States versus the baseline, while Australia and the United Kingdom show slower growth. Divergence reflects local catalysts: increasing demand for natural additives and health-conscious feeding in India and China, while the United States and Australia experience more steady growth driven by stable agricultural sectors. The United Kingdom lags with slower adoption of phytobiotics palatants in animal feed.

Countries CAGR (2025 to 2035)
United States 3.4%
United Kingdom 2.8%
China 3.2%
India 3.6%
Australia 3.4%

Growth Analysis of the Phytobiotics Palatants Market in the United States

Sales of phytobiotics palatants in the United States are projected to grow at a CAGR of 3.4% between 2025 and 2035. Rising scrutiny around antibiotic alternatives in livestock nutrition has encouraged broader use of botanical-based palatants.

Feed manufacturers are reformulating rations for poultry and swine with citrus extracts and saponin compounds to improve intake under stress. USA-based integrators are aligning formulations with voluntary antibiotic-free labeling programs, increasing reliance on phytobiotics.

  • Citrus and yucca-based palatants are being introduced in swine nursery diets to improve early feed adoption.
  • Supplier tie-ups with commercial poultry producers are increasing flavor customization.
  • University-led trials are validating palatant efficacy for heat-stressed livestock across the southern USA

Demand Forecast for Phytobiotics Palatants in the United Kingdom

The industry in the United Kingdom is expected to register a CAGR of 2.8% through 2035. Compliance with post-Brexit antimicrobial limits in livestock feed has fueled interest in phyto-additives.

Feed mills are incorporating plant-derived stimulants in ruminant premixes to enhance palatability during ration shifts. Distributors prefer EU-certified blends with documented sensory improvement in low-energy diets.

  • Botanical palatants are being trialed in post-weaning piglet diets to offset reduced antibiotic access.
  • Food chain assurance programs are influencing supplier selection of plant-based enhancers.
  • Cattle palatability boosters with carvacrol and eugenol are gaining favor in Scottish beef systems.

Outlook for Phytobiotics Palatants Market in China

China’s industry is expected to expand at a CAGR of 3.2% from 2025 to 2035. Shifts toward feed safety and residue-free animal production continue to reshape formulation norms.

Imports of essential oil-based palatants have risen, especially for aquafeed and pet applications. Domestic players are developing blends combining ginger, licorice, and green tea extracts to address regional taste preferences.

  • Government audits on veterinary drug residues have increased palatant use in antibiotic-free programs.
  • Piglet starter feeds use capsicum and garlic-based enhancers to stimulate appetite.
  • Aquaculture hatcheries are adopting phytogenic emulsions to increase feed efficiency in carp.

Phytobiotics Palatants Market Growth Outlook in India

India’s industry is projected to grow at a CAGR of 3.6% during the forecast period. Growth stems from the widespread transition away from growth-promoting antibiotics in poultry and aquaculture feed.

Domestic extractors are expanding supply of fenugreek, cinnamon, and holy basil-based ingredients tailored to species-specific needs. Feed consumption volatility during climatic stress has further raised interest in aroma-enhancing phytobiotics.

  • Poultry integrators use botanical palatants to mask bitterness in herbal coccidiostat formulas.
  • Pet food processors are adopting herbal palatants in premium kibble lines.
  • Maharashtra and Telangana-based feed mills are investing in phyto-palatability R&D trials.

Market Trends in Phytobiotics Palatants Use in Australia

Australia’s industry is estimated to rise at a CAGR of 3.4% from 2025 to 2035. Antibiotic-free protocols in beef and sheep industries are propelling demand for natural taste enhancers.

Companies focus on leveraging native botanical extracts, such as lemon myrtle and eucalyptus, to create region-specific flavor profiles. Regulatory constraints on synthetic flavors have reinforced interest in clean-label palatants.
  • Lamb feedlots are integrating herbal palatants to reduce ration rejection post-weaning.
  • Ruminant premixes with essential oils are gaining shelf space in New South Wales cooperatives.
  • Herbal palatants are positioned as part of animal welfare-oriented branding in export industries.

Leading Phytobiotics Palatants Market Suppliers

Phytobiotics Palatants Market Analysis By Company

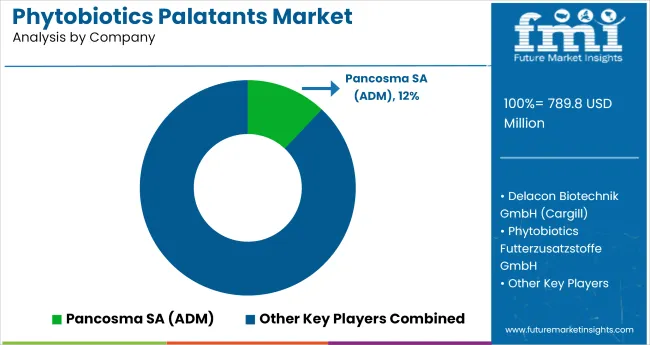
Leading Player - ADM (via Pancosma SA)Industry Share - 12%

In the industry, competitive advantage has been pursued through targeted botanical formulation, regional ingredient alignment, and vertical integration. Phytobiotics GmbH retains lead status by developing standardized actives with proven gut-health claims, distributed through livestock integrators and specialty feed mills across Europe and North America.

Cargill’s Delacon and ADM’s Pancosma focus on modular blends tailored for swine and poultry, leveraging captive sourcing of herbs and spices. Ayurvet’s India operations have enabled cost-efficient rollouts of functional palatants across ASEAN, aligned with native medicinal plant use.

Aromex, via Adisseo, supports flavor-masking systems in premium additives through co-development with local formulators. Regulatory frameworks differ sharply, with EU traceability rules shaping dose declarations and botanical origin labeling.

Recent Industry Developments

  • In January 2024, Phytobiotics Futterzusatzstoffe launched nine new “smart flavours” aimed at improving feed palatability for pigs, poultry, ruminants, and aquaculture. These heat-stable formulations support species-specific intake behavior and are designed to enhance feed efficiency and animal performance.
  • In 2025, the palatant market saw increased focus on sustainable, natural formulations. Companies adopted renewable raw materials and advanced encapsulation techniques to improve environmental compatibility while complying with stricter regulatory standards across livestock and pet food applications, reflecting shifting industry priorities toward clean-label, eco-friendly additive solutions.

Leading Players

  • Phytobiotics Futterzusatzstoffe GmbH
  • DelaconBiotechnik GmbH (Cargill)
  • Pancosma SA (ADM)
  • Ayurvet Limited
  • Aromex
  • Others

Report Scope

Report Attributes Details
Industry Size (2025) USD 789.8 million
Industry Value (2035) USD 1,192.9 million
Forecast CAGR (2025 to 2035) 4.2%
Base Year for Estimation 2024
Historical Period 2020 to 2024
Projections Period 2025 to 2035
Quantitative Units USD million for value and metric tons for volume
Source Type Segmentation Plant Extract-Based, Essential Oil-Based, Herbal Blend-Based, Fermentation-Derived, Encapsulated Botanicals
Animal Type Segmentation Pet (Dogs, Cats), Livestock (Swine, Poultry, Ruminants), Aquaculture
Functionality Segmentation Flavor Enhancement, Appetite Stimulation, Gut Health Synergy, Stress Reduction/Calming, Antimicrobial Support
Format Type Segmentation Powder, Liquid, Emulsified, Encapsulated
Sales Channel Segmentation Direct to Feed Manufacturers, Distributors/Resellers, Online Ingredient Marketplaces, In-house Use by Feed Integrators
End Use Application Segmentation Complete Feed, Premixes, Top-Dress Supplements, Treats & Chews (Pet), Starter Feeds (Livestock)
Regions Covered North America, Latin America, Europe, South Asia & Pacific, East Asia, Middle East & Africa
Countries Covered United States, Canada, Mexico, Brazil, Argentina, Germany, France, United Kingdom, Italy, Spain, Netherlands, China, India, Japan, South Korea, Australia, New Zealand, GCC Countries, South Africa
Key Players Phytobiotics Futterzusatzstoffe GmbH, De lacon Biotechnik GmbH (Cargill), Pancosma SA (ADM), Ayurvet Limited, Aromex, Others
Additional Attributes Dollar sales by source type, animal type, functionality, format type, and sales channel, increasing adoption of phytobiotics in animal feed, rising demand for natural and plant-based feed additives, expanding industry for specialty feed products, and regional variations in feed industry practices.

Key Segments

By Source Type:

Source-based segmentation includes Plant Extract-Based, Essential Oil-Based, Herbal Blend-Based, Fermentation-Derived, and Encapsulated Botanicals.

By Animal Type:

Animal categories include Pet (Dogs, Cats), Livestock (Swine, Poultry, Ruminants), and Aquaculture.

By Functionality:

Functional applications span Flavor Enhancement, Appetite Stimulation, Gut Health Synergy, Stress Reduction/Calming, and Antimicrobial Support.

By Format Type:

Format segmentation includes Powder, Liquid, Emulsified, and Encapsulated.

By Sales Channel:

Sales channels comprise Direct to Feed Manufacturers, Distributors/Resellers, Online Ingredient Marketplaces, and In-house Use by Feed Integrators.

By End Use Application:

End use includes Complete Feed, Premixes, Top-Dress Supplements, Treats & Chews (Pet), and Starter Feeds (Livestock).

By Region:

Regional segmentation includes North America, Latin America, Europe, South Asia & Pacific, East Asia, and Middle East & Africa.

Table of Content

  1. Executive Summary
    • Global Market Outlook
    • Demand-side Trends
    • Supply-side Trends
    • Technology Roadmap Analysis
    • Analysis and Recommendations
  2. Market Overview
    • Market Coverage/Taxonomy
    • Market Definition/Scope/Limitations
  3. Market Background
    • Market Dynamics
      • Drivers
      • Restraints
      • Opportunity
      • Trends
    • Scenario Forecast
      • Demand in Optimistic Scenario
      • Demand in Likely Scenario
      • Demand in Conservative Scenario
    • Opportunity Map Analysis
    • Product Life Cycle Analysis
    • Supply Chain Analysis
      • Supply Side Participants and their Roles
        • Producers
        • Mid-Level Participants (Traders/ Agents/ Brokers)
        • Wholesalers and Distributors
      • Value Added and Value Created at Node in the Supply Chain
      • List of Raw Material Suppliers
      • List of Existing and Potential Buyer’s
    • Investment Feasibility Matrix
    • Value Chain Analysis
      • Profit Margin Analysis
      • Wholesalers and Distributors
      • Retailers
    • PESTLE and Porter’s Analysis
    • Regulatory Landscape
      • By Key Regions
      • By Key Countries
    • Regional Parent Market Outlook
    • Production and Consumption Statistics
    • Import and Export Statistics
  4. Global Market Analysis 2020 to 2024 and Forecast, 2025 to 2035
    • Historical Market Size Value (USD Million) & Volume (Metric Tons) Analysis, 2020 to 2024
    • Current and Future Market Size Value (USD Million) & Volume (Metric Tons) Projections, 2025 to 2035
      • Y-o-Y Growth Trend Analysis
      • Absolute $ Opportunity Analysis
  5. Global Market Pricing Analysis 2020 to 2024 and Forecast 2025 to 2035
  6. Global Market Analysis 2020 to 2024 and Forecast 2025 to 2035, By Source Type
    • Introduction/Key Findings
    • Historical Market Size Value (USD Million) & Volume (Metric Tons) Analysis By Source Type, 2020 to 2024
    • Current and Future Market Size Value (USD Million) & Volume (Metric Tons) Analysis and Forecast By Source Type, 2025 to 2035
      • Plant Extract-Based
      • Essential Oil-Based
      • Herbal Blend-Based
      • Fermentation-Derived
      • Encapsulated Botanicals
    • Y-o-Y Growth Trend Analysis By Source Type, 2020 to 2024
    • Absolute $ Opportunity Analysis By Source Type, 2025 to 2035
  7. Global Market Analysis 2020 to 2024 and Forecast 2025 to 2035, By Animal Type
    • Introduction/Key Findings
    • Historical Market Size Value (USD Million) & Volume (Metric Tons) Analysis By Animal Type, 2020 to 2024
    • Current and Future Market Size Value (USD Million) & Volume (Metric Tons) Analysis and Forecast By Animal Type, 2025 to 2035
      • Pet
        • Dogs
        • Cats
      • Livestock
        • Swine
        • Poultry
        • Ruminants
    • Y-o-Y Growth Trend Analysis By Animal Type, 2020 to 2024
    • Absolute $ Opportunity Analysis By Animal Type, 2025 to 2035
  8. Global Market Analysis 2020 to 2024 and Forecast 2025 to 2035, By Functionality
    • Introduction/Key Findings
    • Historical Market Size Value (USD Million) & Volume (Metric Tons) Analysis By Functionality, 2020 to 2024
    • Current and Future Market Size Value (USD Million) & Volume (Metric Tons) Analysis and Forecast By Functionality, 2025 to 2035
      • Flavor Enhancement
      • Appetite Stimulation
      • Gut Health Synergy
      • Stress Reduction/Calming
      • Antimicrobial Support
    • Y-o-Y Growth Trend Analysis By Functionality, 2020 to 2024
    • Absolute $ Opportunity Analysis By Functionality, 2025 to 2035
  9. Global Market Analysis 2020 to 2024 and Forecast 2025 to 2035, By Format Type
    • Introduction/Key Findings
    • Historical Market Size Value (USD Million) & Volume (Metric Tons) Analysis By Format Type, 2020 to 2024
    • Current and Future Market Size Value (USD Million) & Volume (Metric Tons) Analysis and Forecast By Format Type, 2025 to 2035
      • Powder
      • Liquid
      • Emulsified
      • Encapsulated
    • Y-o-Y Growth Trend Analysis By Format Type, 2020 to 2024
    • Absolute $ Opportunity Analysis By Format Type, 2025 to 2035
  10. Global Market Analysis 2020 to 2024 and Forecast 2025 to 2035, By Sales Channel
    • Introduction/Key Findings
    • Historical Market Size Value (USD Million) & Volume (Metric Tons) Analysis By Sales Channel, 2020 to 2024
    • Current and Future Market Size Value (USD Million) & Volume (Metric Tons) Analysis and Forecast By Sales Channel, 2025 to 2035
      • Direct to Feed Manufacturers
      • Distributors/Resellers
      • Online Ingredient Marketplaces
      • In-house Use by Feed Integrators
    • Y-o-Y Growth Trend Analysis By Sales Channel, 2020 to 2024
    • Absolute $ Opportunity Analysis By Sales Channel, 2025 to 2035
  11. Global Market Analysis 2020 to 2024 and Forecast 2025 to 2035, By End Use Application
    • Introduction/Key Findings
    • Historical Market Size Value (USD Million) & Volume (Metric Tons) Analysis By End Use Application, 2020 to 2024
    • Current and Future Market Size Value (USD Million) & Volume (Metric Tons) Analysis and Forecast By End Use Application, 2025 to 2035
      • Complete Feed
      • Premixes
      • Top-Dress Supplements
      • Treats & Chews (Pet)
      • Starter Feeds (Livestock)
    • Y-o-Y Growth Trend Analysis By End Use Application, 2020 to 2024
    • Absolute $ Opportunity Analysis By End Use Application, 2025 to 2035
  12. Global Market Analysis 2020 to 2024 and Forecast 2025 to 2035, By Region
    • Introduction
    • Historical Market Size Value (USD Million) & Volume (Metric Tons) Analysis By Region, 2020 to 2024
    • Current Market Size Value (USD Million) & Volume (Metric Tons) Analysis and Forecast By Region, 2025 to 2035
      • North America
      • Latin America
      • Western Europe
      • Eastern Europe
      • East Asia
      • South Asia & Pacific
      • Middle East and Africa
    • Market Attractiveness Analysis By Region
  13. North America Market Analysis 2020 to 2024 and Forecast 2025 to 2035, By Country
    • Historical Market Size Value (USD Million) & Volume (Metric Tons) Trend Analysis By Market Taxonomy, 2020 to 2024
    • Market Size Value (USD Million) & Volume (Metric Tons) Forecast By Market Taxonomy, 2025 to 2035
      • By Country
        • USA
        • Canada
        • Mexico
      • By Source Type
      • By Animal Type
      • By Functionality
      • By Format Type
      • By Sales Channel
      • By End Use Application
    • Market Attractiveness Analysis
      • By Country
      • By Source Type
      • By Animal Type
      • By Functionality
      • By Format Type
      • By Sales Channel
      • By End Use Application
    • Key Takeaways
  14. Latin America Market Analysis 2020 to 2024 and Forecast 2025 to 2035, By Country
    • Historical Market Size Value (USD Million) & Volume (Metric Tons) Trend Analysis By Market Taxonomy, 2020 to 2024
    • Market Size Value (USD Million) & Volume (Metric Tons) Forecast By Market Taxonomy, 2025 to 2035
      • By Country
        • Brazil
        • Argentina
        • Rest of LATAM
      • By Source Type
      • By Animal Type
      • By Functionality
      • By Format Type
      • By Sales Channel
      • By End Use Application
    • Market Attractiveness Analysis
      • By Country
      • By Source Type
      • By Animal Type
      • By Functionality
      • By Format Type
      • By Sales Channel
      • By End Use Application
    • Key Takeaways
  15. Western Europe Market Analysis 2020 to 2024 and Forecast 2025 to 2035, By Country
    • Historical Market Size Value (USD Million) & Volume (Metric Tons) Trend Analysis By Market Taxonomy, 2020 to 2024
    • Market Size Value (USD Million) & Volume (Metric Tons) Forecast By Market Taxonomy, 2025 to 2035
      • By Country
        • Germany
        • Italy
        • France
        • UK
        • Spain
        • BENELUX
        • Nordic
        • Rest of W.Europe
      • By Source Type
      • By Animal Type
      • By Functionality
      • By Format Type
      • By Sales Channel
      • By End Use Application
    • Market Attractiveness Analysis
      • By Country
      • By Source Type
      • By Animal Type
      • By Functionality
      • By Format Type
      • By Sales Channel
      • By End Use Application
    • Key Takeaways
  16. Eastern Europe Market Analysis 2020 to 2024 and Forecast 2025 to 2035, By Country
    • Historical Market Size Value (USD Million) & Volume (Metric Tons) Trend Analysis By Market Taxonomy, 2020 to 2024
    • Market Size Value (USD Million) & Volume (Metric Tons) Forecast By Market Taxonomy, 2025 to 2035
      • By Country
        • Russia
        • Hungary
        • Poland
        • Balkan & Baltics
        • Rest of E. Europe
      • By Source Type
      • By Animal Type
      • By Functionality
      • By Format Type
      • By Sales Channel
      • By End Use Application
    • Market Attractiveness Analysis
      • By Country
      • By Source Type
      • By Animal Type
      • By Functionality
      • By Format Type
      • By Sales Channel
      • By End Use Application
    • Key Takeaways
  17. East Asia Market Analysis 2020 to 2024 and Forecast 2025 to 2035, By Country
    • Historical Market Size Value (USD Million) & Volume (Metric Tons) Trend Analysis By Market Taxonomy, 2020 to 2024
    • Market Size Value (USD Million) & Volume (Metric Tons) Forecast By Market Taxonomy, 2025 to 2035
      • By Country
        • China
        • Japan
        • South Korea
      • By Source Type
      • By Animal Type
      • By Functionality
      • By Format Type
      • By Sales Channel
      • By End Use Application
    • Market Attractiveness Analysis
      • By Country
      • By Source Type
      • By Animal Type
      • By Functionality
      • By Format Type
      • By Sales Channel
      • By End Use Application
    • Key Takeaways
  18. South Asia & Pacific Market Analysis 2020 to 2024 and Forecast 2025 to 2035, By Country
    • Historical Market Size Value (USD Million) & Volume (Metric Tons) Trend Analysis By Market Taxonomy, 2020 to 2024
    • Market Size Value (USD Million) & Volume (Metric Tons) Forecast By Market Taxonomy, 2025 to 2035
      • By Country
        • India
        • Australia & New Zealand
        • ASEAN
        • Rest of SAP
      • By Source Type
      • By Animal Type
      • By Functionality
      • By Format Type
      • By Sales Channel
      • By End Use Application
    • Market Attractiveness Analysis
      • By Country
      • By Source Type
      • By Animal Type
      • By Functionality
      • By Format Type
      • By Sales Channel
      • By End Use Application
    • Key Takeaways
  19. Middle East and Africa Market Analysis 2020 to 2024 and Forecast 2025 to 2035, By Country
    • Historical Market Size Value (USD Million) & Volume (Metric Tons) Trend Analysis By Market Taxonomy, 2020 to 2024
    • Market Size Value (USD Million) & Volume (Metric Tons) Forecast By Market Taxonomy, 2025 to 2035
      • By Country
        • GCC Countries
        • Northern Africa
        • South Africa
        • Turkiye
        • Rest of MEA
      • By Source Type
      • By Animal Type
      • By Functionality
      • By Format Type
      • By Sales Channel
      • By End Use Application
    • Market Attractiveness Analysis
      • By Country
      • By Source Type
      • By Animal Type
      • By Functionality
      • By Format Type
      • By Sales Channel
      • By End Use Application
    • Key Takeaways
  20. Key Countries Market Analysis
    • USA
      • Pricing Analysis
      • Market Share Analysis, 2024
        • By Source Type
        • By Animal Type
        • By Functionality
        • By Format Type
        • By Sales Channel
        • By End Use Application
    • Canada
      • Pricing Analysis
      • Market Share Analysis, 2024
        • By Source Type
        • By Animal Type
        • By Functionality
        • By Format Type
        • By Sales Channel
        • By End Use Application
    • Brazil
      • Pricing Analysis
      • Market Share Analysis, 2024
        • By Source Type
        • By Animal Type
        • By Functionality
        • By Format Type
        • By Sales Channel
        • By End Use Application
    • Mexico
      • Pricing Analysis
      • Market Share Analysis, 2024
        • By Source Type
        • By Animal Type
        • By Functionality
        • By Format Type
        • By Sales Channel
        • By End Use Application
    • Argentina
      • Pricing Analysis
      • Market Share Analysis, 2024
        • By Source Type
        • By Animal Type
        • By Functionality
        • By Format Type
        • By Sales Channel
        • By End Use Application
  21. Market Structure Analysis
    • Competition Dashboard
    • Competition Benchmarking
    • Market Share Analysis of Top Players
      • By Regional
      • By Source Type
      • By Animal Type
      • By Functionality
      • By Format Type
      • By Sales Channel
      • By End Use Application
  22. Competition Analysis
    • Competition Deep Dive
      • Phytobiotics Futterzusatzstoffe GmbH
        • Overview
        • Product Portfolio
        • Profitability by Market Segments (Product/Age /Sales Channel/Region)
        • Sales Footprint
        • Strategy Overview
          • Marketing Strategy
          • Product Strategy
          • Channel Strategy
      • Delacon Biotechnik GmbH (Cargill)
        • Overview
        • Product Portfolio
        • Profitability by Market Segments (Product/Age /Sales Channel/Region)
        • Sales Footprint
        • Strategy Overview
          • Marketing Strategy
          • Product Strategy
          • Channel Strategy
      • Pancosma SA (ADM)
        • Overview
        • Product Portfolio
        • Profitability by Market Segments (Product/Age /Sales Channel/Region)
        • Sales Footprint
        • Strategy Overview
          • Marketing Strategy
          • Product Strategy
          • Channel Strategy
      • Ayurvet Limited
        • Overview
        • Product Portfolio
        • Profitability by Market Segments (Product/Age /Sales Channel/Region)
        • Sales Footprint
        • Strategy Overview
          • Marketing Strategy
          • Product Strategy
          • Channel Strategy
      • Aromex
        • Overview
        • Product Portfolio
        • Profitability by Market Segments (Product/Age /Sales Channel/Region)
        • Sales Footprint
        • Strategy Overview
          • Marketing Strategy
          • Product Strategy
          • Channel Strategy
  23. Assumptions & Acronyms Used
  24. Research Methodology

List of Tables

  • Table 1: Global Market Value (USD Million) Forecast by Region, 2020-2035
  • Table 2: Global Market Volume (Metric Tons) Forecast by Region, 2020-2035
  • Table 3: Global Market Value (USD Million) Forecast by Source Type, 2020-2035
  • Table 4: Global Market Volume (Metric Tons) Forecast by Source Type, 2020-2035
  • Table 5: Global Market Value (USD Million) Forecast by Animal Type, 2020-2035
  • Table 6: Global Market Volume (Metric Tons) Forecast by Animal Type, 2020-2035
  • Table 7: Global Market Value (USD Million) Forecast by Functionality, 2020-2035
  • Table 8: Global Market Volume (Metric Tons) Forecast by Functionality, 2020-2035
  • Table 9: Global Market Value (USD Million) Forecast by Format Type, 2020-2035
  • Table 10: Global Market Volume (Metric Tons) Forecast by Format Type, 2020-2035
  • Table 11: Global Market Value (USD Million) Forecast by Sales Channel, 2020-2035
  • Table 12: Global Market Volume (Metric Tons) Forecast by Sales Channel, 2020-2035
  • Table 13: Global Market Value (USD Million) Forecast by End Use Application, 2020-2035
  • Table 14: Global Market Volume (Metric Tons) Forecast by End Use Application, 2020-2035
  • Table 15: North America Market Value (USD Million) Forecast by Country, 2020-2035
  • Table 16: North America Market Volume (Metric Tons) Forecast by Country, 2020-2035
  • Table 17: North America Market Value (USD Million) Forecast by Source Type, 2020-2035
  • Table 18: North America Market Volume (Metric Tons) Forecast by Source Type, 2020-2035
  • Table 19: North America Market Value (USD Million) Forecast by Animal Type, 2020-2035
  • Table 20: North America Market Volume (Metric Tons) Forecast by Animal Type, 2020-2035
  • Table 21: North America Market Value (USD Million) Forecast by Functionality, 2020-2035
  • Table 22: North America Market Volume (Metric Tons) Forecast by Functionality, 2020-2035
  • Table 23: North America Market Value (USD Million) Forecast by Format Type, 2020-2035
  • Table 24: North America Market Volume (Metric Tons) Forecast by Format Type, 2020-2035
  • Table 25: North America Market Value (USD Million) Forecast by Sales Channel, 2020-2035
  • Table 26: North America Market Volume (Metric Tons) Forecast by Sales Channel, 2020-2035
  • Table 27: North America Market Value (USD Million) Forecast by End Use Application, 2020-2035
  • Table 28: North America Market Volume (Metric Tons) Forecast by End Use Application, 2020-2035
  • Table 29: Latin America Market Value (USD Million) Forecast by Country, 2020-2035
  • Table 30: Latin America Market Volume (Metric Tons) Forecast by Country, 2020-2035
  • Table 31: Latin America Market Value (USD Million) Forecast by Source Type, 2020-2035
  • Table 32: Latin America Market Volume (Metric Tons) Forecast by Source Type, 2020-2035
  • Table 33: Latin America Market Value (USD Million) Forecast by Animal Type, 2020-2035
  • Table 34: Latin America Market Volume (Metric Tons) Forecast by Animal Type, 2020-2035
  • Table 35: Latin America Market Value (USD Million) Forecast by Functionality, 2020-2035
  • Table 36: Latin America Market Volume (Metric Tons) Forecast by Functionality, 2020-2035
  • Table 37: Latin America Market Value (USD Million) Forecast by Format Type, 2020-2035
  • Table 38: Latin America Market Volume (Metric Tons) Forecast by Format Type, 2020-2035
  • Table 39: Latin America Market Value (USD Million) Forecast by Sales Channel, 2020-2035
  • Table 40: Latin America Market Volume (Metric Tons) Forecast by Sales Channel, 2020-2035
  • Table 41: Latin America Market Value (USD Million) Forecast by End Use Application, 2020-2035
  • Table 42: Latin America Market Volume (Metric Tons) Forecast by End Use Application, 2020-2035
  • Table 43: Western Europe Market Value (USD Million) Forecast by Country, 2020-2035
  • Table 44: Western Europe Market Volume (Metric Tons) Forecast by Country, 2020-2035
  • Table 45: Western Europe Market Value (USD Million) Forecast by Source Type, 2020-2035
  • Table 46: Western Europe Market Volume (Metric Tons) Forecast by Source Type, 2020-2035
  • Table 47: Western Europe Market Value (USD Million) Forecast by Animal Type, 2020-2035
  • Table 48: Western Europe Market Volume (Metric Tons) Forecast by Animal Type, 2020-2035
  • Table 49: Western Europe Market Value (USD Million) Forecast by Functionality, 2020-2035
  • Table 50: Western Europe Market Volume (Metric Tons) Forecast by Functionality, 2020-2035
  • Table 51: Western Europe Market Value (USD Million) Forecast by Format Type, 2020-2035
  • Table 52: Western Europe Market Volume (Metric Tons) Forecast by Format Type, 2020-2035
  • Table 53: Western Europe Market Value (USD Million) Forecast by Sales Channel, 2020-2035
  • Table 54: Western Europe Market Volume (Metric Tons) Forecast by Sales Channel, 2020-2035
  • Table 55: Western Europe Market Value (USD Million) Forecast by End Use Application, 2020-2035
  • Table 56: Western Europe Market Volume (Metric Tons) Forecast by End Use Application, 2020-2035
  • Table 57: Eastern Europe Market Value (USD Million) Forecast by Country, 2020-2035
  • Table 58: Eastern Europe Market Volume (Metric Tons) Forecast by Country, 2020-2035
  • Table 59: Eastern Europe Market Value (USD Million) Forecast by Source Type, 2020-2035
  • Table 60: Eastern Europe Market Volume (Metric Tons) Forecast by Source Type, 2020-2035
  • Table 61: Eastern Europe Market Value (USD Million) Forecast by Animal Type, 2020-2035
  • Table 62: Eastern Europe Market Volume (Metric Tons) Forecast by Animal Type, 2020-2035
  • Table 63: Eastern Europe Market Value (USD Million) Forecast by Functionality, 2020-2035
  • Table 64: Eastern Europe Market Volume (Metric Tons) Forecast by Functionality, 2020-2035
  • Table 65: Eastern Europe Market Value (USD Million) Forecast by Format Type, 2020-2035
  • Table 66: Eastern Europe Market Volume (Metric Tons) Forecast by Format Type, 2020-2035
  • Table 67: Eastern Europe Market Value (USD Million) Forecast by Sales Channel, 2020-2035
  • Table 68: Eastern Europe Market Volume (Metric Tons) Forecast by Sales Channel, 2020-2035
  • Table 69: Eastern Europe Market Value (USD Million) Forecast by End Use Application, 2020-2035
  • Table 70: Eastern Europe Market Volume (Metric Tons) Forecast by End Use Application, 2020-2035
  • Table 71: East Asia Market Value (USD Million) Forecast by Country, 2020-2035
  • Table 72: East Asia Market Volume (Metric Tons) Forecast by Country, 2020-2035
  • Table 73: East Asia Market Value (USD Million) Forecast by Source Type, 2020-2035
  • Table 74: East Asia Market Volume (Metric Tons) Forecast by Source Type, 2020-2035
  • Table 75: East Asia Market Value (USD Million) Forecast by Animal Type, 2020-2035
  • Table 76: East Asia Market Volume (Metric Tons) Forecast by Animal Type, 2020-2035
  • Table 77: East Asia Market Value (USD Million) Forecast by Functionality, 2020-2035
  • Table 78: East Asia Market Volume (Metric Tons) Forecast by Functionality, 2020-2035
  • Table 79: East Asia Market Value (USD Million) Forecast by Format Type, 2020-2035
  • Table 80: East Asia Market Volume (Metric Tons) Forecast by Format Type, 2020-2035
  • Table 81: East Asia Market Value (USD Million) Forecast by Sales Channel, 2020-2035
  • Table 82: East Asia Market Volume (Metric Tons) Forecast by Sales Channel, 2020-2035
  • Table 83: East Asia Market Value (USD Million) Forecast by End Use Application, 2020-2035
  • Table 84: East Asia Market Volume (Metric Tons) Forecast by End Use Application, 2020-2035
  • Table 85: South Asia & Pacific Market Value (USD Million) Forecast by Country, 2020-2035
  • Table 86: South Asia & Pacific Market Volume (Metric Tons) Forecast by Country, 2020-2035
  • Table 87: South Asia & Pacific Market Value (USD Million) Forecast by Source Type, 2020-2035
  • Table 88: South Asia & Pacific Market Volume (Metric Tons) Forecast by Source Type, 2020-2035
  • Table 89: South Asia & Pacific Market Value (USD Million) Forecast by Animal Type, 2020-2035
  • Table 90: South Asia & Pacific Market Volume (Metric Tons) Forecast by Animal Type, 2020-2035
  • Table 91: South Asia & Pacific Market Value (USD Million) Forecast by Functionality, 2020-2035
  • Table 92: South Asia & Pacific Market Volume (Metric Tons) Forecast by Functionality, 2020-2035
  • Table 93: South Asia & Pacific Market Value (USD Million) Forecast by Format Type, 2020-2035
  • Table 94: South Asia & Pacific Market Volume (Metric Tons) Forecast by Format Type, 2020-2035
  • Table 95: South Asia & Pacific Market Value (USD Million) Forecast by Sales Channel, 2020-2035
  • Table 96: South Asia & Pacific Market Volume (Metric Tons) Forecast by Sales Channel, 2020-2035
  • Table 97: South Asia & Pacific Market Value (USD Million) Forecast by End Use Application, 2020-2035
  • Table 98: South Asia & Pacific Market Volume (Metric Tons) Forecast by End Use Application, 2020-2035
  • Table 99: Middle East and Africa Market Value (USD Million) Forecast by Country, 2020-2035
  • Table 100: Middle East and Africa Market Volume (Metric Tons) Forecast by Country, 2020-2035
  • Table 101: Middle East and Africa Market Value (USD Million) Forecast by Source Type, 2020-2035
  • Table 102: Middle East and Africa Market Volume (Metric Tons) Forecast by Source Type, 2020-2035
  • Table 103: Middle East and Africa Market Value (USD Million) Forecast by Animal Type, 2020-2035
  • Table 104: Middle East and Africa Market Volume (Metric Tons) Forecast by Animal Type, 2020-2035
  • Table 105: Middle East and Africa Market Value (USD Million) Forecast by Functionality, 2020-2035
  • Table 106: Middle East and Africa Market Volume (Metric Tons) Forecast by Functionality, 2020-2035
  • Table 107: Middle East and Africa Market Value (USD Million) Forecast by Format Type, 2020-2035
  • Table 108: Middle East and Africa Market Volume (Metric Tons) Forecast by Format Type, 2020-2035
  • Table 109: Middle East and Africa Market Value (USD Million) Forecast by Sales Channel, 2020-2035
  • Table 110: Middle East and Africa Market Volume (Metric Tons) Forecast by Sales Channel, 2020-2035
  • Table 111: Middle East and Africa Market Value (USD Million) Forecast by End Use Application, 2020-2035
  • Table 112: Middle East and Africa Market Volume (Metric Tons) Forecast by End Use Application, 2020-2035

List of Figures

  • Figure 1: Global Market Volume (Metric Tons) Forecast 2020-2035
  • Figure 2: Global Market Pricing Analysis
  • Figure 3: Global Market Value (USD Million) Forecast 2020-2035
  • Figure 4: Global Market Value Share and BPS Analysis by Source Type, 2025 and 2035
  • Figure 5: Global Market Y-o-Y Growth Comparison by Source Type, 2025-2035
  • Figure 6: Global Market Attractiveness Analysis by Source Type
  • Figure 7: Global Market Value Share and BPS Analysis by Animal Type, 2025 and 2035
  • Figure 8: Global Market Y-o-Y Growth Comparison by Animal Type, 2025-2035
  • Figure 9: Global Market Attractiveness Analysis by Animal Type
  • Figure 10: Global Market Value Share and BPS Analysis by Functionality, 2025 and 2035
  • Figure 11: Global Market Y-o-Y Growth Comparison by Functionality, 2025-2035
  • Figure 12: Global Market Attractiveness Analysis by Functionality
  • Figure 13: Global Market Value Share and BPS Analysis by Format Type, 2025 and 2035
  • Figure 14: Global Market Y-o-Y Growth Comparison by Format Type, 2025-2035
  • Figure 15: Global Market Attractiveness Analysis by Format Type
  • Figure 16: Global Market Value Share and BPS Analysis by Sales Channel, 2025 and 2035
  • Figure 17: Global Market Y-o-Y Growth Comparison by Sales Channel, 2025-2035
  • Figure 18: Global Market Attractiveness Analysis by Sales Channel
  • Figure 19: Global Market Value Share and BPS Analysis by End Use Application, 2025 and 2035
  • Figure 20: Global Market Y-o-Y Growth Comparison by End Use Application, 2025-2035
  • Figure 21: Global Market Attractiveness Analysis by End Use Application
  • Figure 22: Global Market Value (USD Million) Share and BPS Analysis by Region, 2025 and 2035
  • Figure 23: Global Market Y-o-Y Growth Comparison by Region, 2025-2035
  • Figure 24: Global Market Attractiveness Analysis by Region
  • Figure 25: North America Market Incremental $ Opportunity, 2025-2035
  • Figure 26: Latin America Market Incremental $ Opportunity, 2025-2035
  • Figure 27: Western Europe Market Incremental $ Opportunity, 2025-2035
  • Figure 28: Eastern Europe Market Incremental $ Opportunity, 2025-2035
  • Figure 29: East Asia Market Incremental $ Opportunity, 2025-2035
  • Figure 30: South Asia & Pacific Market Incremental $ Opportunity, 2025-2035
  • Figure 31: Middle East and Africa Market Incremental $ Opportunity, 2025-2035
  • Figure 32: North America Market Value Share and BPS Analysis by Country, 2025 and 2035
  • Figure 33: North America Market Value Share and BPS Analysis by Source Type, 2025 and 2035
  • Figure 34: North America Market Y-o-Y Growth Comparison by Source Type, 2025-2035
  • Figure 35: North America Market Attractiveness Analysis by Source Type
  • Figure 36: North America Market Value Share and BPS Analysis by Animal Type, 2025 and 2035
  • Figure 37: North America Market Y-o-Y Growth Comparison by Animal Type, 2025-2035
  • Figure 38: North America Market Attractiveness Analysis by Animal Type
  • Figure 39: North America Market Value Share and BPS Analysis by Functionality, 2025 and 2035
  • Figure 40: North America Market Y-o-Y Growth Comparison by Functionality, 2025-2035
  • Figure 41: North America Market Attractiveness Analysis by Functionality
  • Figure 42: North America Market Value Share and BPS Analysis by Format Type, 2025 and 2035
  • Figure 43: North America Market Y-o-Y Growth Comparison by Format Type, 2025-2035
  • Figure 44: North America Market Attractiveness Analysis by Format Type
  • Figure 45: North America Market Value Share and BPS Analysis by Sales Channel, 2025 and 2035
  • Figure 46: North America Market Y-o-Y Growth Comparison by Sales Channel, 2025-2035
  • Figure 47: North America Market Attractiveness Analysis by Sales Channel
  • Figure 48: North America Market Value Share and BPS Analysis by End Use Application, 2025 and 2035
  • Figure 49: North America Market Y-o-Y Growth Comparison by End Use Application, 2025-2035
  • Figure 50: North America Market Attractiveness Analysis by End Use Application
  • Figure 51: Latin America Market Value Share and BPS Analysis by Country, 2025 and 2035
  • Figure 52: Latin America Market Value Share and BPS Analysis by Source Type, 2025 and 2035
  • Figure 53: Latin America Market Y-o-Y Growth Comparison by Source Type, 2025-2035
  • Figure 54: Latin America Market Attractiveness Analysis by Source Type
  • Figure 55: Latin America Market Value Share and BPS Analysis by Animal Type, 2025 and 2035
  • Figure 56: Latin America Market Y-o-Y Growth Comparison by Animal Type, 2025-2035
  • Figure 57: Latin America Market Attractiveness Analysis by Animal Type
  • Figure 58: Latin America Market Value Share and BPS Analysis by Functionality, 2025 and 2035
  • Figure 59: Latin America Market Y-o-Y Growth Comparison by Functionality, 2025-2035
  • Figure 60: Latin America Market Attractiveness Analysis by Functionality
  • Figure 61: Latin America Market Value Share and BPS Analysis by Format Type, 2025 and 2035
  • Figure 62: Latin America Market Y-o-Y Growth Comparison by Format Type, 2025-2035
  • Figure 63: Latin America Market Attractiveness Analysis by Format Type
  • Figure 64: Latin America Market Value Share and BPS Analysis by Sales Channel, 2025 and 2035
  • Figure 65: Latin America Market Y-o-Y Growth Comparison by Sales Channel, 2025-2035
  • Figure 66: Latin America Market Attractiveness Analysis by Sales Channel
  • Figure 67: Latin America Market Value Share and BPS Analysis by End Use Application, 2025 and 2035
  • Figure 68: Latin America Market Y-o-Y Growth Comparison by End Use Application, 2025-2035
  • Figure 69: Latin America Market Attractiveness Analysis by End Use Application
  • Figure 70: Western Europe Market Value Share and BPS Analysis by Country, 2025 and 2035
  • Figure 71: Western Europe Market Value Share and BPS Analysis by Source Type, 2025 and 2035
  • Figure 72: Western Europe Market Y-o-Y Growth Comparison by Source Type, 2025-2035
  • Figure 73: Western Europe Market Attractiveness Analysis by Source Type
  • Figure 74: Western Europe Market Value Share and BPS Analysis by Animal Type, 2025 and 2035
  • Figure 75: Western Europe Market Y-o-Y Growth Comparison by Animal Type, 2025-2035
  • Figure 76: Western Europe Market Attractiveness Analysis by Animal Type
  • Figure 77: Western Europe Market Value Share and BPS Analysis by Functionality, 2025 and 2035
  • Figure 78: Western Europe Market Y-o-Y Growth Comparison by Functionality, 2025-2035
  • Figure 79: Western Europe Market Attractiveness Analysis by Functionality
  • Figure 80: Western Europe Market Value Share and BPS Analysis by Format Type, 2025 and 2035
  • Figure 81: Western Europe Market Y-o-Y Growth Comparison by Format Type, 2025-2035
  • Figure 82: Western Europe Market Attractiveness Analysis by Format Type
  • Figure 83: Western Europe Market Value Share and BPS Analysis by Sales Channel, 2025 and 2035
  • Figure 84: Western Europe Market Y-o-Y Growth Comparison by Sales Channel, 2025-2035
  • Figure 85: Western Europe Market Attractiveness Analysis by Sales Channel
  • Figure 86: Western Europe Market Value Share and BPS Analysis by End Use Application, 2025 and 2035
  • Figure 87: Western Europe Market Y-o-Y Growth Comparison by End Use Application, 2025-2035
  • Figure 88: Western Europe Market Attractiveness Analysis by End Use Application
  • Figure 89: Eastern Europe Market Value Share and BPS Analysis by Country, 2025 and 2035
  • Figure 90: Eastern Europe Market Value Share and BPS Analysis by Source Type, 2025 and 2035
  • Figure 91: Eastern Europe Market Y-o-Y Growth Comparison by Source Type, 2025-2035
  • Figure 92: Eastern Europe Market Attractiveness Analysis by Source Type
  • Figure 93: Eastern Europe Market Value Share and BPS Analysis by Animal Type, 2025 and 2035
  • Figure 94: Eastern Europe Market Y-o-Y Growth Comparison by Animal Type, 2025-2035
  • Figure 95: Eastern Europe Market Attractiveness Analysis by Animal Type
  • Figure 96: Eastern Europe Market Value Share and BPS Analysis by Functionality, 2025 and 2035
  • Figure 97: Eastern Europe Market Y-o-Y Growth Comparison by Functionality, 2025-2035
  • Figure 98: Eastern Europe Market Attractiveness Analysis by Functionality
  • Figure 99: Eastern Europe Market Value Share and BPS Analysis by Format Type, 2025 and 2035
  • Figure 100: Eastern Europe Market Attractiveness Analysis by Format Type
  • Figure 101: Eastern Europe Market Value Share and BPS Analysis by Sales Channel, 2025 and 2035
  • Figure 102: Eastern Europe Market Y-o-Y Growth Comparison by Sales Channel, 2025-2035
  • Figure 103: Eastern Europe Market Attractiveness Analysis by Sales Channel
  • Figure 104: Eastern Europe Market Value Share and BPS Analysis by End Use Application, 2025 and 2035
  • Figure 105: Eastern Europe Market Y-o-Y Growth Comparison by End Use Application, 2025-2035
  • Figure 106: Eastern Europe Market Attractiveness Analysis by End Use Application
  • Figure 107: East Asia Market Value Share and BPS Analysis by Country, 2025 and 2035
  • Figure 108: East Asia Market Value Share and BPS Analysis by Source Type, 2025 and 2035
  • Figure 109: East Asia Market Y-o-Y Growth Comparison by Source Type, 2025-2035
  • Figure 110: East Asia Market Attractiveness Analysis by Source Type
  • Figure 111: East Asia Market Value Share and BPS Analysis by Animal Type, 2025 and 2035
  • Figure 112: East Asia Market Y-o-Y Growth Comparison by Animal Type, 2025-2035
  • Figure 113: East Asia Market Attractiveness Analysis by Animal Type
  • Figure 114: East Asia Market Value Share and BPS Analysis by Functionality, 2025 and 2035
  • Figure 115: East Asia Market Y-o-Y Growth Comparison by Functionality, 2025-2035
  • Figure 116: East Asia Market Attractiveness Analysis by Functionality
  • Figure 117: East Asia Market Value Share and BPS Analysis by Format Type, 2025 and 2035
  • Figure 118: East Asia Market Y-o-Y Growth Comparison by Format Type, 2025-2035
  • Figure 119: East Asia Market Attractiveness Analysis by Format Type
  • Figure 120: East Asia Market Value Share and BPS Analysis by Sales Channel, 2025 and 2035
  • Figure 121: East Asia Market Y-o-Y Growth Comparison by Sales Channel, 2025-2035
  • Figure 122: East Asia Market Attractiveness Analysis by Sales Channel
  • Figure 123: East Asia Market Value Share and BPS Analysis by End Use Application, 2025 and 2035
  • Figure 124: East Asia Market Y-o-Y Growth Comparison by End Use Application, 2025-2035
  • Figure 125: East Asia Market Attractiveness Analysis by End Use Application
  • Figure 126: South Asia & Pacific Market Value Share and BPS Analysis by Country, 2025 and 2035
  • Figure 127: South Asia & Pacific Market Value Share and BPS Analysis by Source Type, 2025 and 2035
  • Figure 128: South Asia & Pacific Market Y-o-Y Growth Comparison by Source Type, 2025-2035
  • Figure 129: South Asia & Pacific Market Attractiveness Analysis by Source Type
  • Figure 130: South Asia & Pacific Market Value Share and BPS Analysis by Animal Type, 2025 and 2035
  • Figure 131: South Asia & Pacific Market Y-o-Y Growth Comparison by Animal Type, 2025-2035
  • Figure 132: South Asia & Pacific Market Attractiveness Analysis by Animal Type
  • Figure 133: South Asia & Pacific Market Value Share and BPS Analysis by Functionality, 2025 and 2035
  • Figure 134: South Asia & Pacific Market Y-o-Y Growth Comparison by Functionality, 2025-2035
  • Figure 135: South Asia & Pacific Market Attractiveness Analysis by Functionality
  • Figure 136: South Asia & Pacific Market Value Share and BPS Analysis by Format Type, 2025 and 2035
  • Figure 137: South Asia & Pacific Market Y-o-Y Growth Comparison by Format Type, 2025-2035
  • Figure 138: South Asia & Pacific Market Attractiveness Analysis by Format Type
  • Figure 139: South Asia & Pacific Market Value Share and BPS Analysis by Sales Channel, 2025 and 2035
  • Figure 140: South Asia & Pacific Market Y-o-Y Growth Comparison by Sales Channel, 2025-2035
  • Figure 141: South Asia & Pacific Market Attractiveness Analysis by Sales Channel
  • Figure 142: South Asia & Pacific Market Value Share and BPS Analysis by End Use Application, 2025 and 2035
  • Figure 143: South Asia & Pacific Market Y-o-Y Growth Comparison by End Use Application, 2025-2035
  • Figure 144: South Asia & Pacific Market Attractiveness Analysis by End Use Application
  • Figure 145: Middle East and Africa Market Value Share and BPS Analysis by Country, 2025 and 2035
  • Figure 146: Middle East and Africa Market Value Share and BPS Analysis by Source Type, 2025 and 2035
  • Figure 147: Middle East and Africa Market Y-o-Y Growth Comparison by Source Type, 2025-2035
  • Figure 148: Middle East and Africa Market Attractiveness Analysis by Source Type
  • Figure 149: Middle East and Africa Market Value Share and BPS Analysis by Animal Type, 2025 and 2035
  • Figure 150: Middle East and Africa Market Y-o-Y Growth Comparison by Animal Type, 2025-2035
  • Figure 151: Middle East and Africa Market Attractiveness Analysis by Animal Type
  • Figure 152: Middle East and Africa Market Value Share and BPS Analysis by Functionality, 2025 and 2035
  • Figure 153: Middle East and Africa Market Y-o-Y Growth Comparison by Functionality, 2025-2035
  • Figure 154: Middle East and Africa Market Attractiveness Analysis by Functionality
  • Figure 155: Middle East and Africa Market Value Share and BPS Analysis by Format Type, 2025 and 2035
  • Figure 156: Middle East and Africa Market Y-o-Y Growth Comparison by Format Type, 2025-2035
  • Figure 157: Middle East and Africa Market Attractiveness Analysis by Format Type
  • Figure 158: Middle East and Africa Market Value Share and BPS Analysis by Sales Channel, 2025 and 2035
  • Figure 159: Middle East and Africa Market Y-o-Y Growth Comparison by Sales Channel, 2025-2035
  • Figure 160: Middle East and Africa Market Attractiveness Analysis by Sales Channel
  • Figure 161: Middle East and Africa Market Value Share and BPS Analysis by End Use Application, 2025 and 2035
  • Figure 162: Middle East and Africa Market Y-o-Y Growth Comparison by End Use Application, 2025-2035
  • Figure 163: Middle East and Africa Market Attractiveness Analysis by End Use Application
  • Figure 164: Global Market - Tier Structure Analysis
  • Figure 165: Global Market - Company Share Analysis

Frequently Asked Questions

What is the projected size of the phytobiotics palatants market in 2025?

The projected size of the industry in 2025 is USD 789.8 million.

What will be the value of the phytobiotics palatants market in 2035 and its CAGR?

The value of the industry in 2035 is USD 1,192.9 million, with a CAGR of 4.2%.

Which format leads the phytobiotics palatants market?

The powder format leads the industry with a 48% industry share.

Which country is projected to have the highest CAGR in the phytobiotics palatants market?

India is projected to have the highest CAGR in the industry with a growth rate of 3.6% from 2025 to 2035.

Who is the leading company in the phytobiotics palatants market?

The leading company in the industry is ADM, with a 12% industry share.

Explore Similar Insights

Future Market Insights

Phytobiotics Palatants Market