This site uses cookies, including third-party cookies, that help us to provide and improve our services.

Privacy Policy
- Global Locations -
Headquarters
Future Market Insights, Inc.
Christiana Corporate, 200 Continental Drive, Suite 401, Newark, Delaware - 19713, United States
T: +1-845-579-5705
MEA
Market Access DMCC

1602-6 Jumeirah Bay X2 Tower, Plot No: JLT-PH2-X2A,

Jumeirah Lakes Towers, Dubai,

United Arab Emirates

Americas
Future Market Insights
616 Corporate Way, Suite 2-9018,
Valley Cottage, NY 10989,
United States
T: +1-347-918-3531
Europe
Future Market Insights
3rd Floor, 207 Regent Street,
London W1B 3HH
United Kingdom
T: + 44 (0) 20 8123 9659
D: +44 (0) 20 3287 4268
APAC
Future Market Insights
Office No. 401-A, 4th Floor,
VANTAGE 9, S.No. 36/1/1,
Baner, Pune 411045 India

Plywood Market

The Marine Sector Uses Plywood Because It Can Endure Constant Exposure To Seawater Without Degrading, Greatly Extending The Demand For Plywood.Rapid Urbanisation to Surge the Demand for Plywood Market: FMI Presents trends in 30+ countries

Plywood Market by Size, Thickness, Grade, Wood Type, Sales Channel & Region | Forecast 2023 to 2033

Plywood Market Outlook (2023 to 2033)

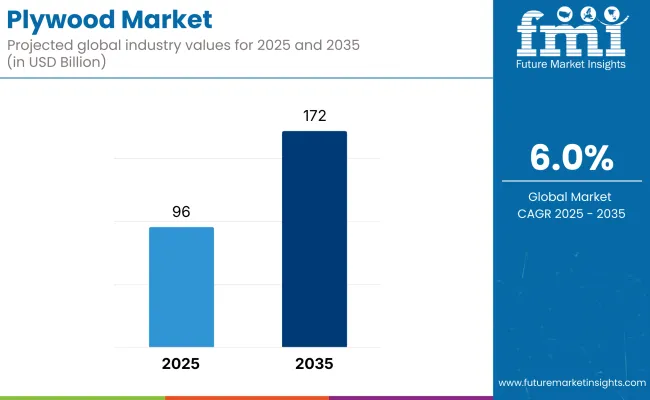
The global plywood market is expected to reach a valuation of US$ 156.9 Billion by 2033. The market is projected to grow at a CAGR of 6.3% during the forecast period and is holding a valuation of US$ 85.5 Billion as of 2023.

Some of the Factors Which are Expected to Surge the Market Growth are:

  • Increase in production capacities owing to rapid urbanization
  • The emergence of new market participants
  • Increase in disposable income, which has led to surging expenditure for interior designing

Increasing urbanization has led to an increase in the number of construction activities worldwide. Thus, a lot of companies and residential areas are laying emphasis on the structural strengths to withstand natural calamities like earthquakes. There are a lot of amounts that are being spent on the adoption of plywood products. Owing to its high structural strength and flexibility people are investing huge amounts in these.

The demand for plywood sheets is expected to increase owing to rising adoption in places that witness intense rainfall. The plywood has the ability to offer good protection against moisture. Apart from that, plywood is believed to be an eco-friendly option as compared to normal wood. The marine industry makes use of special-grade plywood, which has the ability to withstand humidity and water, thereby resisting fungal attacks.

One of the most important factors which might increase the sales of plywood materials is the surge in the construction sector. Based on the research conducted, the global construction market is expected to grow at a CAGR of nearly 11% during the forecast period.

The market is also witnessing an increase in technological advancements which might enhance the capabilities of plywood. These advancements would certainly help in scaling the production of plywood, thereby reducing manufacturing costs, increasing profitability, and improving quality.

Despite showing a significant growth outlook, the market is further subjected to certain challenges. These include restrictions on tree cutting because of a surge in pollution and a focus on sustainable development. Moreover, the fluctuation in material cost due to supply chain disruption has also hampered market growth.

Asia Pacific with the highest market share will largely contribute to the growth of plywood revenue across the assessment. The expansion of the commercial plywood products market in the Asia Pacific is being fuelled by rising demand for softwood plywood in construction projects. Rising infrastructure development, rapid industrialization, and the huge proportion of furniture manufacturers are the factors contributing to the growth of the market. Apart from that, the huge construction sector, the existence of key plywood dealers, rising indigenous plywood manufacturing demand, and an increase in disposable income among the prosperous and middle classes are all driving the plywood market growth.

Attributes

Value

Plywood Market Value (2022)

US$ 80.6 Billion

Plywood Market Value (2023)

US$ 85.5 Billion

Plywood Market Forecast Value (2033)

US$ 156.9 Billion

Plywood Market Expected CAGR (2023 to 2033)

6.3%

Customize this Report

Let us know your requirement to get
100% FREE customization

Historical Outlook (2017 to 2022) vs Anticipated CAGR

An increase in the number of development activities has led to a surge in the CAGR. While the historical CAGR for the market was 5.6%, the anticipated CAGR for the forecast period is 6.3%. Plywood is generally used in construction & flooring applications where it provides enhanced mechanical strength while substantially reducing the overall weight of the structure. The short-term, medium-term, and long-term analysis for the market can be presented in the following manner:

  • Short-term (2023 to 2026): Rising development of residential and office spaces and the growing inclination of homeowners towards interior designing, home decor, and aesthetic furnishing might surge the demand for plywood during this period.
  • Medium-term (2026 to 2029): This period might witness the Growing use of ready-made and easy-to-install furniture. This can be attributed to the lightweight properties of plywood sheets and the increasing disposable income of the users. The fact that plywood consumption boosts plantation and cultivation of timberlands is expected to work in favor of the market.
  • Long-term (2029 to 2033): Plywood dealers might be keen on developing a backward integrated supply chain. A lot many of them might own or possess licenses to maintain and cultivate forest lands in an attempt to maintain cultivation as well as plywood manufacturing and other wood-based panel products.

Interior Design and Furniture Industry to be the Key Market Drivers

The surge in the interior design and furniture industry is one of the key market drivers. These sectors are making use of plywood instead of raw wood, and indicate the surging plywood products uses in households. This is owing to the fact that plywood is more versatile as compared to raw wood, and can be used for a variety of applications like speaker making.

Apart from that, furniture design is on a constant lookout for ways to achieve cost-cutting. The usage of plywood ensures that minimum waste is generated. Apart from that, providing high durability as compared to particle board and MDF board has converted the prospects into regular users.

Nikhil Kaitwade
Nikhil Kaitwade
Principal Consultant
LinkedIn
Talk to Analyst

Find your sweet spots for generating winning opportunities in this market.

Talk to Analyst

Comparative View for Plywood Market

Plywood Market:

Attributes

Plywood Market

Anticipated CAGR (2023 to 2033)

6.3%

Market Value (2023)

US$ 85.5 Billion

Growth Factor

Rapid urbanization

Future Opportunities

Rising interior designing and furniture industry

Market Trends

The plywood market targeting the marine sector

Wood Coatings Market:

Attributes

Wood Coatings Market

Anticipated CAGR (2023 to 2033)

5.9%

Market Value (2023)

US$ 9.6 Billion

Growth Factor

Expansion of the housing market

Future Opportunities

Increase in the number of market players

Market Trends

Availability of cheaper alternatives

Wood Plastic Composites Market:

Attributes

Wood Plastic Composites Market

Anticipated CAGR (2023 to 2033)

11.3%

Market Value (2023)

US$ 17.76 Billion

Growth Factor

The surge in the repairing activities of dilapidated buildings

Future Opportunities

Increased usage of wood plastic chips

Market Trends

Increased application in non-structural sites

Country-wise Analysis

Regions

North America

Countries

USA

CAGR (2023 to 2033)

5.7%

Regions

Europe

Countries

UK, Germany

CAGR (2023 to 2033)

4.8% , 4.4%

Regions

Asia Pacific

Countries

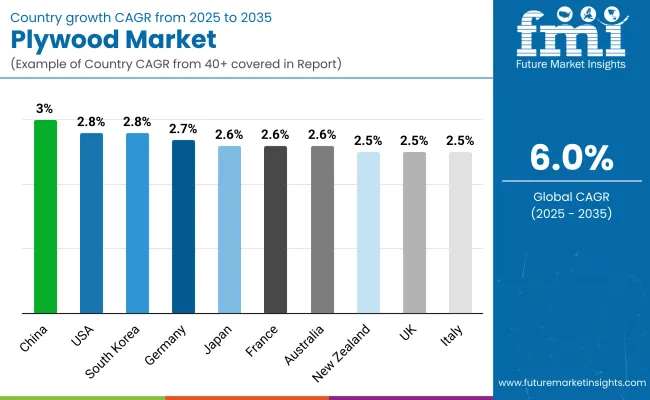
China, India

CAGR (2023 to 2033)

6.7% , 6.4%

The USA Market: Driven by high disposable income

The USA market is expected to grow during the forecast period. Surging construction activities in this region are expected to be the main driver. Additionally, with advancements in technology and the product being eco-friendly, the manufacturers operating in this sector are taking all efforts to produce the best plywood.

Attributes

Details

US Market Expected Size (2033)

US$ 13.6 Billion

US Market Absolute Dollar Growth (US$ Million/Billion)

US$ 5.8 Billion

CAGR % 2017 to 2022

5%

The plywood's capacity to function even in places with high rainfall further ensures the variety this product is able to provide. People in this region have high disposable income, as a result of which they can afford to spend a lot more on interior design as well.

The UK market witnessing the usage of automation

The key players operating in the UK market have been making use of automation to improve efficiency. Furthermore, automation ensures that there is almost no human interference because of which the process can be carried out seamlessly for hours continuously.

Attributes

Details

UK Market Expected Size (2033)

US$ 1.2 Billion

UK Market Absolute Dollar Growth (US$ Million/Billion)

US$ 462.7 Million

CAGR % 2017 to 2022

3.8%

In 2021, UPM-Kymmene Oyj was the largest player in the UK market. Automation ensured that the entire process of plywood production was carried out with high precision for the company. This coupled with the application of the latest technology ensured that the right dimensions for the plywood were achieved without wasting resources unnecessarily.

Germany: Maritime Sector Remains the Key Sector

The German market is mainly driven by the huge maritime sector. The German shipbuilding industry is the largest in Europe, and the third largest in the world, which shows the enormous potential that the sector holds for plywood. Plywood is used instead of conventional wood in the maritime sector as it has the ability to resist humidity.

Attributes

Details

Germany Market Expected Size (2033)

US$ 991.4 Million

Germany Market Absolute Dollar Growth (US$ Million/Billion)

US$ 345 Million

CAGR % 2017 to 2022

3.7%

Apart from that, a massive construction industry in Germany represents a huge scope for the plywood market. As of 2020, the German construction market was valued at a staggering € 379.5 Billion and is expected to surge in the future. These figures reveal that the plywood market has a lot to cater to in Germany.

China market: Driven by infrastructural activities

The market in China holds a major value share in the global market and is likely to maintain its dominance over the forecast period. The plywood market is dominated by China, in terms of production as well as consumption. Owing to rapidly developing infrastructural activities China is estimated to account for a larger market share in value-volume terms throughout the forecast period.

Attributes

Details

China Market Expected Size (2033)

US$ 111.8 Billion

China Market Absolute Dollar Growth (US$ Million/Billion)

US$ 53.4 Billion

CAGR % 2017 to 2022

6.2%

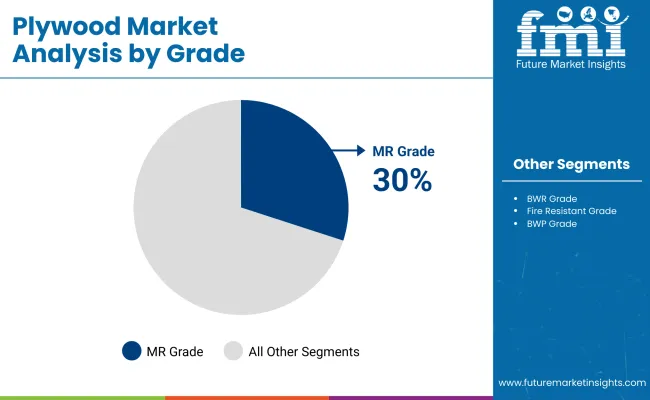
Rising infrastructural investments by public and private entities around the world are widening the demand for plywood. Structural-grade plywood and MR-grade plywood are estimated to witness high demand throughout the forecast period. Similarly, several wooden skyscrapers projects are well underway and are estimated to have a significant impact on the plywood market.

India market: Rapid urbanization to scale up the demand for plywood

Based on the statistics, the urban population in India is more than 470 Million, and in the coming years, the figures are expected to rise. Rapid urbanization is accompanied by an increase in the number of construction activities. Moreover, the influx of people from rural to urban part has also led to increasing in the rate of urbanization.

Attributes

Details

India Market Expected Size (2033)

US$ 2.6 Billion

India Market Absolute Dollar Growth (US$ Million/Billion)

US$ 1.2 Billion

CAGR % 2017 to 2022

5.7%

Apart from that, a mammoth furniture market in India ensures that the molded plywood market is expected to surge in the coming times. Based on the data released by Statista, the revenue obtained from the furniture market in 2022 was close to a massive US$ 4.74 Billion. Owing to rising disposable income, these figures are expected to surge in the future.

MarketNage
Become a MarketNgage Insider

A unified Market Research Subscription Platform, built for today's disparate research needs.

Segmentation Insights

Segment

Size

Attributes

4’x8’

CAGR % 2017 to 2022

6%

CAGR % 2023 to End of Forecast (2033)

6.8%

Segment

Thickness

Attributes

>18 mm

CAGR % 2017 to 2022

5.9%

CAGR % 2023 to End of Forecast (2033)

6.2%

4’x8’ Plywood to have the Largest Market Share Owing to Its Multifunctionality

While selecting plywood of a particular dimension, the manufacturers check the maximum purposes that can be fulfilled using a given dimension. Based on the market research, it was observed that the 4’x8’ size has the maximum utility. From exterior wall sheathing to interior walls, the 4’x8’ plywood is used for almost every application.

Apart from that, the 4’x8’ plywood is also used for roofing and flooring. This particularly includes tongue and groove edges that slot together which allows the plywood to carry the required load without shifting in the roofs. Additionally, plywood of this size is also used in the construction of cabinets.

Plywood of >18 mm Thickness has the Largest Market Share Owing to its Durability

The best thing associated with the usage of >18 mm thickness plywood is that these are highly robust. Furthermore, these are stronger even than natural wood. Apart from that, plywood of such thickness provides uniform strength along grains regardless of the direction.

Despite displaying robust characteristics, the >18 mm plywood is much lighter than solid wood. This makes the given segment suitable for furniture making. Moreover, the >18 mm segment does not split easily owing to its cross-layered structure.

Which Plywood Type is Set to Exhibit High Demand in the Market?

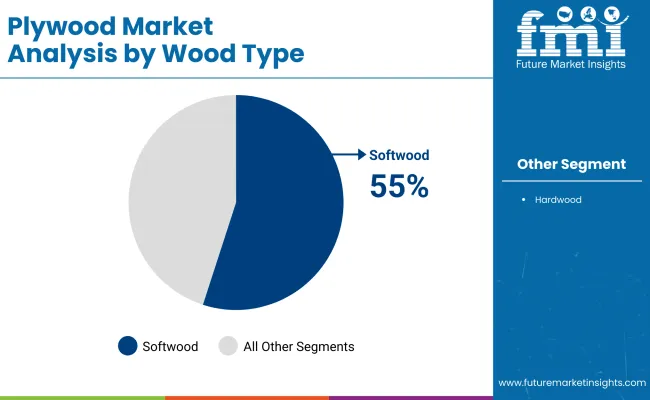
The market will be dominated by softwood plywood during the forecast timeframe. Softwood plywood sheets are designed to be put on a building's exterior. Softwood plywood is said to be easier to work with because it is lighter and more pliable. Softwood plywood comes in a variety of grades, widths, and thicknesses, depending on how it will be used; nevertheless, the finest grades are occasionally implemented for aesthetic reasons such as woodwork and cabinet construction. Softwood plywood is utilized in a variety of applications, such as skateboard ramps and work tables, in addition to home construction.

Which Application of Plywood Has the Most Potential?

The flooring & construction application segment is expected to account for over 35.6% of the global market share by 2023. Global infrastructural development has reached newer heights in the last few years, with massive constructions in both residential and commercial sectors across the world.

This has led to the impressive growth of the global flooring and construction industry and as a consequence positively impacted revenues of ancillary industries. Plywood is an inherent component of the construction industry being widely used in manufacturing readymade and customized furniture. Global construction projects focusing on wooden skyscrapers such as the Oakwood Timber Tower are also expected to positively impact demand for plywood over the coming years.

Wood and wood-based products such as plywood are eco-friendly in nature, encouraging the plantation of trees to meet the rising demand. Plywood and other ancillary wood products contribute to environmental protection. This is another factor acting in favor of the plywood market. Growth in global consumption of plywood is attributable to the continuous demand from end-use industries, especially the flooring and construction industry.

Start-ups start smart by Diversifying the Portfolio

The new players in the market have started by not only manufacturing plywood-based products but related products as well. Thus, the new players are laying a lot of emphasis on forward as well as backward integration, which would ensure that they have the resources available to them.

Spliceply is a manufacturer of plywood, block board, flush door, laminated door, and shuttering plywood and maintains a plywood warehouse as well. The quality that is maintained by the start-up is uncompromised and helps them hold on to the values on which they operate. Moreover, the products manufactured by Spliceply are chemically treated at every stage to check the infestation of insects, borers, termites, fungi, etc. Because of its immaculate quality management system, the start-up has earned a 9001:2000 certification.

Key Players Launching New Products To Cater to Different Audiences

The key players operating in the plywood market are taking massive steps to launch new products. This comes at a time when disposable income is on a constant rise, and consumers can afford new products as well. For example, Greenply Industries launched an exquisite collection of Italian dyed veneers ‘Farbivo’. The product has been launched taking into account an increase in the number of high-income prospects. These are prepared from exotic species handpicked from places like America, Brazil, Europe, etc.

Some of the recent developments are:

  • In December 2022, Boise Cascade Company announced the addition of distribution centers in two new markets.
  • In September 2022, Georgia-Pacific breaks ground on the US$ 425 Million state-of-the-art Dixie Facility in Jackson, Tennessee.

The top 3 plywood suppliers are:

Company

Uniply

Description

The principle focus of Uniply is to work and live better. The company believes in converting it into a reality through the right combination of products and services. The company has managed to reinvent itself from a plywood manufacturer to a stop-building solutions provider.

The company aspires to be known for quality and reliability. The company has focused its attention on innovation and sustainable use of natural resources. The product offerings include plywood, laminates, veneers, adhesives, wooden flooring, and a number of auxiliaries.

Company

Greenply

Description

Whenever the application of wood comes into the scene, there is a lot of talk revolving around sustainable development. Apart from providing top-notch plywood, Greenply has come up with project plantation. The idea behind this project was to plant fast-growing species of trees on infertile hill slopes.

In 2022, owing to its product quality, Greenply Industries was conferred the Best Green Manufacturing Company by the National Feather Awards. The company was also awarded as one of the most trusted brands.

Company

Georgia Pacific

Description

Having experienced nearly a decade, Georgia Pacific has never stopped evolving. The vision is to create long-term mutual benefits for customers, suppliers, communities, employees, regulators, and other partners. The company seeks to work in conjunction with a variety of organizations to continuously challenge and transform how it practices responsible stewardship.

Apart from manufacturing wood products, the company has been offering a forcefield air and water barrier system, dry guard, dry max enhanced sub-floor, and thermostat radiant barrier roof sheathing.

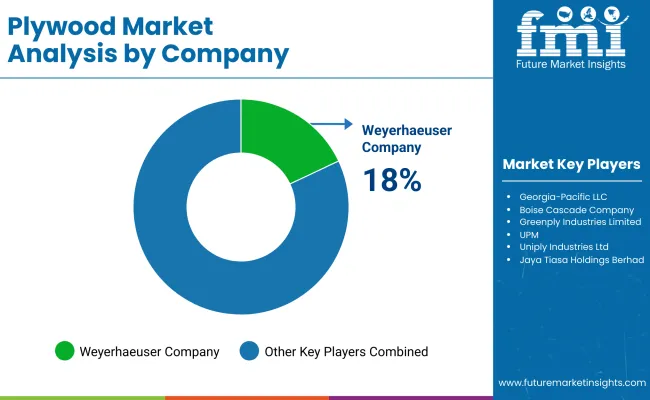
Other companies profiled are Weyerhaeuser Company and Boise Cascade Company.

Plywood Market Segmentation

By Size:

  • 4’x8’,
  • 4’x6’,
  • 4’x10’,
  • 3’x6’,
  • Others

By Thickness:

  • <8mm,
  • 8mm-18mm,
  • >18mm

By Grade:

  • MR Grade,
  • BWR Grade,
  • Fire Resistant Grade,
  • BWP Grade,
  • Structural Grade

By Wood Type:

  • Softwood,
  • Hardwood

By Number of Ply:

  • 3 ply,
  • 5 ply,
  • 7 ply,
  • More

By Sales Channel:

  • Direct Sales,
  • Distributors/Retailers

By Application:

  • Furniture,
  • Flooring & Construction,
  • Automotive Interiors,
  • Packaging,
  • Marine,
  • Others

By Region:

  • North America
  • Latin America
  • Western Europe
  • Eastern Europe
  • Asia-Pacific excluding Japan (APEJ)
  • Japan
  • Middle East and Africa (MEA)

Frequently Asked Questions

The global plywood market holds a valuation of US$ 85.5 billion as of 2023.

The plywood market is expected to grow at 6.3% CAGR from 2023 to 2033.

The global plywood market is forecasted to surpass US$ 156.9 billion by 2033.

Asia Pacific is the largest plywood market.

The main drivers are rapid urbanization and an increase in disposable income.

Table of Content

1. Executive Summary | Plywood Market

    1.1. Global Market Outlook

    1.2. Demand-side Trends

    1.3. Supply-side Trends

    1.4. Technology Roadmap Analysis

    1.5. Analysis and Recommendations

2. Market Overview

    2.1. Market Coverage / Taxonomy

    2.2. Market Definition / Scope / Limitations

3. Market Background

    3.1. Market Dynamics

        3.1.1. Drivers

        3.1.2. Restraints

        3.1.3. Opportunity

        3.1.4. Trends

    3.2. Scenario Forecast

        3.2.1. Demand in Optimistic Scenario

        3.2.2. Demand in Likely Scenario

        3.2.3. Demand in Conservative Scenario

    3.3. Opportunity Map Analysis

    3.4. Product Life Cycle Analysis

    3.5. Supply Chain Analysis

        3.5.1. Supply Side Participants and their Roles

            3.5.1.1. Producers

            3.5.1.2. Mid-Level Participants (Traders/ Agents/ Brokers)

            3.5.1.3. Wholesalers and Distributors

        3.5.2. Value Added and Value Created at Node in the Supply Chain

        3.5.3. List of Raw Material Suppliers

        3.5.4. List of Existing and Potential Buyers

    3.6. Investment Feasibility Matrix

    3.7. Value Chain Analysis

        3.7.1. Profit Margin Analysis

        3.7.2. Wholesalers and Distributors

        3.7.3. Retailers

    3.8. PESTLE and Porter’s Analysis

    3.9. Regulatory Landscape

        3.9.1. By Key Regions

        3.9.2. By Key Countries

    3.10. Regional Parent Market Outlook

    3.11. Production and Consumption Statistics

    3.12. Import and Export Statistics

4. Global Market Analysis 2017 to 2022 and Forecast, 2023 to 2033

    4.1. Historical Market Size Value (US$ Million) & Volume ('000 Cubic Meters) Analysis, 2017 to 2022

    4.2. Current and Future Market Size Value (US$ Million) & Volume ('000 Cubic Meters) Projections, 2023 to 2033

        4.2.1. Y-o-Y Growth Trend Analysis

        4.2.2. Absolute $ Opportunity Analysis

5. Global Market Analysis 2017 to 2022 and Forecast 2023 to 2033, By Size

    5.1. Introduction / Key Findings

    5.2. Historical Market Size Value (US$ Million) & Volume ('000 Cubic Meters) Analysis By Size, 2017 to 2022

    5.3. Current and Future Market Size Value (US$ Million) & Volume ('000 Cubic Meters) Analysis and Forecast By Size, 2023 to 2033

        5.3.1. 4’ x 8’

        5.3.2. 4’ x 6’

        5.3.3. 4’ x 10’

        5.3.4. 3’ x 6’

        5.3.5. Others

    5.4. Y-o-Y Growth Trend Analysis By Size, 2017 to 2022

    5.5. Absolute $ Opportunity Analysis By Size, 2023 to 2033

6. Global Market Analysis 2017 to 2022 and Forecast 2023 to 2033, By Thickness

    6.1. Introduction / Key Findings

    6.2. Historical Market Size Value (US$ Million) & Volume ('000 Cubic Meters) Analysis By Thickness, 2017 to 2022

    6.3. Current and Future Market Size Value (US$ Million) & Volume ('000 Cubic Meters) Analysis and Forecast By Thickness, 2023 to 2033

        6.3.1. < 8mm

        6.3.2. 8mm - 18mm

        6.3.3. > 18mm

    6.4. Y-o-Y Growth Trend Analysis By Thickness, 2017 to 2022

    6.5. Absolute $ Opportunity Analysis By Thickness, 2023 to 2033

7. Global Market Analysis 2017 to 2022 and Forecast 2023 to 2033, By Grade

    7.1. Introduction / Key Findings

    7.2. Historical Market Size Value (US$ Million) & Volume ('000 Cubic Meters) Analysis By Grade, 2017 to 2022

    7.3. Current and Future Market Size Value (US$ Million) & Volume ('000 Cubic Meters) Analysis and Forecast By Grade, 2023 to 2033

        7.3.1. MR Grade

        7.3.2. BWR Grade

        7.3.3. Fire Resistant Grade

        7.3.4. BWP Grade

        7.3.5. Structural Grade

    7.4. Y-o-Y Growth Trend Analysis By Grade, 2017 to 2022

    7.5. Absolute $ Opportunity Analysis By Grade, 2023 to 2033

8. Global Market Analysis 2017 to 2022 and Forecast 2023 to 2033, By Wood Type

    8.1. Introduction / Key Findings

    8.2. Historical Market Size Value (US$ Million) & Volume ('000 Cubic Meters) Analysis By Wood Type, 2017 to 2022

    8.3. Current and Future Market Size Value (US$ Million) & Volume ('000 Cubic Meters) Analysis and Forecast By Wood Type, 2023 to 2033

        8.3.1. Softwood

        8.3.2. Hardwood

    8.4. Y-o-Y Growth Trend Analysis By Wood Type, 2017 to 2022

    8.5. Absolute $ Opportunity Analysis By Wood Type, 2023 to 2033

9. Global Market Analysis 2017 to 2022 and Forecast 2023 to 2033, By Number of Ply

    9.1. Introduction / Key Findings

    9.2. Historical Market Size Value (US$ Million) & Volume ('000 Cubic Meters) Analysis By Number of Ply, 2017 to 2022

    9.3. Current and Future Market Size Value (US$ Million) & Volume ('000 Cubic Meters) Analysis and Forecast By Number of Ply, 2023 to 2033

        9.3.1. 3 Ply

        9.3.2. 5 Ply

        9.3.3. 7 Ply and More

    9.4. Y-o-Y Growth Trend Analysis By Number of Ply, 2017 to 2022

    9.5. Absolute $ Opportunity Analysis By Number of Ply, 2023 to 2033

10. Global Market Analysis 2017 to 2022 and Forecast 2023 to 2033, By Sales Channel

    10.1. Introduction / Key Findings

    10.2. Historical Market Size Value (US$ Million) & Volume ('000 Cubic Meters) Analysis By Sales Channel, 2017 to 2022

    10.3. Current and Future Market Size Value (US$ Million) & Volume ('000 Cubic Meters) Analysis and Forecast By Sales Channel, 2023 to 2033

        10.3.1. Direct Sales

        10.3.2. Distributors/Retailers

    10.4. Y-o-Y Growth Trend Analysis By Sales Channel, 2017 to 2022

    10.5. Absolute $ Opportunity Analysis By Sales Channel, 2023 to 2033

11. Global Market Analysis 2017 to 2022 and Forecast 2023 to 2033, By Application

    11.1. Introduction / Key Findings

    11.2. Historical Market Size Value (US$ Million) & Volume ('000 Cubic Meters) Analysis By Application, 2017 to 2022

    11.3. Current and Future Market Size Value (US$ Million) & Volume ('000 Cubic Meters) Analysis and Forecast By Application, 2023 to 2033

        11.3.1. Furniture

        11.3.2. Flooring & Construction

        11.3.3. Automotive Interiors

        11.3.4. Packaging

        11.3.5. Marine

        11.3.6. Others

    11.4. Y-o-Y Growth Trend Analysis By Application, 2017 to 2022

    11.5. Absolute $ Opportunity Analysis By Application, 2023 to 2033

12. Global Market Analysis 2017 to 2022 and Forecast 2023 to 2033, By Region

    12.1. Introduction

    12.2. Historical Market Size Value (US$ Million) & Volume ('000 Cubic Meters) Analysis By Region, 2017 to 2022

    12.3. Current Market Size Value (US$ Million) & Volume ('000 Cubic Meters) Analysis and Forecast By Region, 2023 to 2033

        12.3.1. North America

        12.3.2. Latin America

        12.3.3. Western Europe

        12.3.4. Eastern Europe

        12.3.5. Asia-Pacific excluding Japan (APEJ)

        12.3.6. Japan

        12.3.7. Middle East & Africa

    12.4. Market Attractiveness Analysis By Region

13. North America Market Analysis 2017 to 2022 and Forecast 2023 to 2033, By Country

    13.1. Historical Market Size Value (US$ Million) & Volume ('000 Cubic Meters) Trend Analysis By Market Taxonomy, 2017 to 2022

    13.2. Market Size Value (US$ Million) & Volume ('000 Cubic Meters) Forecast By Market Taxonomy, 2023 to 2033

        13.2.1. By Country

            13.2.1.1.United States of America

            13.2.1.2. Canada

        13.2.2. By Size

        13.2.3. By Thickness

        13.2.4. By Grade

        13.2.5. By Wood Type

        13.2.6. By Number of Ply

        13.2.7. By Sales Channel

        13.2.8. By Application

    13.3. Market Attractiveness Analysis

        13.3.1. By Country

        13.3.2. By Size

        13.3.3. By Thickness

        13.3.4. By Grade

        13.3.5. By Wood Type

        13.3.6. By Number of Ply

        13.3.7. By Sales Channel

        13.3.8. By Application

    13.4. Key Takeaways

14. Latin America Market Analysis 2017 to 2022 and Forecast 2023 to 2033, By Country

    14.1. Historical Market Size Value (US$ Million) & Volume ('000 Cubic Meters) Trend Analysis By Market Taxonomy, 2017 to 2022

    14.2. Market Size Value (US$ Million) & Volume ('000 Cubic Meters) Forecast By Market Taxonomy, 2023 to 2033

        14.2.1. By Country

            14.2.1.1. Brazil

            14.2.1.2. Mexico

            14.2.1.3. Rest of Latin America

        14.2.2. By Size

        14.2.3. By Thickness

        14.2.4. By Grade

        14.2.5. By Wood Type

        14.2.6. By Number of Ply

        14.2.7. By Sales Channel

        14.2.8. By Application

    14.3. Market Attractiveness Analysis

        14.3.1. By Country

        14.3.2. By Size

        14.3.3. By Thickness

        14.3.4. By Grade

        14.3.5. By Wood Type

        14.3.6. By Number of Ply

        14.3.7. By Sales Channel

        14.3.8. By Application

    14.4. Key Takeaways

15. Western Europe Market Analysis 2017 to 2022 and Forecast 2023 to 2033, By Country

    15.1. Historical Market Size Value (US$ Million) & Volume ('000 Cubic Meters) Trend Analysis By Market Taxonomy, 2017 to 2022

    15.2. Market Size Value (US$ Million) & Volume ('000 Cubic Meters) Forecast By Market Taxonomy, 2023 to 2033

        15.2.1. By Country

            15.2.1.1. Germany

            15.2.1.2. United Kingdom

            15.2.1.3. Spain

            15.2.1.4. France

            15.2.1.5. Italy

            15.2.1.6. Finland

            15.2.1.7. Rest of Western Europe

        15.2.2. By Size

        15.2.3. By Thickness

        15.2.4. By Grade

        15.2.5. By Wood Type

        15.2.6. By Number of Ply

        15.2.7. By Sales Channel

        15.2.8. By Application

    15.3. Market Attractiveness Analysis

        15.3.1. By Country

        15.3.2. By Size

        15.3.3. By Thickness

        15.3.4. By Grade

        15.3.5. By Wood Type

        15.3.6. By Number of Ply

        15.3.7. By Sales Channel

        15.3.8. By Application

    15.4. Key Takeaways

16. Eastern Europe Market Analysis 2017 to 2022 and Forecast 2023 to 2033, By Country

    16.1. Historical Market Size Value (US$ Million) & Volume ('000 Cubic Meters) Trend Analysis By Market Taxonomy, 2017 to 2022

    16.2. Market Size Value (US$ Million) & Volume ('000 Cubic Meters) Forecast By Market Taxonomy, 2023 to 2033

        16.2.1. By Country

            16.2.1.1. Russia

            16.2.1.2. Poland

            16.2.1.3. Romania

            16.2.1.4. Rest of Eastern Europe

        16.2.2. By Size

        16.2.3. By Thickness

        16.2.4. By Grade

        16.2.5. By Wood Type

        16.2.6. By Number of Ply

        16.2.7. By Sales Channel

        16.2.8. By Application

    16.3. Market Attractiveness Analysis

        16.3.1. By Country

        16.3.2. By Size

        16.3.3. By Thickness

        16.3.4. By Grade

        16.3.5. By Wood Type

        16.3.6. By Number of Ply

        16.3.7. By Sales Channel

        16.3.8. By Application

    16.4. Key Takeaways

17. APEJ Market Analysis 2017 to 2022 and Forecast 2023 to 2033, By Country

    17.1. Historical Market Size Value (US$ Million) & Volume ('000 Cubic Meters) Trend Analysis By Market Taxonomy, 2017 to 2022

    17.2. Market Size Value (US$ Million) & Volume ('000 Cubic Meters) Forecast By Market Taxonomy, 2023 to 2033

        17.2.1. By Country

            17.2.1.1. Indonesia

            17.2.1.2. Malaysia

            17.2.1.3. Singapore

            17.2.1.4. Australia

            17.2.1.5. New Zealand

            17.2.1.6. Philippines

            17.2.1.7. Republic of Korea

            17.2.1.8. India

            17.2.1.9. China

            17.2.1.10. Rest of APEJ

        17.2.2. By Size

        17.2.3. By Thickness

        17.2.4. By Grade

        17.2.5. By Wood Type

        17.2.6. By Number of Ply

        17.2.7. By Sales Channel

        17.2.8. By Application

    17.3. Market Attractiveness Analysis

        17.3.1. By Country

        17.3.2. By Size

        17.3.3. By Thickness

        17.3.4. By Grade

        17.3.5. By Wood Type

        17.3.6. By Number of Ply

        17.3.7. By Sales Channel

        17.3.8. By Application

    17.4. Key Takeaways

18. Japan Market Analysis 2017 to 2022 and Forecast 2023 to 2033, By Country

    18.1. Historical Market Size Value (US$ Million) & Volume ('000 Cubic Meters) Trend Analysis By Market Taxonomy, 2017 to 2022

    18.2. Market Size Value (US$ Million) & Volume ('000 Cubic Meters) Forecast By Market Taxonomy, 2023 to 2033

        18.2.1. By Country

            18.2.1.1. Japan

        18.2.2. By Size

        18.2.3. By Thickness

        18.2.4. By Grade

        18.2.5. By Wood Type

        18.2.6. By Number of Ply

        18.2.7. By Sales Channel

        18.2.8. By Application

    18.3. Market Attractiveness Analysis

        18.3.1. By Country

        18.3.2. By Size

        18.3.3. By Thickness

        18.3.4. By Grade

        18.3.5. By Wood Type

        18.3.6. By Number of Ply

        18.3.7. By Sales Channel

        18.3.8. By Application

    18.4. Key Takeaways

19. Middle East & Africa Market Analysis 2017 to 2022 and Forecast 2023 to 2033, By Country

    19.1. Historical Market Size Value (US$ Million) & Volume ('000 Cubic Meters) Trend Analysis By Market Taxonomy, 2017 to 2022

    19.2. Market Size Value (US$ Million) & Volume ('000 Cubic Meters) Forecast By Market Taxonomy, 2023 to 2033

        19.2.1. By Country

            19.2.1.1. GCC Countries

            19.2.1.2. Turkey

            19.2.1.3. South Africa

            19.2.1.4. Egypt

            19.2.1.5. Rest of Middle East & Africa

        19.2.2. By Size

        19.2.3. By Thickness

        19.2.4. By Grade

        19.2.5. By Wood Type

        19.2.6. By Number of Ply

        19.2.7. By Sales Channel

        19.2.8. By Application

    19.3. Market Attractiveness Analysis

        19.3.1. By Country

        19.3.2. By Size

        19.3.3. By Thickness

        19.3.4. By Grade

        19.3.5. By Wood Type

        19.3.6. By Number of Ply

        19.3.7. By Sales Channel

        19.3.8. By Application

    19.4. Key Takeaways

20. Key Countries Market Analysis

    20.1. United States of America

        20.1.1. Pricing Analysis

        20.1.2. Market Share Analysis, 2022

            20.1.2.1. By Size

            20.1.2.2. By Thickness

            20.1.2.3. By Grade

            20.1.2.4. By Wood Type

            20.1.2.5. By Number of Ply

            20.1.2.6. By Sales Channel

            20.1.2.7. By Application

    20.2. Canada

        20.2.1. Pricing Analysis

        20.2.2. Market Share Analysis, 2022

            20.2.2.1. By Size

            20.2.2.2. By Thickness

            20.2.2.3. By Grade

            20.2.2.4. By Wood Type

            20.2.2.5. By Number of Ply

            20.2.2.6. By Sales Channel

            20.2.2.7. By Application

    20.3. Brazil

        20.3.1. Pricing Analysis

        20.3.2. Market Share Analysis, 2022

            20.3.2.1. By Size

            20.3.2.2. By Thickness

            20.3.2.3. By Grade

            20.3.2.4. By Wood Type

            20.3.2.5. By Number of Ply

            20.3.2.6. By Sales Channel

            20.3.2.7. By Application

    20.4. Mexico

        20.4.1. Pricing Analysis

        20.4.2. Market Share Analysis, 2022

            20.4.2.1. By Size

            20.4.2.2. By Thickness

            20.4.2.3. By Grade

            20.4.2.4. By Wood Type

            20.4.2.5. By Number of Ply

            20.4.2.6. By Sales Channel

            20.4.2.7. By Application

    20.5. Germany

        20.5.1. Pricing Analysis

        20.5.2. Market Share Analysis, 2022

            20.5.2.1. By Size

            20.5.2.2. By Thickness

            20.5.2.3. By Grade

            20.5.2.4. By Wood Type

            20.5.2.5. By Number of Ply

            20.5.2.6. By Sales Channel

            20.5.2.7. By Application

    20.6. United Kingdom

        20.6.1. Pricing Analysis

        20.6.2. Market Share Analysis, 2022

            20.6.2.1. By Size

            20.6.2.2. By Thickness

            20.6.2.3. By Grade

            20.6.2.4. By Wood Type

            20.6.2.5. By Number of Ply

            20.6.2.6. By Sales Channel

            20.6.2.7. By Application

    20.7. Spain

        20.7.1. Pricing Analysis

        20.7.2. Market Share Analysis, 2022

            20.7.2.1. By Size

            20.7.2.2. By Thickness

            20.7.2.3. By Grade

            20.7.2.4. By Wood Type

            20.7.2.5. By Number of Ply

            20.7.2.6. By Sales Channel

            20.7.2.7. By Application

    20.8. France

        20.8.1. Pricing Analysis

        20.8.2. Market Share Analysis, 2022

            20.8.2.1. By Size

            20.8.2.2. By Thickness

            20.8.2.3. By Grade

            20.8.2.4. By Wood Type

            20.8.2.5. By Number of Ply

            20.8.2.6. By Sales Channel

            20.8.2.7. By Application

    20.9. Italy

        20.9.1. Pricing Analysis

        20.9.2. Market Share Analysis, 2022

            20.9.2.1. By Size

            20.9.2.2. By Thickness

            20.9.2.3. By Grade

            20.9.2.4. By Wood Type

            20.9.2.5. By Number of Ply

            20.9.2.6. By Sales Channel

            20.9.2.7. By Application

    20.10. Finland

        20.10.1. Pricing Analysis

        20.10.2. Market Share Analysis, 2022

            20.10.2.1. By Size

            20.10.2.2. By Thickness

            20.10.2.3. By Grade

            20.10.2.4. By Wood Type

            20.10.2.5. By Number of Ply

            20.10.2.6. By Sales Channel

            20.10.2.7. By Application

    20.11. Russia

        20.11.1. Pricing Analysis

        20.11.2. Market Share Analysis, 2022

            20.11.2.1. By Size

            20.11.2.2. By Thickness

            20.11.2.3. By Grade

            20.11.2.4. By Wood Type

            20.11.2.5. By Number of Ply

            20.11.2.6. By Sales Channel

            20.11.2.7. By Application

    20.12. Poland

        20.12.1. Pricing Analysis

        20.12.2. Market Share Analysis, 2022

            20.12.2.1. By Size

            20.12.2.2. By Thickness

            20.12.2.3. By Grade

            20.12.2.4. By Wood Type

            20.12.2.5. By Number of Ply

            20.12.2.6. By Sales Channel

            20.12.2.7. By Application

    20.13. Romania

        20.13.1. Pricing Analysis

        20.13.2. Market Share Analysis, 2022

            20.13.2.1. By Size

            20.13.2.2. By Thickness

            20.13.2.3. By Grade

            20.13.2.4. By Wood Type

            20.13.2.5. By Number of Ply

            20.13.2.6. By Sales Channel

            20.13.2.7. By Application

    20.14. Indonesia

        20.14.1. Pricing Analysis

        20.14.2. Market Share Analysis, 2022

            20.14.2.1. By Size

            20.14.2.2. By Thickness

            20.14.2.3. By Grade

            20.14.2.4. By Wood Type

            20.14.2.5. By Number of Ply

            20.14.2.6. By Sales Channel

            20.14.2.7. By Application

    20.15. Malaysia

        20.15.1. Pricing Analysis

        20.15.2. Market Share Analysis, 2022

            20.15.2.1. By Size

            20.15.2.2. By Thickness

            20.15.2.3. By Grade

            20.15.2.4. By Wood Type

            20.15.2.5. By Number of Ply

            20.15.2.6. By Sales Channel

            20.15.2.7. By Application

    20.16. Singapore

        20.16.1. Pricing Analysis

        20.16.2. Market Share Analysis, 2022

            20.16.2.1. By Size

            20.16.2.2. By Thickness

            20.16.2.3. By Grade

            20.16.2.4. By Wood Type

            20.16.2.5. By Number of Ply

            20.16.2.6. By Sales Channel

            20.16.2.7. By Application

    20.17. Australia

        20.17.1. Pricing Analysis

        20.17.2. Market Share Analysis, 2022

            20.17.2.1. By Size

            20.17.2.2. By Thickness

            20.17.2.3. By Grade

            20.17.2.4. By Wood Type

            20.17.2.5. By Number of Ply

            20.17.2.6. By Sales Channel

            20.17.2.7. By Application

    20.18. New Zealand

        20.18.1. Pricing Analysis

        20.18.2. Market Share Analysis, 2022

            20.18.2.1. By Size

            20.18.2.2. By Thickness

            20.18.2.3. By Grade

            20.18.2.4. By Wood Type

            20.18.2.5. By Number of Ply

            20.18.2.6. By Sales Channel

            20.18.2.7. By Application

    20.19. Philippines

        20.19.1. Pricing Analysis

        20.19.2. Market Share Analysis, 2022

            20.19.2.1. By Size

            20.19.2.2. By Thickness

            20.19.2.3. By Grade

            20.19.2.4. By Wood Type

            20.19.2.5. By Number of Ply

            20.19.2.6. By Sales Channel

            20.19.2.7. By Application

    20.20. Republic of Korea

        20.20.1. Pricing Analysis

        20.20.2. Market Share Analysis, 2022

            20.20.2.1. By Size

            20.20.2.2. By Thickness

            20.20.2.3. By Grade

            20.20.2.4. By Wood Type

            20.20.2.5. By Number of Ply

            20.20.2.6. By Sales Channel

            20.20.2.7. By Application

    20.21. India

        20.21.1. Pricing Analysis

        20.21.2. Market Share Analysis, 2022

            20.21.2.1. By Size

            20.21.2.2. By Thickness

            20.21.2.3. By Grade

            20.21.2.4. By Wood Type

            20.21.2.5. By Number of Ply

            20.21.2.6. By Sales Channel

            20.21.2.7. By Application

    20.22. China

        20.22.1. Pricing Analysis

        20.22.2. Market Share Analysis, 2022

            20.22.2.1. By Size

            20.22.2.2. By Thickness

            20.22.2.3. By Grade

            20.22.2.4. By Wood Type

            20.22.2.5. By Number of Ply

            20.22.2.6. By Sales Channel

            20.22.2.7. By Application

    20.23. Japan

        20.23.1. Pricing Analysis

        20.23.2. Market Share Analysis, 2022

            20.23.2.1. By Size

            20.23.2.2. By Thickness

            20.23.2.3. By Grade

            20.23.2.4. By Wood Type

            20.23.2.5. By Number of Ply

            20.23.2.6. By Sales Channel

            20.23.2.7. By Application

    20.24. GCC Countries

        20.24.1. Pricing Analysis

        20.24.2. Market Share Analysis, 2022

            20.24.2.1. By Size

            20.24.2.2. By Thickness

            20.24.2.3. By Grade

            20.24.2.4. By Wood Type

            20.24.2.5. By Number of Ply

            20.24.2.6. By Sales Channel

            20.24.2.7. By Application

    20.25. Turkey

        20.25.1. Pricing Analysis

        20.25.2. Market Share Analysis, 2022

            20.25.2.1. By Size

            20.25.2.2. By Thickness

            20.25.2.3. By Grade

            20.25.2.4. By Wood Type

            20.25.2.5. By Number of Ply

            20.25.2.6. By Sales Channel

            20.25.2.7. By Application

    20.26. South Africa

        20.26.1. Pricing Analysis

        20.26.2. Market Share Analysis, 2022

            20.26.2.1. By Size

            20.26.2.2. By Thickness

            20.26.2.3. By Grade

            20.26.2.4. By Wood Type

            20.26.2.5. By Number of Ply

            20.26.2.6. By Sales Channel

            20.26.2.7. By Application

    20.27. Egypt

        20.27.1. Pricing Analysis

        20.27.2. Market Share Analysis, 2022

            20.27.2.1. By Size

            20.27.2.2. By Thickness

            20.27.2.3. By Grade

            20.27.2.4. By Wood Type

            20.27.2.5. By Number of Ply

            20.27.2.6. By Sales Channel

            20.27.2.7. By Application

21. Market Structure Analysis

    21.1. Competition Dashboard

    21.2. Competition Benchmarking

    21.3. Market Share Analysis of Top Players

        21.3.1. By Regional

        21.3.2. By Size

        21.3.3. By Thickness

        21.3.4. By Grade

        21.3.5. By Wood Type

        21.3.6. By Number of Ply

        21.3.7. By Sales Channel

        21.3.8. By Application

22. Competition Analysis

    22.1. Competition Deep Dive

        22.1.1. Weyerhaeuser Company

            22.1.1.1. Overview

            22.1.1.2. Product Portfolio

            22.1.1.3. Profitability by Market Segments

            22.1.1.4. Sales Footprint

            22.1.1.5. Strategy Overview

                22.1.1.5.1. Marketing Strategy

                22.1.1.5.2. Product Strategy

                22.1.1.5.3. Channel Strategy

        22.1.2. Boise Cascade Company

            22.1.2.1. Overview

            22.1.2.2. Product Portfolio

            22.1.2.3. Profitability by Market Segments

            22.1.2.4. Sales Footprint

            22.1.2.5. Strategy Overview

                22.1.2.5.1. Marketing Strategy

                22.1.2.5.2. Product Strategy

                22.1.2.5.3. Channel Strategy

        22.1.3. Greenply Industries Limited

            22.1.3.1. Overview

            22.1.3.2. Product Portfolio

            22.1.3.3. Profitability by Market Segments

            22.1.3.4. Sales Footprint

            22.1.3.5. Strategy Overview

                22.1.3.5.1. Marketing Strategy

                22.1.3.5.2. Product Strategy

                22.1.3.5.3. Channel Strategy

        22.1.4. Georgia-Pacific, LLC

            22.1.4.1. Overview

            22.1.4.2. Product Portfolio

            22.1.4.3. Profitability by Market Segments

            22.1.4.4. Sales Footprint

            22.1.4.5. Strategy Overview

                22.1.4.5.1. Marketing Strategy

                22.1.4.5.2. Product Strategy

                22.1.4.5.3. Channel Strategy

        22.1.5. Uniply Industries Ltd

            22.1.5.1. Overview

            22.1.5.2. Product Portfolio

            22.1.5.3. Profitability by Market Segments

            22.1.5.4. Sales Footprint

            22.1.5.5. Strategy Overview

                22.1.5.5.1. Marketing Strategy

                22.1.5.5.2. Product Strategy

                22.1.5.5.3. Channel Strategy

        22.1.6. JAYA TIASA HOLDINGS BERHAD

            22.1.6.1. Overview

            22.1.6.2. Product Portfolio

            22.1.6.3. Profitability by Market Segments

            22.1.6.4. Sales Footprint

            22.1.6.5. Strategy Overview

                22.1.6.5.1. Marketing Strategy

                22.1.6.5.2. Product Strategy

                22.1.6.5.3. Channel Strategy

        22.1.7. UPM-Kymmene Oyj

            22.1.7.1. Overview

            22.1.7.2. Product Portfolio

            22.1.7.3. Profitability by Market Segments

            22.1.7.4. Sales Footprint

            22.1.7.5. Strategy Overview

                22.1.7.5.1. Marketing Strategy

                22.1.7.5.2. Product Strategy

                22.1.7.5.3. Channel Strategy

        22.1.8. SUBUR TIASA HOLDINGS BERHAD

            22.1.8.1. Overview

            22.1.8.2. Product Portfolio

            22.1.8.3. Profitability by Market Segments

            22.1.8.4. Sales Footprint

            22.1.8.5. Strategy Overview

                22.1.8.5.1. Marketing Strategy

                22.1.8.5.2. Product Strategy

                22.1.8.5.3. Channel Strategy

        22.1.9. Sveza-Les LLC

            22.1.9.1. Overview

            22.1.9.2. Product Portfolio

            22.1.9.3. Profitability by Market Segments

            22.1.9.4. Sales Footprint

            22.1.9.5. Strategy Overview

                22.1.9.5.1. Marketing Strategy

                22.1.9.5.2. Product Strategy

                22.1.9.5.3. Channel Strategy

23. Assumptions & Acronyms Used

24. Research Methodology
Customize this Report

Let us know your requirement to get
100% FREE customization

List of Tables

Table 1: Global Market Value (US$ Million) Forecast by Region, 2017 to 2033

Table 2: Global Market Volume ('000 Cubic Meters) Forecast by Region, 2017 to 2033

Table 3: Global Market Value (US$ Million) Forecast by Size, 2017 to 2033

Table 4: Global Market Volume ('000 Cubic Meters) Forecast by Size, 2017 to 2033

Table 5: Global Market Value (US$ Million) Forecast by Thickness, 2017 to 2033

Table 6: Global Market Volume ('000 Cubic Meters) Forecast by Thickness, 2017 to 2033

Table 7: Global Market Value (US$ Million) Forecast by Grade, 2017 to 2033

Table 8: Global Market Volume ('000 Cubic Meters) Forecast by Grade, 2017 to 2033

Table 9: Global Market Value (US$ Million) Forecast by Wood Type, 2017 to 2033

Table 10: Global Market Volume ('000 Cubic Meters) Forecast by Wood Type, 2017 to 2033

Table 11: Global Market Value (US$ Million) Forecast by Number of Ply, 2017 to 2033

Table 12: Global Market Volume ('000 Cubic Meters) Forecast by Number of Ply, 2017 to 2033

Table 13: Global Market Value (US$ Million) Forecast by Sales Channel, 2017 to 2033

Table 14: Global Market Volume ('000 Cubic Meters) Forecast by Sales Channel, 2017 to 2033

Table 15: Global Market Value (US$ Million) Forecast by Application, 2017 to 2033

Table 16: Global Market Volume ('000 Cubic Meters) Forecast by Application, 2017 to 2033

Table 17: North America Market Value (US$ Million) Forecast by Country, 2017 to 2033

Table 18: North America Market Volume ('000 Cubic Meters) Forecast by Country, 2017 to 2033

Table 19: North America Market Value (US$ Million) Forecast by Size, 2017 to 2033

Table 20: North America Market Volume ('000 Cubic Meters) Forecast by Size, 2017 to 2033

Table 21: North America Market Value (US$ Million) Forecast by Thickness, 2017 to 2033

Table 22: North America Market Volume ('000 Cubic Meters) Forecast by Thickness, 2017 to 2033

Table 23: North America Market Value (US$ Million) Forecast by Grade, 2017 to 2033

Table 24: North America Market Volume ('000 Cubic Meters) Forecast by Grade, 2017 to 2033

Table 25: North America Market Value (US$ Million) Forecast by Wood Type, 2017 to 2033

Table 26: North America Market Volume ('000 Cubic Meters) Forecast by Wood Type, 2017 to 2033

Table 27: North America Market Value (US$ Million) Forecast by Number of Ply, 2017 to 2033

Table 28: North America Market Volume ('000 Cubic Meters) Forecast by Number of Ply, 2017 to 2033

Table 29: North America Market Value (US$ Million) Forecast by Sales Channel, 2017 to 2033

Table 30: North America Market Volume ('000 Cubic Meters) Forecast by Sales Channel, 2017 to 2033

Table 31: North America Market Value (US$ Million) Forecast by Application, 2017 to 2033

Table 32: North America Market Volume ('000 Cubic Meters) Forecast by Application, 2017 to 2033

Table 33: Latin America Market Value (US$ Million) Forecast by Country, 2017 to 2033

Table 34: Latin America Market Volume ('000 Cubic Meters) Forecast by Country, 2017 to 2033

Table 35: Latin America Market Value (US$ Million) Forecast by Size, 2017 to 2033

Table 36: Latin America Market Volume ('000 Cubic Meters) Forecast by Size, 2017 to 2033

Table 37: Latin America Market Value (US$ Million) Forecast by Thickness, 2017 to 2033

Table 38: Latin America Market Volume ('000 Cubic Meters) Forecast by Thickness, 2017 to 2033

Table 39: Latin America Market Value (US$ Million) Forecast by Grade, 2017 to 2033

Table 40: Latin America Market Volume ('000 Cubic Meters) Forecast by Grade, 2017 to 2033

Table 41: Latin America Market Value (US$ Million) Forecast by Wood Type, 2017 to 2033

Table 42: Latin America Market Volume ('000 Cubic Meters) Forecast by Wood Type, 2017 to 2033

Table 43: Latin America Market Value (US$ Million) Forecast by Number of Ply, 2017 to 2033

Table 44: Latin America Market Volume ('000 Cubic Meters) Forecast by Number of Ply, 2017 to 2033

Table 45: Latin America Market Value (US$ Million) Forecast by Sales Channel, 2017 to 2033

Table 46: Latin America Market Volume ('000 Cubic Meters) Forecast by Sales Channel, 2017 to 2033

Table 47: Latin America Market Value (US$ Million) Forecast by Application, 2017 to 2033

Table 48: Latin America Market Volume ('000 Cubic Meters) Forecast by Application, 2017 to 2033

Table 49: Western Europe Market Value (US$ Million) Forecast by Country, 2017 to 2033

Table 50: Western Europe Market Volume ('000 Cubic Meters) Forecast by Country, 2017 to 2033

Table 51: Western Europe Market Value (US$ Million) Forecast by Size, 2017 to 2033

Table 52: Western Europe Market Volume ('000 Cubic Meters) Forecast by Size, 2017 to 2033

Table 53: Western Europe Market Value (US$ Million) Forecast by Thickness, 2017 to 2033

Table 54: Western Europe Market Volume ('000 Cubic Meters) Forecast by Thickness, 2017 to 2033

Table 55: Western Europe Market Value (US$ Million) Forecast by Grade, 2017 to 2033

Table 56: Western Europe Market Volume ('000 Cubic Meters) Forecast by Grade, 2017 to 2033

Table 57: Western Europe Market Value (US$ Million) Forecast by Wood Type, 2017 to 2033

Table 58: Western Europe Market Volume ('000 Cubic Meters) Forecast by Wood Type, 2017 to 2033

Table 59: Western Europe Market Value (US$ Million) Forecast by Number of Ply, 2017 to 2033

Table 60: Western Europe Market Volume ('000 Cubic Meters) Forecast by Number of Ply, 2017 to 2033

Table 61: Western Europe Market Value (US$ Million) Forecast by Sales Channel, 2017 to 2033

Table 62: Western Europe Market Volume ('000 Cubic Meters) Forecast by Sales Channel, 2017 to 2033

Table 63: Western Europe Market Value (US$ Million) Forecast by Application, 2017 to 2033

Table 64: Western Europe Market Volume ('000 Cubic Meters) Forecast by Application, 2017 to 2033

Table 65: Eastern Europe Market Value (US$ Million) Forecast by Country, 2017 to 2033

Table 66: Eastern Europe Market Volume ('000 Cubic Meters) Forecast by Country, 2017 to 2033

Table 67: Eastern Europe Market Value (US$ Million) Forecast by Size, 2017 to 2033

Table 68: Eastern Europe Market Volume ('000 Cubic Meters) Forecast by Size, 2017 to 2033

Table 69: Eastern Europe Market Value (US$ Million) Forecast by Thickness, 2017 to 2033

Table 70: Eastern Europe Market Volume ('000 Cubic Meters) Forecast by Thickness, 2017 to 2033

Table 71: Eastern Europe Market Value (US$ Million) Forecast by Grade, 2017 to 2033

Table 72: Eastern Europe Market Volume ('000 Cubic Meters) Forecast by Grade, 2017 to 2033

Table 73: Eastern Europe Market Value (US$ Million) Forecast by Wood Type, 2017 to 2033

Table 74: Eastern Europe Market Volume ('000 Cubic Meters) Forecast by Wood Type, 2017 to 2033

Table 75: Eastern Europe Market Value (US$ Million) Forecast by Number of Ply, 2017 to 2033

Table 76: Eastern Europe Market Volume ('000 Cubic Meters) Forecast by Number of Ply, 2017 to 2033

Table 77: Eastern Europe Market Value (US$ Million) Forecast by Sales Channel, 2017 to 2033

Table 78: Eastern Europe Market Volume ('000 Cubic Meters) Forecast by Sales Channel, 2017 to 2033

Table 79: Eastern Europe Market Value (US$ Million) Forecast by Application, 2017 to 2033

Table 80: Eastern Europe Market Volume ('000 Cubic Meters) Forecast by Application, 2017 to 2033

Table 81: APEJ Market Value (US$ Million) Forecast by Country, 2017 to 2033

Table 82: APEJ Market Volume ('000 Cubic Meters) Forecast by Country, 2017 to 2033

Table 83: APEJ Market Value (US$ Million) Forecast by Size, 2017 to 2033

Table 84: APEJ Market Volume ('000 Cubic Meters) Forecast by Size, 2017 to 2033

Table 85: APEJ Market Value (US$ Million) Forecast by Thickness, 2017 to 2033

Table 86: APEJ Market Volume ('000 Cubic Meters) Forecast by Thickness, 2017 to 2033

Table 87: APEJ Market Value (US$ Million) Forecast by Grade, 2017 to 2033

Table 88: APEJ Market Volume ('000 Cubic Meters) Forecast by Grade, 2017 to 2033

Table 89: APEJ Market Value (US$ Million) Forecast by Wood Type, 2017 to 2033

Table 90: APEJ Market Volume ('000 Cubic Meters) Forecast by Wood Type, 2017 to 2033

Table 91: APEJ Market Value (US$ Million) Forecast by Number of Ply, 2017 to 2033

Table 92: APEJ Market Volume ('000 Cubic Meters) Forecast by Number of Ply, 2017 to 2033

Table 93: APEJ Market Value (US$ Million) Forecast by Sales Channel, 2017 to 2033

Table 94: APEJ Market Volume ('000 Cubic Meters) Forecast by Sales Channel, 2017 to 2033

Table 95: APEJ Market Value (US$ Million) Forecast by Application, 2017 to 2033

Table 96: APEJ Market Volume ('000 Cubic Meters) Forecast by Application, 2017 to 2033

Table 97: Japan Market Value (US$ Million) Forecast by Country, 2017 to 2033

Table 98: Japan Market Volume ('000 Cubic Meters) Forecast by Country, 2017 to 2033

Table 99: Japan Market Value (US$ Million) Forecast by Size, 2017 to 2033

Table 100: Japan Market Volume ('000 Cubic Meters) Forecast by Size, 2017 to 2033

Table 101: Japan Market Value (US$ Million) Forecast by Thickness, 2017 to 2033

Table 102: Japan Market Volume ('000 Cubic Meters) Forecast by Thickness, 2017 to 2033

Table 103: Japan Market Value (US$ Million) Forecast by Grade, 2017 to 2033

Table 104: Japan Market Volume ('000 Cubic Meters) Forecast by Grade, 2017 to 2033

Table 105: Japan Market Value (US$ Million) Forecast by Wood Type, 2017 to 2033

Table 106: Japan Market Volume ('000 Cubic Meters) Forecast by Wood Type, 2017 to 2033

Table 107: Japan Market Value (US$ Million) Forecast by Number of Ply, 2017 to 2033

Table 108: Japan Market Volume ('000 Cubic Meters) Forecast by Number of Ply, 2017 to 2033

Table 109: Japan Market Value (US$ Million) Forecast by Sales Channel, 2017 to 2033

Table 110: Japan Market Volume ('000 Cubic Meters) Forecast by Sales Channel, 2017 to 2033

Table 111: Japan Market Value (US$ Million) Forecast by Application, 2017 to 2033

Table 112: Japan Market Volume ('000 Cubic Meters) Forecast by Application, 2017 to 2033

Table 113: Middle East & Africa Market Value (US$ Million) Forecast by Country, 2017 to 2033

Table 114: Middle East & Africa Market Volume ('000 Cubic Meters) Forecast by Country, 2017 to 2033

Table 115: Middle East & Africa Market Value (US$ Million) Forecast by Size, 2017 to 2033

Table 116: Middle East & Africa Market Volume ('000 Cubic Meters) Forecast by Size, 2017 to 2033

Table 117: Middle East & Africa Market Value (US$ Million) Forecast by Thickness, 2017 to 2033

Table 118: Middle East & Africa Market Volume ('000 Cubic Meters) Forecast by Thickness, 2017 to 2033

Table 119: Middle East & Africa Market Value (US$ Million) Forecast by Grade, 2017 to 2033

Table 120: Middle East & Africa Market Volume ('000 Cubic Meters) Forecast by Grade, 2017 to 2033

Table 121: Middle East & Africa Market Value (US$ Million) Forecast by Wood Type, 2017 to 2033

Table 122: Middle East & Africa Market Volume ('000 Cubic Meters) Forecast by Wood Type, 2017 to 2033

Table 123: Middle East & Africa Market Value (US$ Million) Forecast by Number of Ply, 2017 to 2033

Table 124: Middle East & Africa Market Volume ('000 Cubic Meters) Forecast by Number of Ply, 2017 to 2033

Table 125: Middle East & Africa Market Value (US$ Million) Forecast by Sales Channel, 2017 to 2033

Table 126: Middle East & Africa Market Volume ('000 Cubic Meters) Forecast by Sales Channel, 2017 to 2033

Table 127: Middle East & Africa Market Value (US$ Million) Forecast by Application, 2017 to 2033

Table 128: Middle East & Africa Market Volume ('000 Cubic Meters) Forecast by Application, 2017 to 2033
Nikhil Kaitwade
Principal Consultant
LinkedIn
Talk to Analyst

Find your sweet spots for generating winning opportunities in this market.

Talk to Analyst

List of Charts

Figure 1: Global Market Value (US$ Million) by Size, 2023 to 2033

Figure 2: Global Market Value (US$ Million) by Thickness, 2023 to 2033

Figure 3: Global Market Value (US$ Million) by Grade, 2023 to 2033

Figure 4: Global Market Value (US$ Million) by Wood Type, 2023 to 2033

Figure 5: Global Market Value (US$ Million) by Number of Ply, 2023 to 2033

Figure 6: Global Market Value (US$ Million) by Sales Channel, 2023 to 2033

Figure 7: Global Market Value (US$ Million) by Application, 2023 to 2033

Figure 8: Global Market Value (US$ Million) by Region, 2023 to 2033

Figure 9: Global Market Value (US$ Million) Analysis by Region, 2017 to 2033

Figure 10: Global Market Volume ('000 Cubic Meters) Analysis by Region, 2017 to 2033

Figure 11: Global Market Value Share (%) and BPS Analysis by Region, 2023 to 2033

Figure 12: Global Market Y-o-Y Growth (%) Projections by Region, 2023 to 2033

Figure 13: Global Market Value (US$ Million) Analysis by Size, 2017 to 2033

Figure 14: Global Market Volume ('000 Cubic Meters) Analysis by Size, 2017 to 2033

Figure 15: Global Market Value Share (%) and BPS Analysis by Size, 2023 to 2033

Figure 16: Global Market Y-o-Y Growth (%) Projections by Size, 2023 to 2033

Figure 17: Global Market Value (US$ Million) Analysis by Thickness, 2017 to 2033

Figure 18: Global Market Volume ('000 Cubic Meters) Analysis by Thickness, 2017 to 2033

Figure 19: Global Market Value Share (%) and BPS Analysis by Thickness, 2023 to 2033

Figure 20: Global Market Y-o-Y Growth (%) Projections by Thickness, 2023 to 2033

Figure 21: Global Market Value (US$ Million) Analysis by Grade, 2017 to 2033

Figure 22: Global Market Volume ('000 Cubic Meters) Analysis by Grade, 2017 to 2033

Figure 23: Global Market Value Share (%) and BPS Analysis by Grade, 2023 to 2033

Figure 24: Global Market Y-o-Y Growth (%) Projections by Grade, 2023 to 2033

Figure 25: Global Market Value (US$ Million) Analysis by Wood Type, 2017 to 2033

Figure 26: Global Market Volume ('000 Cubic Meters) Analysis by Wood Type, 2017 to 2033

Figure 27: Global Market Value Share (%) and BPS Analysis by Wood Type, 2023 to 2033

Figure 28: Global Market Y-o-Y Growth (%) Projections by Wood Type, 2023 to 2033

Figure 29: Global Market Value (US$ Million) Analysis by Number of Ply, 2017 to 2033

Figure 30: Global Market Volume ('000 Cubic Meters) Analysis by Number of Ply, 2017 to 2033

Figure 31: Global Market Value Share (%) and BPS Analysis by Number of Ply, 2023 to 2033

Figure 32: Global Market Y-o-Y Growth (%) Projections by Number of Ply, 2023 to 2033

Figure 33: Global Market Value (US$ Million) Analysis by Sales Channel, 2017 to 2033

Figure 34: Global Market Volume ('000 Cubic Meters) Analysis by Sales Channel, 2017 to 2033

Figure 35: Global Market Value Share (%) and BPS Analysis by Sales Channel, 2023 to 2033

Figure 36: Global Market Y-o-Y Growth (%) Projections by Sales Channel, 2023 to 2033

Figure 37: Global Market Value (US$ Million) Analysis by Application, 2017 to 2033

Figure 38: Global Market Volume ('000 Cubic Meters) Analysis by Application, 2017 to 2033

Figure 39: Global Market Value Share (%) and BPS Analysis by Application, 2023 to 2033

Figure 40: Global Market Y-o-Y Growth (%) Projections by Application, 2023 to 2033

Figure 41: Global Market Attractiveness by Size, 2023 to 2033

Figure 42: Global Market Attractiveness by Thickness, 2023 to 2033

Figure 43: Global Market Attractiveness by Grade, 2023 to 2033

Figure 44: Global Market Attractiveness by Wood Type, 2023 to 2033

Figure 45: Global Market Attractiveness by Number of Ply, 2023 to 2033

Figure 46: Global Market Attractiveness by Sales Channel, 2023 to 2033

Figure 47: Global Market Attractiveness by Application, 2023 to 2033

Figure 48: Global Market Attractiveness by Region, 2023 to 2033

Figure 49: North America Market Value (US$ Million) by Size, 2023 to 2033

Figure 50: North America Market Value (US$ Million) by Thickness, 2023 to 2033

Figure 51: North America Market Value (US$ Million) by Grade, 2023 to 2033

Figure 52: North America Market Value (US$ Million) by Wood Type, 2023 to 2033

Figure 53: North America Market Value (US$ Million) by Number of Ply, 2023 to 2033

Figure 54: North America Market Value (US$ Million) by Sales Channel, 2023 to 2033

Figure 55: North America Market Value (US$ Million) by Application, 2023 to 2033

Figure 56: North America Market Value (US$ Million) by Country, 2023 to 2033

Figure 57: North America Market Value (US$ Million) Analysis by Country, 2017 to 2033

Figure 58: North America Market Volume ('000 Cubic Meters) Analysis by Country, 2017 to 2033

Figure 59: North America Market Value Share (%) and BPS Analysis by Country, 2023 to 2033

Figure 60: North America Market Y-o-Y Growth (%) Projections by Country, 2023 to 2033

Figure 61: North America Market Value (US$ Million) Analysis by Size, 2017 to 2033

Figure 62: North America Market Volume ('000 Cubic Meters) Analysis by Size, 2017 to 2033

Figure 63: North America Market Value Share (%) and BPS Analysis by Size, 2023 to 2033

Figure 64: North America Market Y-o-Y Growth (%) Projections by Size, 2023 to 2033

Figure 65: North America Market Value (US$ Million) Analysis by Thickness, 2017 to 2033

Figure 66: North America Market Volume ('000 Cubic Meters) Analysis by Thickness, 2017 to 2033

Figure 67: North America Market Value Share (%) and BPS Analysis by Thickness, 2023 to 2033

Figure 68: North America Market Y-o-Y Growth (%) Projections by Thickness, 2023 to 2033

Figure 69: North America Market Value (US$ Million) Analysis by Grade, 2017 to 2033

Figure 70: North America Market Volume ('000 Cubic Meters) Analysis by Grade, 2017 to 2033

Figure 71: North America Market Value Share (%) and BPS Analysis by Grade, 2023 to 2033

Figure 72: North America Market Y-o-Y Growth (%) Projections by Grade, 2023 to 2033

Figure 73: North America Market Value (US$ Million) Analysis by Wood Type, 2017 to 2033

Figure 74: North America Market Volume ('000 Cubic Meters) Analysis by Wood Type, 2017 to 2033

Figure 75: North America Market Value Share (%) and BPS Analysis by Wood Type, 2023 to 2033

Figure 76: North America Market Y-o-Y Growth (%) Projections by Wood Type, 2023 to 2033

Figure 77: North America Market Value (US$ Million) Analysis by Number of Ply, 2017 to 2033

Figure 78: North America Market Volume ('000 Cubic Meters) Analysis by Number of Ply, 2017 to 2033

Figure 79: North America Market Value Share (%) and BPS Analysis by Number of Ply, 2023 to 2033

Figure 80: North America Market Y-o-Y Growth (%) Projections by Number of Ply, 2023 to 2033

Figure 81: North America Market Value (US$ Million) Analysis by Sales Channel, 2017 to 2033

Figure 82: North America Market Volume ('000 Cubic Meters) Analysis by Sales Channel, 2017 to 2033

Figure 83: North America Market Value Share (%) and BPS Analysis by Sales Channel, 2023 to 2033

Figure 84: North America Market Y-o-Y Growth (%) Projections by Sales Channel, 2023 to 2033

Figure 85: North America Market Value (US$ Million) Analysis by Application, 2017 to 2033

Figure 86: North America Market Volume ('000 Cubic Meters) Analysis by Application, 2017 to 2033

Figure 87: North America Market Value Share (%) and BPS Analysis by Application, 2023 to 2033

Figure 88: North America Market Y-o-Y Growth (%) Projections by Application, 2023 to 2033

Figure 89: North America Market Attractiveness by Size, 2023 to 2033

Figure 90: North America Market Attractiveness by Thickness, 2023 to 2033

Figure 91: North America Market Attractiveness by Grade, 2023 to 2033

Figure 92: North America Market Attractiveness by Wood Type, 2023 to 2033

Figure 93: North America Market Attractiveness by Number of Ply, 2023 to 2033

Figure 94: North America Market Attractiveness by Sales Channel, 2023 to 2033

Figure 95: North America Market Attractiveness by Application, 2023 to 2033

Figure 96: North America Market Attractiveness by Country, 2023 to 2033

Figure 97: Latin America Market Value (US$ Million) by Size, 2023 to 2033

Figure 98: Latin America Market Value (US$ Million) by Thickness, 2023 to 2033

Figure 99: Latin America Market Value (US$ Million) by Grade, 2023 to 2033

Figure 100: Latin America Market Value (US$ Million) by Wood Type, 2023 to 2033

Figure 101: Latin America Market Value (US$ Million) by Number of Ply, 2023 to 2033

Figure 102: Latin America Market Value (US$ Million) by Sales Channel, 2023 to 2033

Figure 103: Latin America Market Value (US$ Million) by Application, 2023 to 2033

Figure 104: Latin America Market Value (US$ Million) by Country, 2023 to 2033

Figure 105: Latin America Market Value (US$ Million) Analysis by Country, 2017 to 2033

Figure 106: Latin America Market Volume ('000 Cubic Meters) Analysis by Country, 2017 to 2033

Figure 107: Latin America Market Value Share (%) and BPS Analysis by Country, 2023 to 2033

Figure 108: Latin America Market Y-o-Y Growth (%) Projections by Country, 2023 to 2033

Figure 109: Latin America Market Value (US$ Million) Analysis by Size, 2017 to 2033

Figure 110: Latin America Market Volume ('000 Cubic Meters) Analysis by Size, 2017 to 2033

Figure 111: Latin America Market Value Share (%) and BPS Analysis by Size, 2023 to 2033

Figure 112: Latin America Market Y-o-Y Growth (%) Projections by Size, 2023 to 2033

Figure 113: Latin America Market Value (US$ Million) Analysis by Thickness, 2017 to 2033

Figure 114: Latin America Market Volume ('000 Cubic Meters) Analysis by Thickness, 2017 to 2033

Figure 115: Latin America Market Value Share (%) and BPS Analysis by Thickness, 2023 to 2033

Figure 116: Latin America Market Y-o-Y Growth (%) Projections by Thickness, 2023 to 2033

Figure 117: Latin America Market Value (US$ Million) Analysis by Grade, 2017 to 2033

Figure 118: Latin America Market Volume ('000 Cubic Meters) Analysis by Grade, 2017 to 2033

Figure 119: Latin America Market Value Share (%) and BPS Analysis by Grade, 2023 to 2033

Figure 120: Latin America Market Y-o-Y Growth (%) Projections by Grade, 2023 to 2033

Figure 121: Latin America Market Value (US$ Million) Analysis by Wood Type, 2017 to 2033

Figure 122: Latin America Market Volume ('000 Cubic Meters) Analysis by Wood Type, 2017 to 2033

Figure 123: Latin America Market Value Share (%) and BPS Analysis by Wood Type, 2023 to 2033

Figure 124: Latin America Market Y-o-Y Growth (%) Projections by Wood Type, 2023 to 2033

Figure 125: Latin America Market Value (US$ Million) Analysis by Number of Ply, 2017 to 2033

Figure 126: Latin America Market Volume ('000 Cubic Meters) Analysis by Number of Ply, 2017 to 2033

Figure 127: Latin America Market Value Share (%) and BPS Analysis by Number of Ply, 2023 to 2033

Figure 128: Latin America Market Y-o-Y Growth (%) Projections by Number of Ply, 2023 to 2033

Figure 129: Latin America Market Value (US$ Million) Analysis by Sales Channel, 2017 to 2033

Figure 130: Latin America Market Volume ('000 Cubic Meters) Analysis by Sales Channel, 2017 to 2033

Figure 131: Latin America Market Value Share (%) and BPS Analysis by Sales Channel, 2023 to 2033

Figure 132: Latin America Market Y-o-Y Growth (%) Projections by Sales Channel, 2023 to 2033

Figure 133: Latin America Market Value (US$ Million) Analysis by Application, 2017 to 2033

Figure 134: Latin America Market Volume ('000 Cubic Meters) Analysis by Application, 2017 to 2033

Figure 135: Latin America Market Value Share (%) and BPS Analysis by Application, 2023 to 2033

Figure 136: Latin America Market Y-o-Y Growth (%) Projections by Application, 2023 to 2033

Figure 137: Latin America Market Attractiveness by Size, 2023 to 2033

Figure 138: Latin America Market Attractiveness by Thickness, 2023 to 2033

Figure 139: Latin America Market Attractiveness by Grade, 2023 to 2033

Figure 140: Latin America Market Attractiveness by Wood Type, 2023 to 2033

Figure 141: Latin America Market Attractiveness by Number of Ply, 2023 to 2033

Figure 142: Latin America Market Attractiveness by Sales Channel, 2023 to 2033

Figure 143: Latin America Market Attractiveness by Application, 2023 to 2033

Figure 144: Latin America Market Attractiveness by Country, 2023 to 2033

Figure 145: Western Europe Market Value (US$ Million) by Size, 2023 to 2033

Figure 146: Western Europe Market Value (US$ Million) by Thickness, 2023 to 2033

Figure 147: Western Europe Market Value (US$ Million) by Grade, 2023 to 2033

Figure 148: Western Europe Market Value (US$ Million) by Wood Type, 2023 to 2033

Figure 149: Western Europe Market Value (US$ Million) by Number of Ply, 2023 to 2033

Figure 150: Western Europe Market Value (US$ Million) by Sales Channel, 2023 to 2033

Figure 151: Western Europe Market Value (US$ Million) by Application, 2023 to 2033

Figure 152: Western Europe Market Value (US$ Million) by Country, 2023 to 2033

Figure 153: Western Europe Market Value (US$ Million) Analysis by Country, 2017 to 2033

Figure 154: Western Europe Market Volume ('000 Cubic Meters) Analysis by Country, 2017 to 2033

Figure 155: Western Europe Market Value Share (%) and BPS Analysis by Country, 2023 to 2033

Figure 156: Western Europe Market Y-o-Y Growth (%) Projections by Country, 2023 to 2033

Figure 157: Western Europe Market Value (US$ Million) Analysis by Size, 2017 to 2033

Figure 158: Western Europe Market Volume ('000 Cubic Meters) Analysis by Size, 2017 to 2033

Figure 159: Western Europe Market Value Share (%) and BPS Analysis by Size, 2023 to 2033

Figure 160: Western Europe Market Y-o-Y Growth (%) Projections by Size, 2023 to 2033

Figure 161: Western Europe Market Value (US$ Million) Analysis by Thickness, 2017 to 2033

Figure 162: Western Europe Market Volume ('000 Cubic Meters) Analysis by Thickness, 2017 to 2033

Figure 163: Western Europe Market Value Share (%) and BPS Analysis by Thickness, 2023 to 2033

Figure 164: Western Europe Market Y-o-Y Growth (%) Projections by Thickness, 2023 to 2033

Figure 165: Western Europe Market Value (US$ Million) Analysis by Grade, 2017 to 2033

Figure 166: Western Europe Market Volume ('000 Cubic Meters) Analysis by Grade, 2017 to 2033

Figure 167: Western Europe Market Value Share (%) and BPS Analysis by Grade, 2023 to 2033

Figure 168: Western Europe Market Y-o-Y Growth (%) Projections by Grade, 2023 to 2033

Figure 169: Western Europe Market Value (US$ Million) Analysis by Wood Type, 2017 to 2033

Figure 170: Western Europe Market Volume ('000 Cubic Meters) Analysis by Wood Type, 2017 to 2033

Figure 171: Western Europe Market Value Share (%) and BPS Analysis by Wood Type, 2023 to 2033

Figure 172: Western Europe Market Y-o-Y Growth (%) Projections by Wood Type, 2023 to 2033

Figure 173: Western Europe Market Value (US$ Million) Analysis by Number of Ply, 2017 to 2033

Figure 174: Western Europe Market Volume ('000 Cubic Meters) Analysis by Number of Ply, 2017 to 2033

Figure 175: Western Europe Market Value Share (%) and BPS Analysis by Number of Ply, 2023 to 2033

Figure 176: Western Europe Market Y-o-Y Growth (%) Projections by Number of Ply, 2023 to 2033

Figure 177: Western Europe Market Value (US$ Million) Analysis by Sales Channel, 2017 to 2033

Figure 178: Western Europe Market Volume ('000 Cubic Meters) Analysis by Sales Channel, 2017 to 2033

Figure 179: Western Europe Market Value Share (%) and BPS Analysis by Sales Channel, 2023 to 2033

Figure 180: Western Europe Market Y-o-Y Growth (%) Projections by Sales Channel, 2023 to 2033

Figure 181: Western Europe Market Value (US$ Million) Analysis by Application, 2017 to 2033

Figure 182: Western Europe Market Volume ('000 Cubic Meters) Analysis by Application, 2017 to 2033

Figure 183: Western Europe Market Value Share (%) and BPS Analysis by Application, 2023 to 2033

Figure 184: Western Europe Market Y-o-Y Growth (%) Projections by Application, 2023 to 2033

Figure 185: Western Europe Market Attractiveness by Size, 2023 to 2033

Figure 186: Western Europe Market Attractiveness by Thickness, 2023 to 2033

Figure 187: Western Europe Market Attractiveness by Grade, 2023 to 2033

Figure 188: Western Europe Market Attractiveness by Wood Type, 2023 to 2033

Figure 189: Western Europe Market Attractiveness by Number of Ply, 2023 to 2033

Figure 190: Western Europe Market Attractiveness by Sales Channel, 2023 to 2033

Figure 191: Western Europe Market Attractiveness by Application, 2023 to 2033

Figure 192: Western Europe Market Attractiveness by Country, 2023 to 2033

Figure 193: Eastern Europe Market Value (US$ Million) by Size, 2023 to 2033

Figure 194: Eastern Europe Market Value (US$ Million) by Thickness, 2023 to 2033

Figure 195: Eastern Europe Market Value (US$ Million) by Grade, 2023 to 2033

Figure 196: Eastern Europe Market Value (US$ Million) by Wood Type, 2023 to 2033

Figure 197: Eastern Europe Market Value (US$ Million) by Number of Ply, 2023 to 2033

Figure 198: Eastern Europe Market Value (US$ Million) by Sales Channel, 2023 to 2033

Figure 199: Eastern Europe Market Value (US$ Million) by Application, 2023 to 2033

Figure 200: Eastern Europe Market Value (US$ Million) by Country, 2023 to 2033

Figure 201: Eastern Europe Market Value (US$ Million) Analysis by Country, 2017 to 2033

Figure 202: Eastern Europe Market Volume ('000 Cubic Meters) Analysis by Country, 2017 to 2033

Figure 203: Eastern Europe Market Value Share (%) and BPS Analysis by Country, 2023 to 2033

Figure 204: Eastern Europe Market Y-o-Y Growth (%) Projections by Country, 2023 to 2033

Figure 205: Eastern Europe Market Value (US$ Million) Analysis by Size, 2017 to 2033

Figure 206: Eastern Europe Market Volume ('000 Cubic Meters) Analysis by Size, 2017 to 2033

Figure 207: Eastern Europe Market Value Share (%) and BPS Analysis by Size, 2023 to 2033

Figure 208: Eastern Europe Market Y-o-Y Growth (%) Projections by Size, 2023 to 2033

Figure 209: Eastern Europe Market Value (US$ Million) Analysis by Thickness, 2017 to 2033

Figure 210: Eastern Europe Market Volume ('000 Cubic Meters) Analysis by Thickness, 2017 to 2033

Figure 211: Eastern Europe Market Value Share (%) and BPS Analysis by Thickness, 2023 to 2033

Figure 212: Eastern Europe Market Y-o-Y Growth (%) Projections by Thickness, 2023 to 2033

Figure 213: Eastern Europe Market Value (US$ Million) Analysis by Grade, 2017 to 2033

Figure 214: Eastern Europe Market Volume ('000 Cubic Meters) Analysis by Grade, 2017 to 2033

Figure 215: Eastern Europe Market Value Share (%) and BPS Analysis by Grade, 2023 to 2033

Figure 216: Eastern Europe Market Y-o-Y Growth (%) Projections by Grade, 2023 to 2033

Figure 217: Eastern Europe Market Value (US$ Million) Analysis by Wood Type, 2017 to 2033

Figure 218: Eastern Europe Market Volume ('000 Cubic Meters) Analysis by Wood Type, 2017 to 2033

Figure 219: Eastern Europe Market Value Share (%) and BPS Analysis by Wood Type, 2023 to 2033

Figure 220: Eastern Europe Market Y-o-Y Growth (%) Projections by Wood Type, 2023 to 2033

Figure 221: Eastern Europe Market Value (US$ Million) Analysis by Number of Ply, 2017 to 2033

Figure 222: Eastern Europe Market Volume ('000 Cubic Meters) Analysis by Number of Ply, 2017 to 2033

Figure 223: Eastern Europe Market Value Share (%) and BPS Analysis by Number of Ply, 2023 to 2033

Figure 224: Eastern Europe Market Y-o-Y Growth (%) Projections by Number of Ply, 2023 to 2033

Figure 225: Eastern Europe Market Value (US$ Million) Analysis by Sales Channel, 2017 to 2033

Figure 226: Eastern Europe Market Volume ('000 Cubic Meters) Analysis by Sales Channel, 2017 to 2033

Figure 227: Eastern Europe Market Value Share (%) and BPS Analysis by Sales Channel, 2023 to 2033

Figure 228: Eastern Europe Market Y-o-Y Growth (%) Projections by Sales Channel, 2023 to 2033

Figure 229: Eastern Europe Market Value (US$ Million) Analysis by Application, 2017 to 2033

Figure 230: Eastern Europe Market Volume ('000 Cubic Meters) Analysis by Application, 2017 to 2033

Figure 231: Eastern Europe Market Value Share (%) and BPS Analysis by Application, 2023 to 2033

Figure 232: Eastern Europe Market Y-o-Y Growth (%) Projections by Application, 2023 to 2033

Figure 233: Eastern Europe Market Attractiveness by Size, 2023 to 2033

Figure 234: Eastern Europe Market Attractiveness by Thickness, 2023 to 2033

Figure 235: Eastern Europe Market Attractiveness by Grade, 2023 to 2033

Figure 236: Eastern Europe Market Attractiveness by Wood Type, 2023 to 2033

Figure 237: Eastern Europe Market Attractiveness by Number of Ply, 2023 to 2033

Figure 238: Eastern Europe Market Attractiveness by Sales Channel, 2023 to 2033

Figure 239: Eastern Europe Market Attractiveness by Application, 2023 to 2033

Figure 240: Eastern Europe Market Attractiveness by Country, 2023 to 2033

Figure 241: APEJ Market Value (US$ Million) by Size, 2023 to 2033

Figure 242: APEJ Market Value (US$ Million) by Thickness, 2023 to 2033

Figure 243: APEJ Market Value (US$ Million) by Grade, 2023 to 2033

Figure 244: APEJ Market Value (US$ Million) by Wood Type, 2023 to 2033

Figure 245: APEJ Market Value (US$ Million) by Number of Ply, 2023 to 2033

Figure 246: APEJ Market Value (US$ Million) by Sales Channel, 2023 to 2033

Figure 247: APEJ Market Value (US$ Million) by Application, 2023 to 2033

Figure 248: APEJ Market Value (US$ Million) by Country, 2023 to 2033

Figure 249: APEJ Market Value (US$ Million) Analysis by Country, 2017 to 2033

Figure 250: APEJ Market Volume ('000 Cubic Meters) Analysis by Country, 2017 to 2033

Figure 251: APEJ Market Value Share (%) and BPS Analysis by Country, 2023 to 2033

Figure 252: APEJ Market Y-o-Y Growth (%) Projections by Country, 2023 to 2033

Figure 253: APEJ Market Value (US$ Million) Analysis by Size, 2017 to 2033

Figure 254: APEJ Market Volume ('000 Cubic Meters) Analysis by Size, 2017 to 2033

Figure 255: APEJ Market Value Share (%) and BPS Analysis by Size, 2023 to 2033

Figure 256: APEJ Market Y-o-Y Growth (%) Projections by Size, 2023 to 2033

Figure 257: APEJ Market Value (US$ Million) Analysis by Thickness, 2017 to 2033

Figure 258: APEJ Market Volume ('000 Cubic Meters) Analysis by Thickness, 2017 to 2033

Figure 259: APEJ Market Value Share (%) and BPS Analysis by Thickness, 2023 to 2033

Figure 260: APEJ Market Y-o-Y Growth (%) Projections by Thickness, 2023 to 2033

Figure 261: APEJ Market Value (US$ Million) Analysis by Grade, 2017 to 2033

Figure 262: APEJ Market Volume ('000 Cubic Meters) Analysis by Grade, 2017 to 2033

Figure 263: APEJ Market Value Share (%) and BPS Analysis by Grade, 2023 to 2033

Figure 264: APEJ Market Y-o-Y Growth (%) Projections by Grade, 2023 to 2033

Figure 265: APEJ Market Value (US$ Million) Analysis by Wood Type, 2017 to 2033

Figure 266: APEJ Market Volume ('000 Cubic Meters) Analysis by Wood Type, 2017 to 2033

Figure 267: APEJ Market Value Share (%) and BPS Analysis by Wood Type, 2023 to 2033

Figure 268: APEJ Market Y-o-Y Growth (%) Projections by Wood Type, 2023 to 2033

Figure 269: APEJ Market Value (US$ Million) Analysis by Number of Ply, 2017 to 2033

Figure 270: APEJ Market Volume ('000 Cubic Meters) Analysis by Number of Ply, 2017 to 2033

Figure 271: APEJ Market Value Share (%) and BPS Analysis by Number of Ply, 2023 to 2033

Figure 272: APEJ Market Y-o-Y Growth (%) Projections by Number of Ply, 2023 to 2033

Figure 273: APEJ Market Value (US$ Million) Analysis by Sales Channel, 2017 to 2033

Figure 274: APEJ Market Volume ('000 Cubic Meters) Analysis by Sales Channel, 2017 to 2033

Figure 275: APEJ Market Value Share (%) and BPS Analysis by Sales Channel, 2023 to 2033

Figure 276: APEJ Market Y-o-Y Growth (%) Projections by Sales Channel, 2023 to 2033

Figure 277: APEJ Market Value (US$ Million) Analysis by Application, 2017 to 2033

Figure 278: APEJ Market Volume ('000 Cubic Meters) Analysis by Application, 2017 to 2033

Figure 279: APEJ Market Value Share (%) and BPS Analysis by Application, 2023 to 2033

Figure 280: APEJ Market Y-o-Y Growth (%) Projections by Application, 2023 to 2033

Figure 281: APEJ Market Attractiveness by Size, 2023 to 2033

Figure 282: APEJ Market Attractiveness by Thickness, 2023 to 2033

Figure 283: APEJ Market Attractiveness by Grade, 2023 to 2033

Figure 284: APEJ Market Attractiveness by Wood Type, 2023 to 2033

Figure 285: APEJ Market Attractiveness by Number of Ply, 2023 to 2033

Figure 286: APEJ Market Attractiveness by Sales Channel, 2023 to 2033

Figure 287: APEJ Market Attractiveness by Application, 2023 to 2033

Figure 288: APEJ Market Attractiveness by Country, 2023 to 2033

Figure 289: Japan Market Value (US$ Million) by Size, 2023 to 2033

Figure 290: Japan Market Value (US$ Million) by Thickness, 2023 to 2033

Figure 291: Japan Market Value (US$ Million) by Grade, 2023 to 2033

Figure 292: Japan Market Value (US$ Million) by Wood Type, 2023 to 2033

Figure 293: Japan Market Value (US$ Million) by Number of Ply, 2023 to 2033

Figure 294: Japan Market Value (US$ Million) by Sales Channel, 2023 to 2033

Figure 295: Japan Market Value (US$ Million) by Application, 2023 to 2033

Figure 296: Japan Market Value (US$ Million) by Country, 2023 to 2033

Figure 297: Japan Market Value (US$ Million) Analysis by Country, 2017 to 2033

Figure 298: Japan Market Volume ('000 Cubic Meters) Analysis by Country, 2017 to 2033

Figure 299: Japan Market Value Share (%) and BPS Analysis by Country, 2023 to 2033

Figure 300: Japan Market Y-o-Y Growth (%) Projections by Country, 2023 to 2033

Figure 301: Japan Market Value (US$ Million) Analysis by Size, 2017 to 2033

Figure 302: Japan Market Volume ('000 Cubic Meters) Analysis by Size, 2017 to 2033

Figure 303: Japan Market Value Share (%) and BPS Analysis by Size, 2023 to 2033

Figure 304: Japan Market Y-o-Y Growth (%) Projections by Size, 2023 to 2033

Figure 305: Japan Market Value (US$ Million) Analysis by Thickness, 2017 to 2033

Figure 306: Japan Market Volume ('000 Cubic Meters) Analysis by Thickness, 2017 to 2033

Figure 307: Japan Market Value Share (%) and BPS Analysis by Thickness, 2023 to 2033

Figure 308: Japan Market Y-o-Y Growth (%) Projections by Thickness, 2023 to 2033

Figure 309: Japan Market Value (US$ Million) Analysis by Grade, 2017 to 2033

Figure 310: Japan Market Volume ('000 Cubic Meters) Analysis by Grade, 2017 to 2033

Figure 311: Japan Market Value Share (%) and BPS Analysis by Grade, 2023 to 2033

Figure 312: Japan Market Y-o-Y Growth (%) Projections by Grade, 2023 to 2033

Figure 313: Japan Market Value (US$ Million) Analysis by Wood Type, 2017 to 2033

Figure 314: Japan Market Volume ('000 Cubic Meters) Analysis by Wood Type, 2017 to 2033

Figure 315: Japan Market Value Share (%) and BPS Analysis by Wood Type, 2023 to 2033

Figure 316: Japan Market Y-o-Y Growth (%) Projections by Wood Type, 2023 to 2033

Figure 317: Japan Market Value (US$ Million) Analysis by Number of Ply, 2017 to 2033

Figure 318: Japan Market Volume ('000 Cubic Meters) Analysis by Number of Ply, 2017 to 2033

Figure 319: Japan Market Value Share (%) and BPS Analysis by Number of Ply, 2023 to 2033

Figure 320: Japan Market Y-o-Y Growth (%) Projections by Number of Ply, 2023 to 2033

Figure 321: Japan Market Value (US$ Million) Analysis by Sales Channel, 2017 to 2033

Figure 322: Japan Market Volume ('000 Cubic Meters) Analysis by Sales Channel, 2017 to 2033

Figure 323: Japan Market Value Share (%) and BPS Analysis by Sales Channel, 2023 to 2033

Figure 324: Japan Market Y-o-Y Growth (%) Projections by Sales Channel, 2023 to 2033

Figure 325: Japan Market Value (US$ Million) Analysis by Application, 2017 to 2033

Figure 326: Japan Market Volume ('000 Cubic Meters) Analysis by Application, 2017 to 2033

Figure 327: Japan Market Value Share (%) and BPS Analysis by Application, 2023 to 2033

Figure 328: Japan Market Y-o-Y Growth (%) Projections by Application, 2023 to 2033

Figure 329: Japan Market Attractiveness by Size, 2023 to 2033

Figure 330: Japan Market Attractiveness by Thickness, 2023 to 2033

Figure 331: Japan Market Attractiveness by Grade, 2023 to 2033

Figure 332: Japan Market Attractiveness by Wood Type, 2023 to 2033

Figure 333: Japan Market Attractiveness by Number of Ply, 2023 to 2033

Figure 334: Japan Market Attractiveness by Sales Channel, 2023 to 2033

Figure 335: Japan Market Attractiveness by Application, 2023 to 2033

Figure 336: Japan Market Attractiveness by Country, 2023 to 2033

Figure 337: Middle East & Africa Market Value (US$ Million) by Size, 2023 to 2033

Figure 338: Middle East & Africa Market Value (US$ Million) by Thickness, 2023 to 2033

Figure 339: Middle East & Africa Market Value (US$ Million) by Grade, 2023 to 2033

Figure 340: Middle East & Africa Market Value (US$ Million) by Wood Type, 2023 to 2033

Figure 341: Middle East & Africa Market Value (US$ Million) by Number of Ply, 2023 to 2033

Figure 342: Middle East & Africa Market Value (US$ Million) by Sales Channel, 2023 to 2033

Figure 343: Middle East & Africa Market Value (US$ Million) by Application, 2023 to 2033

Figure 344: Middle East & Africa Market Value (US$ Million) by Country, 2023 to 2033

Figure 345: Middle East & Africa Market Value (US$ Million) Analysis by Country, 2017 to 2033

Figure 346: Middle East & Africa Market Volume ('000 Cubic Meters) Analysis by Country, 2017 to 2033

Figure 347: Middle East & Africa Market Value Share (%) and BPS Analysis by Country, 2023 to 2033

Figure 348: Middle East & Africa Market Y-o-Y Growth (%) Projections by Country, 2023 to 2033

Figure 349: Middle East & Africa Market Value (US$ Million) Analysis by Size, 2017 to 2033

Figure 350: Middle East & Africa Market Volume ('000 Cubic Meters) Analysis by Size, 2017 to 2033

Figure 351: Middle East & Africa Market Value Share (%) and BPS Analysis by Size, 2023 to 2033

Figure 352: Middle East & Africa Market Y-o-Y Growth (%) Projections by Size, 2023 to 2033

Figure 353: Middle East & Africa Market Value (US$ Million) Analysis by Thickness, 2017 to 2033

Figure 354: Middle East & Africa Market Volume ('000 Cubic Meters) Analysis by Thickness, 2017 to 2033

Figure 355: Middle East & Africa Market Value Share (%) and BPS Analysis by Thickness, 2023 to 2033

Figure 356: Middle East & Africa Market Y-o-Y Growth (%) Projections by Thickness, 2023 to 2033

Figure 357: Middle East & Africa Market Value (US$ Million) Analysis by Grade, 2017 to 2033

Figure 358: Middle East & Africa Market Volume ('000 Cubic Meters) Analysis by Grade, 2017 to 2033

Figure 359: Middle East & Africa Market Value Share (%) and BPS Analysis by Grade, 2023 to 2033

Figure 360: Middle East & Africa Market Y-o-Y Growth (%) Projections by Grade, 2023 to 2033

Figure 361: Middle East & Africa Market Value (US$ Million) Analysis by Wood Type, 2017 to 2033

Figure 362: Middle East & Africa Market Volume ('000 Cubic Meters) Analysis by Wood Type, 2017 to 2033

Figure 363: Middle East & Africa Market Value Share (%) and BPS Analysis by Wood Type, 2023 to 2033

Figure 364: Middle East & Africa Market Y-o-Y Growth (%) Projections by Wood Type, 2023 to 2033

Figure 365: Middle East & Africa Market Value (US$ Million) Analysis by Number of Ply, 2017 to 2033

Figure 366: Middle East & Africa Market Volume ('000 Cubic Meters) Analysis by Number of Ply, 2017 to 2033

Figure 367: Middle East & Africa Market Value Share (%) and BPS Analysis by Number of Ply, 2023 to 2033

Figure 368: Middle East & Africa Market Y-o-Y Growth (%) Projections by Number of Ply, 2023 to 2033

Figure 369: Middle East & Africa Market Value (US$ Million) Analysis by Sales Channel, 2017 to 2033

Figure 370: Middle East & Africa Market Volume ('000 Cubic Meters) Analysis by Sales Channel, 2017 to 2033

Figure 371: Middle East & Africa Market Value Share (%) and BPS Analysis by Sales Channel, 2023 to 2033

Figure 372: Middle East & Africa Market Y-o-Y Growth (%) Projections by Sales Channel, 2023 to 2033

Figure 373: Middle East & Africa Market Value (US$ Million) Analysis by Application, 2017 to 2033

Figure 374: Middle East & Africa Market Volume ('000 Cubic Meters) Analysis by Application, 2017 to 2033

Figure 375: Middle East & Africa Market Value Share (%) and BPS Analysis by Application, 2023 to 2033

Figure 376: Middle East & Africa Market Y-o-Y Growth (%) Projections by Application, 2023 to 2033

Figure 377: Middle East & Africa Market Attractiveness by Size, 2023 to 2033

Figure 378: Middle East & Africa Market Attractiveness by Thickness, 2023 to 2033

Figure 379: Middle East & Africa Market Attractiveness by Grade, 2023 to 2033

Figure 380: Middle East & Africa Market Attractiveness by Wood Type, 2023 to 2033

Figure 381: Middle East & Africa Market Attractiveness by Number of Ply, 2023 to 2033

Figure 382: Middle East & Africa Market Attractiveness by Sales Channel, 2023 to 2033

Figure 383: Middle East & Africa Market Attractiveness by Application, 2023 to 2033

Figure 384: Middle East & Africa Market Attractiveness by Country, 2023 to 2033

Need specific information?

Request Customization

Explore Chemicals & Materials Insights

View Reports

Recommendations

Packaging

Wooden & Plywood Packaging Market

Published : July 2019

Packaging

Plywood Boxes Market

Published : December 2017

Google translate