Polyphenylene Market Size and Share Forecast Outlook From 2024 to 2034

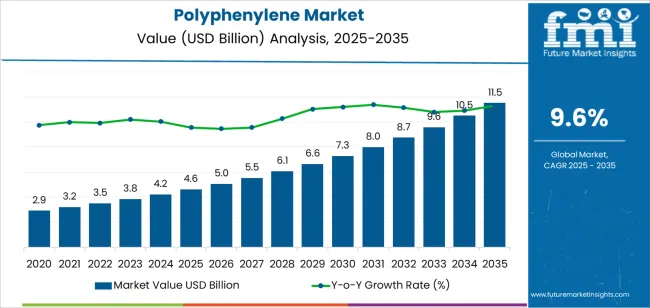
By 2034, the global polyphenylene market size is projected to grow from USD 4.2 billion in 2024 to USD 10.5 billion. The market is expected to expand at a notable CAGR of 9.6% from 2024 to 2034.

Due to its great mechanical strength, chemical inertness, and heat resistance, polyphenylene is a popular material among businesses needing strong, lightweight materials for a range of applications across various end-use industries.

In recognition of its exceptional mechanical, chemical inert, and heat resistance qualities, polyphenylene is growing in demand in electronics, aerospace, and the automotive industry. These sectors need high-performance, lightweight materials that can keep up with rapidly changing technological and engineering demands in the forthcoming decade.

Consumption Analysis of Polyphenylene

  • High-performance, environmentally friendly polymers are in greater demand; polyphenylene, particularly, is becoming increasingly well-liked in applications that need endurance and reliability because of its resilience to abrasive circumstances.
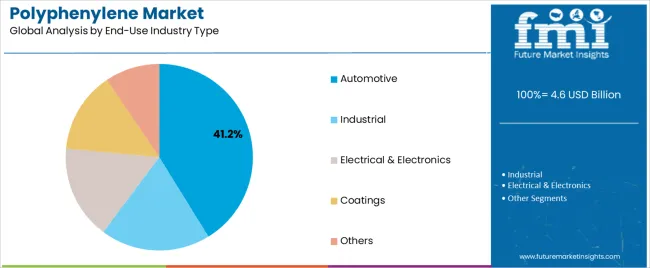
  • Polyphenylene materials are used in automotive applications because of their exceptional resistance to heat, chemicals, and mechanical stresses. The increased need for lightweight materials in the automotive sector due to fuel economy and pollution requirements is driving the demand for polyphenylene.
  • Polyphenylene compounds are employed in the electrical and electronics sectors due to their strong temperature resistance and electrical insulating properties. The growing need for renewable energy sources, electric vehicles, and consumer electronics is driving the demand for polyphenylene.
  • Aerospace applications benefit greatly from the strength and low weight of polyphenylene materials. The global expansion of the aircraft industry is driving the demand for materials that can achieve strict performance criteria, fueling the growth of the polyphenylene market.
  • The market for polyphenylene materials is expanding due to ongoing research and development efforts, which aim to improve properties, reduce manufacturing costs, and explore new applications, opening up novel commercial opportunities in various industries in the forthcoming decade.
Attributes Details
Polyphenylene Market Value for 2024 USD 4.2 billion
Polyphenylene Market Value for 2034 USD 10.5 billion
Polyphenylene Market Forecast CAGR for 2024 to 2034 9.6%

Comparison of Historical vs Future Outlook on Changing Consumer Trends for Polyphenylene Industry

This section thoroughly analyzes the industry during the previous five years, emphasizing the anticipated trends in the polyphenylene market. With a previously recorded historical compound annual growth rate of 10.4%, the market is gradually becoming more constrictive. The demand for polyphylene is expected to develop at a 9.6% CAGR through 2034.

Shortages of raw materials, supply chain disruptions, and unstable price dynamics that affect distribution and manufacturing are obstacles facing the global polyphenylene industry.

Historical CAGR 10.4%
Forecast CAGR 9.6%

The demand for polyphenylene is anticipated to face a slight decline. These possible reasons include:

  • The manufacturing of polyphenylene can be more expensive due to complex methods or costly chemicals, which can reduce the product's competitiveness in the market.
  • New environmental regulations and legislation can impact the manufacture and use of materials like polyphenylene, which can call for increased market engagement activities.
  • If polyphenylene's applications are more constrained than alternatives, it could require assistance expanding its market share.
  • Variations in the market can impact the availability and pricing of raw materials used to manufacture polyphenylene, which might impact total production costs and profitability.

Market participants must be astute and adaptive during the predicted duration, as these challenging characteristics set the market up for future progress.

Key Trends Reshaping the Polyphenylene Market Landscape

High Utilization in 3D Printing Skyrockets Global Polyphenylene Demand

The 3D printing industry, which is often referred to as additive manufacturing, has been investigating new materials to expand its potential. Polyphenylenes are a specific material that has been attracting interest. These materials are being evaluated for their potential utility in 3D printing, owing to their unique properties and characteristics.

The market expansion in the 3D printing industry can be largely attributed to the ability of polyphenylenes to offer customized solutions and produce intricate pieces. With their high thermal stability, excellent chemical resistance, and impressive mechanical properties, polyphenylenes have emerged as a promising option for 3D printing applications.

The ongoing research and development efforts in the 3D printing material industry are expected to advance the use of polyphenylenes in additive manufacturing, leading to new possibilities and opportunities in the 3D printing sector.

Rise in Miniaturization Expands the Demand for Polyphenylene

The need for materials that can provide better performance in lightweight, compact designs is rising as technology develops and electronic gadgets get compact. Polyphenylene materials have emerged as a popular choice for such applications due to their exceptional strength-to-weight ratio and thermal stability.

Polyphenylene has remarkable mechanical properties, making it ideal for small devices and components, such as smartphones, laptops, and wearable devices. In addition, polyphenylene materials have excellent chemical resistance and electrical insulation properties, further enhancing their suitability in various industries, including electronics, automotive, aerospace, and medical devices.

The market for polyphenylene materials is anticipated to grow over the forthcoming decade because of the need for premium materials that can handle the demands of miniaturization and compact design.

Expansion of Automobile, Electronics, and Aerostructure Sectors Boosts Product Demand

Polyphenylene materials are increasingly favored in automotive applications due to their outstanding mechanical, chemical, and thermal resistance, meeting industry demands for lightweight materials amidst emission and fuel economy regulations. Moreover, their electrical insulating properties and high-temperature tolerance make them vital in the electronics and electrical sectors, driven by the expanding consumer electronics market and the rise of electric cars and renewable energy sources.

Polyphenylenes' lightweight and robust nature makes them ideal for aerospace applications, meeting demanding performance standards as the aircraft sector expands globally, leading to an upsurge in their use for aerostructures. Polyphenylene's versatility and performance characteristics position it as a key material across diverse industries.

Polyphenylene Industry Analysis by Top Investment Segments

A comprehensive analysis of certain polyphenylene market segments is provided in this section. The polyphenylene sulfide and composite segments are the two primary areas of study. This section aims to give a deeper understanding of these segments and their significance within the broader framework of the polyphenylene industry through a thorough analysis.

Global Polyphenylene Market Craves For Polyphenylene Sulfide

Attributes Details
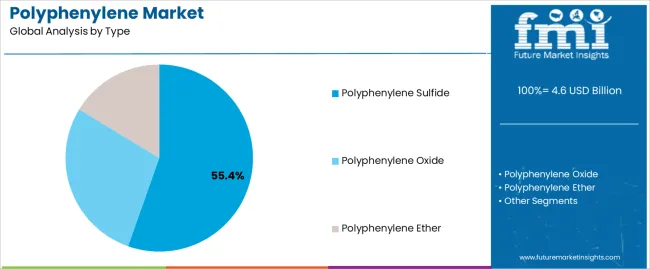
Top Type Polyphenylene Sulfide
CAGR from 2024 to 2034 9.5%

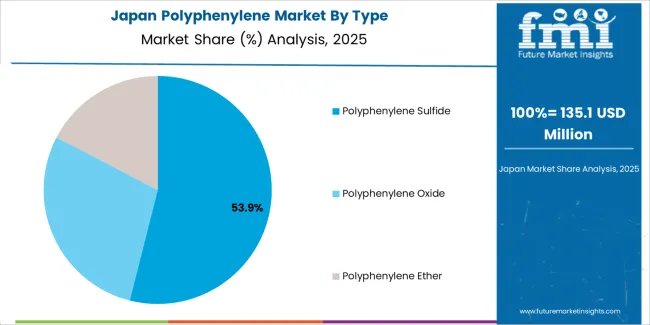
From 2024 to 2034, polyphenylene sulfide accounted for the leading share of the polyphenylene industry, expanding at a 9.5% CAGR. Compared to the previous CAGR of the PPS, which was 10.2% from 2019 to 2023, this represents a reduction. The following drivers can explain the evolution of the polyphenylene sulfide component segment:

  • The demand for polyphenylene sulfide coatings is predicted to expand due to their superior chemical and heat resistance and electrical qualities.
  • Because of its superior electrical insulating qualities, Polyphenylene Sulfide (PPS) is frequently used to produce coil formers, bobbins, relay components, and terminal blocks.
  • Polyphenylene sulfide (PPS) is expected to witness greater global demand due to its widespread use as a foundation material for producing specialized membranes, slurry coatings, and high-temperature air filters.

Polyphenylene Composites Skyrockets in the Global Polyphenylene Market

Attributes Details
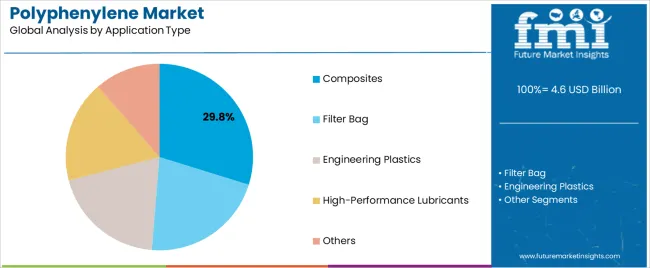
Top Application Type Composites
CAGR from 2024 to 2034 9.4%

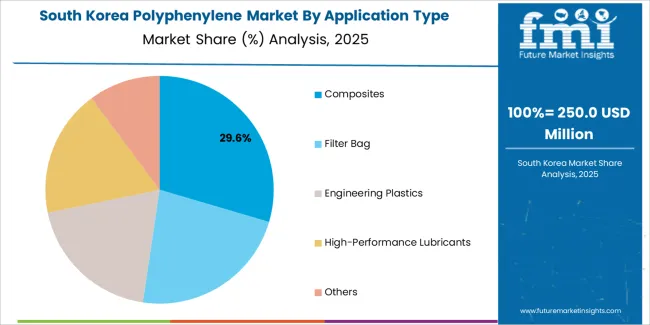
Forecasts indicate that the polyphenylene composites category is going to lead the market, growing at a noteworthy 9.4% CAGR from 2024 to 2034. These factors contribute to the rise of polyphenylene composites for polyphenylenes:

  • Polyphenylene composites offer higher strength, stiffness, and impact resistance than traditional materials, making their consumer base robust in the global polyphenylene industry.
  • Polyphenylene composites are highly sought after because they are lightweight, making them ideal for applications requiring reduced weight without compromising performance, thus driving the demand for polyphenylene composites from multiple industries.
  • Due to their exceptional chemical resistance, polyphenylene composites are suited for severe situations, making them ideal for consumer goods applications and boosting market growth.
  • Polymer composites can be used in a wider range of high-temperature applications because they retain their mechanical characteristics at high temperatures, propelling demand from the automotive and aerospace sectors.
  • Because of its adaptability, polyphenylene composites are used in various sectors, including consumer goods, automotive, aerospace, and electronics, fueling the market's expansion.

Analysis of Top Countries, Producing and Using Polyphenylene Compounds

The United States, China, Japan, South Korea, and the United Kingdom are some of the most predominant nations on the global stage, and this section anticipates looking at their polyphenylene sectors. Examine the several aspects influencing these nations' need for, acceptance of, and interactions with polyphenylenes by a thorough investigation.

Countries CAGR from 2024 to 2034
United States 9.9%
Japan 10.8%
United Kingdom 10.7%
South Korea 11.2%
China 10.5%

Rising Demand for Engineering Thermoplastics Bolsters Market Growth in the United States

The polyphenylene industry in the United States is expected to witness steady expansion, with a CAGR of 25.0% until 2034. With moderate growth, the industry is projected to reach a valuation of USD 7.6 billion by 2034. The following factors are driving the demand for Polyphenylenes, which is likely to play a crucial role in the growth of the industry:

  • Polyphenylene and other engineering thermoplastics are in high demand because the United States' thriving automobile sector uses them for interior parts, electrical systems, and under-the-hood components.
  • The United States automobile and aerospace industries strongly emphasize reducing emissions and fuel economy, which is driving demand for lightweight materials like polyphenylene to replace conventional metal components.
  • The need for engineering thermoplastics, such as polyphenylene, in demanding applications in the United States is driven by the requirement for materials with exceptional mechanical qualities, chemical resistance, and thermal stability.

Expanding Automobile Sector Fuels Demand in the United Kingdom

The demand for polyphenylene in the United Kingdom is expected to surge with an estimated CAGR of 10.7% until 2034. The industry has already shown significant potential, with a CAGR of 14.4% between 2019 and 2023. The market is projected to be valued at USD 417.9 million by 2034, indicating a vast potential for growth and investment in the polyphenylene sector. Here are a few of the key trends:

  • The United Kingdom's automobile sector increasingly uses polyphenylene in lightweight projects to increase fuel economy and cut emissions.
  • Owing to ongoing research and development activities in the United Kingdom, the performance and capacities of polyphenylene materials are improved, making them more appropriate for use in automotive applications.
  • In the United Kingdom's automotive industry, consumer demands for environmentally friendly and fuel-efficient automobiles drive demand for polyphenylene even further.

Chinese Polyphenylene Industry Upholds Chemical-Resistant Polymers Advancements

China's polyphenylene industry is witnessing a significant surge in demand at a predicted CAGR of 10.5%. Experts anticipate reaching a valuation of USD 1.7 billion by the year 2034. Among the main trends are:

  • The polyphenylene industry in China invests greatly in research and development to improve the chemical resistance of polymers, making them more suitable for a wider range of uses.
  • Collaborations between Chinese academic institutions and business enterprises promote innovation and information sharing in creating chemically resistant polymers.
  • The Chinese polyphenylene industry is seeing increased investment and innovation due to the increased need for chemical-resistant polymers in the electronics, automotive, and healthcare sectors.
  • In China's polyphenylene industry, the development of chemically resistant polymers is driven by the need to comply with strict rules and requirements for chemical safety and environmental protection.

Developments in the Thermoplastic Polymers Surges Sales in Japan

The demand for polyphenylenes in Japan is soaring dramatically, increasing at a CAGR of 10.8% through 2034. The market in Japan is anticipated to be valued at around USD 1.1 billion by 2034. Among the main motivators are:

  • Technological advancements in thermoplastic polymer production processes and materials favor market growth due to Japan's emphasis on the research and development of polyphenylene.
  • Government incentives and a favorable regulatory framework encourage investment in Japan's high-performance, environmentally friendly thermoplastic polymers.
  • The desire for creative, eco-friendly goods and rising consumer awareness drive the growth of thermoplastic polymers in the Japanese polyphenylene industry.

South Korean Polyphenylene Demand Develops in Forthcoming Decade

The sales for polyphenylenes in South Korea are predicted to rise significantly with a potential CAGR of 11.2% by 2034. This growth is anticipated to translate into a valuation of USD 11.2 million. Here are a few of the key trends:
  • The performance of thermoplastic materials such as polyphenylene continues to improve via continuous innovation in engineering and research & development, and their uses spread throughout various sectors in South Korea.
  • Technological developments in polymer synthesis and processing have enabled the South Korean industry to produce polymers that exhibit improved chemical resistance.
  • Lightweight materials like polyphenylene are being adopted to satisfy sustainability standards and lower the carbon footprint of automobiles due to South Korea's strict emissions restrictions.

Key Players and Market Concentration in the Polyphenylene Industry

Manufacturers of polyphenylene are expected to be crucial in determining the direction of the polyphenylene industry over the next decade through various activities. Businesses that make expenditures on research and development are going to boost innovation and create new polyphenylene grades with improved qualities and applications.

Organizations prioritizing sustainability are expected to lead in creating eco-friendly polyphenylene materials by employing recycled resources and green production techniques. By increasing their presence in developing countries, businesses are expected to drive up demand for polyphenylene and meet changing industry and consumer demands. Corporations using cutting-edge technology like compounding methods and additive manufacturing are setting up new applications for polyphenylene.

Market players intend to promote cooperation and hasten polyphenylene use in various industries by establishing strategic alliances with vendors, clients, and academic institutions. Generally, firms prioritizing sustainability, innovation, and market growth are anticipated to greatly impact the polyphenylene industry's development over the forthcoming decade.

Recent Developments in the Polyphenylene Industry

  • In December 2023, Toray Industries, Inc. obtained ISCC PLUS certification for its Korean subsidiary, Toray Advanced Materials Korea Inc., for its PPS resin produced at its Gunsan plant, promoting sustainable, deforestation-free, and climate-friendly supply chains.
  • In September 2023, Solvay obtained ISCC Plus certification for its polyphenylene sulfide manufacturing facilities in Texas and Belgium, enabling it to track circular or bio-based content in its value chain.
  • In September 2023, At Fakuma, Asahi Kasei, a Japanese technology business, presented various material solutions for safer and more compact electric vehicle batteries, enhanced connectivity, lightweight designs, and a circular economy.

Leading Suppliers in the Global Polyphenylene Market

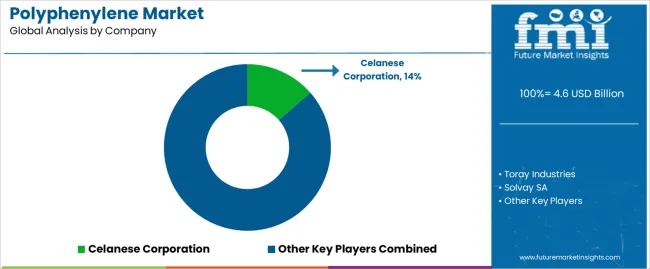
  • Celanese Corporation
  • Toray Industries
  • Solvay SA
  • Tosoh Corporation
  • DIC Corporation
  • Kureha Corporation
  • Saudi Basic Industries Corporation (SABIC)
  • Sumitomo Chemical Co., Ltd.
  • Polyplastics Co., Ltd.
  • LG Chem Ltd.
  • China Lumena New Materials Corp.

Key Shifting Preferences Covered in the Polyphenylene Market Report

  • Polyphenylene Ether (PPE) Alloy Market Trends
  • Opportunity Analysis in the Polyphenylene Market
  • Top 10 Companies in Polyphenylene Market
  • Development of Polyphenylene Resin Market
  • Top developments of the High Performance Lubricants

Top Segments Studied in the Polyphenylene Market

By Type:

  • Polyphenylene Sulfide
  • Polyphenylene Oxide
  • Polyphenylene Ether

By Application Type:

  • Composites
  • Filter Bag
  • Engineering Plastics
  • High-Performance Lubricants
  • Others

By End-Use Industry Type:

  • Automotive
  • Industrial
  • Electrical & Electronics
  • Coatings
  • Others

By Region:

  • North America
  • Latin America
  • Europe
  • East Asia
  • South Asia
  • Oceania
  • Middle East and Africa

Table of Content

  • 1. Executive Summary
  • 2. Market Overview
  • 3. Market Background
  • 4. Global Market Analysis 2019 to 2023 and Forecast, 2024 to 2034
  • 5. Global Market Analysis 2019 to 2023 and Forecast 2024 to 2034, By Type
    • 5.1. Sulfide
    • 5.2. Oxide
    • 5.3. Ether
  • 6. Global Market Analysis 2019 to 2023 and Forecast 2024 to 2034, By Application Type
    • 6.1. Composites
    • 6.2. Filter Bag
    • 6.3. Engineering Plastics
    • 6.4. High-Performance Lubricants
    • 6.5. Others
  • 7. Global Market Analysis 2019 to 2023 and Forecast 2024 to 2034, By End-Use Industry Type
    • 7.1. Automotive
    • 7.2. Industrial
    • 7.3. Electrical & Electronics
    • 7.4. Coatings
    • 7.5. Others
  • 8. Global Market Analysis 2019 to 2023 and Forecast 2024 to 2034, By Region
    • 8.1. North America
    • 8.2. Latin America
    • 8.3. Western Europe
    • 8.4. Eastern Europe
    • 8.5. South Asia and Pacific
    • 8.6. East Asia
    • 8.7. Middle East and Africa
  • 9. North America Market Analysis 2019 to 2023 and Forecast 2024 to 2034, By Country
  • 10. Latin America Market Analysis 2019 to 2023 and Forecast 2024 to 2034, By Country
  • 11. Western Europe Market Analysis 2019 to 2023 and Forecast 2024 to 2034, By Country
  • 12. Eastern Europe Market Analysis 2019 to 2023 and Forecast 2024 to 2034, By Country
  • 13. South Asia and Pacific Market Analysis 2019 to 2023 and Forecast 2024 to 2034, By Country
  • 14. East Asia Market Analysis 2019 to 2023 and Forecast 2024 to 2034, By Country
  • 15. Middle East and Africa Market Analysis 2019 to 2023 and Forecast 2024 to 2034, By Country
  • 16. Key Countries Market Analysis
  • 17. Market Structure Analysis
  • 18. Competition Analysis
    • 18.1. Toray Industries
    • 18.2. Solvay SA
    • 18.3. Tosoh Corporation
    • 18.4. DIC Corporation
    • 18.5. Kureha Corporation
    • 18.6. LG Chem Ltd.
    • 18.7. Celanese Corporation
    • 18.8. Saudi Arabia Basic Industries Corporation (SABIC)
    • 18.9. Lion Idemitsu Composites
  • 19. Assumptions & Acronyms Used
  • 20. Research Methodology

List of Tables

Table 1: Global Market Value (US$ Million) Forecast by Region, 2019 to 2034

Table 2: Global Market Volume (Tons) Forecast by Region, 2019 to 2034

Table 3: Global Market Value (US$ Million) Forecast by Type, 2019 to 2034

Table 4: Global Market Volume (Tons) Forecast by Type, 2019 to 2034

Table 5: Global Market Value (US$ Million) Forecast by Application Type, 2019 to 2034

Table 6: Global Market Volume (Tons) Forecast by Application Type, 2019 to 2034

Table 7: Global Market Value (US$ Million) Forecast by End-Use Industry Type, 2019 to 2034

Table 8: Global Market Volume (Tons) Forecast by End-Use Industry Type, 2019 to 2034

Table 9: North America Market Value (US$ Million) Forecast by Country, 2019 to 2034

Table 10: North America Market Volume (Tons) Forecast by Country, 2019 to 2034

Table 11: North America Market Value (US$ Million) Forecast by Type, 2019 to 2034

Table 12: North America Market Volume (Tons) Forecast by Type, 2019 to 2034

Table 13: North America Market Value (US$ Million) Forecast by Application Type, 2019 to 2034

Table 14: North America Market Volume (Tons) Forecast by Application Type, 2019 to 2034

Table 15: North America Market Value (US$ Million) Forecast by End-Use Industry Type, 2019 to 2034

Table 16: North America Market Volume (Tons) Forecast by End-Use Industry Type, 2019 to 2034

Table 17: Latin America Market Value (US$ Million) Forecast by Country, 2019 to 2034

Table 18: Latin America Market Volume (Tons) Forecast by Country, 2019 to 2034

Table 19: Latin America Market Value (US$ Million) Forecast by Type, 2019 to 2034

Table 20: Latin America Market Volume (Tons) Forecast by Type, 2019 to 2034

Table 21: Latin America Market Value (US$ Million) Forecast by Application Type, 2019 to 2034

Table 22: Latin America Market Volume (Tons) Forecast by Application Type, 2019 to 2034

Table 23: Latin America Market Value (US$ Million) Forecast by End-Use Industry Type, 2019 to 2034

Table 24: Latin America Market Volume (Tons) Forecast by End-Use Industry Type, 2019 to 2034

Table 25: Western Europe Market Value (US$ Million) Forecast by Country, 2019 to 2034

Table 26: Western Europe Market Volume (Tons) Forecast by Country, 2019 to 2034

Table 27: Western Europe Market Value (US$ Million) Forecast by Type, 2019 to 2034

Table 28: Western Europe Market Volume (Tons) Forecast by Type, 2019 to 2034

Table 29: Western Europe Market Value (US$ Million) Forecast by Application Type, 2019 to 2034

Table 30: Western Europe Market Volume (Tons) Forecast by Application Type, 2019 to 2034

Table 31: Western Europe Market Value (US$ Million) Forecast by End-Use Industry Type, 2019 to 2034

Table 32: Western Europe Market Volume (Tons) Forecast by End-Use Industry Type, 2019 to 2034

Table 33: Eastern Europe Market Value (US$ Million) Forecast by Country, 2019 to 2034

Table 34: Eastern Europe Market Volume (Tons) Forecast by Country, 2019 to 2034

Table 35: Eastern Europe Market Value (US$ Million) Forecast by Type, 2019 to 2034

Table 36: Eastern Europe Market Volume (Tons) Forecast by Type, 2019 to 2034

Table 37: Eastern Europe Market Value (US$ Million) Forecast by Application Type, 2019 to 2034

Table 38: Eastern Europe Market Volume (Tons) Forecast by Application Type, 2019 to 2034

Table 39: Eastern Europe Market Value (US$ Million) Forecast by End-Use Industry Type, 2019 to 2034

Table 40: Eastern Europe Market Volume (Tons) Forecast by End-Use Industry Type, 2019 to 2034

Table 41: South Asia and Pacific Market Value (US$ Million) Forecast by Country, 2019 to 2034

Table 42: South Asia and Pacific Market Volume (Tons) Forecast by Country, 2019 to 2034

Table 43: South Asia and Pacific Market Value (US$ Million) Forecast by Type, 2019 to 2034

Table 44: South Asia and Pacific Market Volume (Tons) Forecast by Type, 2019 to 2034

Table 45: South Asia and Pacific Market Value (US$ Million) Forecast by Application Type, 2019 to 2034

Table 46: South Asia and Pacific Market Volume (Tons) Forecast by Application Type, 2019 to 2034

Table 47: South Asia and Pacific Market Value (US$ Million) Forecast by End-Use Industry Type, 2019 to 2034

Table 48: South Asia and Pacific Market Volume (Tons) Forecast by End-Use Industry Type, 2019 to 2034

Table 49: East Asia Market Value (US$ Million) Forecast by Country, 2019 to 2034

Table 50: East Asia Market Volume (Tons) Forecast by Country, 2019 to 2034

Table 51: East Asia Market Value (US$ Million) Forecast by Type, 2019 to 2034

Table 52: East Asia Market Volume (Tons) Forecast by Type, 2019 to 2034

Table 53: East Asia Market Value (US$ Million) Forecast by Application Type, 2019 to 2034

Table 54: East Asia Market Volume (Tons) Forecast by Application Type, 2019 to 2034

Table 55: East Asia Market Value (US$ Million) Forecast by End-Use Industry Type, 2019 to 2034

Table 56: East Asia Market Volume (Tons) Forecast by End-Use Industry Type, 2019 to 2034

Table 57: Middle East and Africa Market Value (US$ Million) Forecast by Country, 2019 to 2034

Table 58: Middle East and Africa Market Volume (Tons) Forecast by Country, 2019 to 2034

Table 59: Middle East and Africa Market Value (US$ Million) Forecast by Type, 2019 to 2034

Table 60: Middle East and Africa Market Volume (Tons) Forecast by Type, 2019 to 2034

Table 61: Middle East and Africa Market Value (US$ Million) Forecast by Application Type, 2019 to 2034

Table 62: Middle East and Africa Market Volume (Tons) Forecast by Application Type, 2019 to 2034

Table 63: Middle East and Africa Market Value (US$ Million) Forecast by End-Use Industry Type, 2019 to 2034

Table 64: Middle East and Africa Market Volume (Tons) Forecast by End-Use Industry Type, 2019 to 2034

List of Figures

Figure 1: Global Market Value (US$ Million) by Type, 2024 to 2034

Figure 2: Global Market Value (US$ Million) by Application Type, 2024 to 2034

Figure 3: Global Market Value (US$ Million) by End-Use Industry Type, 2024 to 2034

Figure 4: Global Market Value (US$ Million) by Region, 2024 to 2034

Figure 5: Global Market Value (US$ Million) Analysis by Region, 2019 to 2034

Figure 6: Global Market Volume (Tons) Analysis by Region, 2019 to 2034

Figure 7: Global Market Value Share (%) and BPS Analysis by Region, 2024 to 2034

Figure 8: Global Market Y-o-Y Growth (%) Projections by Region, 2024 to 2034

Figure 9: Global Market Value (US$ Million) Analysis by Type, 2019 to 2034

Figure 10: Global Market Volume (Tons) Analysis by Type, 2019 to 2034

Figure 11: Global Market Value Share (%) and BPS Analysis by Type, 2024 to 2034

Figure 12: Global Market Y-o-Y Growth (%) Projections by Type, 2024 to 2034

Figure 13: Global Market Value (US$ Million) Analysis by Application Type, 2019 to 2034

Figure 14: Global Market Volume (Tons) Analysis by Application Type, 2019 to 2034

Figure 15: Global Market Value Share (%) and BPS Analysis by Application Type, 2024 to 2034

Figure 16: Global Market Y-o-Y Growth (%) Projections by Application Type, 2024 to 2034

Figure 17: Global Market Value (US$ Million) Analysis by End-Use Industry Type, 2019 to 2034

Figure 18: Global Market Volume (Tons) Analysis by End-Use Industry Type, 2019 to 2034

Figure 19: Global Market Value Share (%) and BPS Analysis by End-Use Industry Type, 2024 to 2034

Figure 20: Global Market Y-o-Y Growth (%) Projections by End-Use Industry Type, 2024 to 2034

Figure 21: Global Market Attractiveness by Type, 2024 to 2034

Figure 22: Global Market Attractiveness by Application Type, 2024 to 2034

Figure 23: Global Market Attractiveness by End-Use Industry Type, 2024 to 2034

Figure 24: Global Market Attractiveness by Region, 2024 to 2034

Figure 25: North America Market Value (US$ Million) by Type, 2024 to 2034

Figure 26: North America Market Value (US$ Million) by Application Type, 2024 to 2034

Figure 27: North America Market Value (US$ Million) by End-Use Industry Type, 2024 to 2034

Figure 28: North America Market Value (US$ Million) by Country, 2024 to 2034

Figure 29: North America Market Value (US$ Million) Analysis by Country, 2019 to 2034

Figure 30: North America Market Volume (Tons) Analysis by Country, 2019 to 2034

Figure 31: North America Market Value Share (%) and BPS Analysis by Country, 2024 to 2034

Figure 32: North America Market Y-o-Y Growth (%) Projections by Country, 2024 to 2034

Figure 33: North America Market Value (US$ Million) Analysis by Type, 2019 to 2034

Figure 34: North America Market Volume (Tons) Analysis by Type, 2019 to 2034

Figure 35: North America Market Value Share (%) and BPS Analysis by Type, 2024 to 2034

Figure 36: North America Market Y-o-Y Growth (%) Projections by Type, 2024 to 2034

Figure 37: North America Market Value (US$ Million) Analysis by Application Type, 2019 to 2034

Figure 38: North America Market Volume (Tons) Analysis by Application Type, 2019 to 2034

Figure 39: North America Market Value Share (%) and BPS Analysis by Application Type, 2024 to 2034

Figure 40: North America Market Y-o-Y Growth (%) Projections by Application Type, 2024 to 2034

Figure 41: North America Market Value (US$ Million) Analysis by End-Use Industry Type, 2019 to 2034

Figure 42: North America Market Volume (Tons) Analysis by End-Use Industry Type, 2019 to 2034

Figure 43: North America Market Value Share (%) and BPS Analysis by End-Use Industry Type, 2024 to 2034

Figure 44: North America Market Y-o-Y Growth (%) Projections by End-Use Industry Type, 2024 to 2034

Figure 45: North America Market Attractiveness by Type, 2024 to 2034

Figure 46: North America Market Attractiveness by Application Type, 2024 to 2034

Figure 47: North America Market Attractiveness by End-Use Industry Type, 2024 to 2034

Figure 48: North America Market Attractiveness by Country, 2024 to 2034

Figure 49: Latin America Market Value (US$ Million) by Type, 2024 to 2034

Figure 50: Latin America Market Value (US$ Million) by Application Type, 2024 to 2034

Figure 51: Latin America Market Value (US$ Million) by End-Use Industry Type, 2024 to 2034

Figure 52: Latin America Market Value (US$ Million) by Country, 2024 to 2034

Figure 53: Latin America Market Value (US$ Million) Analysis by Country, 2019 to 2034

Figure 54: Latin America Market Volume (Tons) Analysis by Country, 2019 to 2034

Figure 55: Latin America Market Value Share (%) and BPS Analysis by Country, 2024 to 2034

Figure 56: Latin America Market Y-o-Y Growth (%) Projections by Country, 2024 to 2034

Figure 57: Latin America Market Value (US$ Million) Analysis by Type, 2019 to 2034

Figure 58: Latin America Market Volume (Tons) Analysis by Type, 2019 to 2034

Figure 59: Latin America Market Value Share (%) and BPS Analysis by Type, 2024 to 2034

Figure 60: Latin America Market Y-o-Y Growth (%) Projections by Type, 2024 to 2034

Figure 61: Latin America Market Value (US$ Million) Analysis by Application Type, 2019 to 2034

Figure 62: Latin America Market Volume (Tons) Analysis by Application Type, 2019 to 2034

Figure 63: Latin America Market Value Share (%) and BPS Analysis by Application Type, 2024 to 2034

Figure 64: Latin America Market Y-o-Y Growth (%) Projections by Application Type, 2024 to 2034

Figure 65: Latin America Market Value (US$ Million) Analysis by End-Use Industry Type, 2019 to 2034

Figure 66: Latin America Market Volume (Tons) Analysis by End-Use Industry Type, 2019 to 2034

Figure 67: Latin America Market Value Share (%) and BPS Analysis by End-Use Industry Type, 2024 to 2034

Figure 68: Latin America Market Y-o-Y Growth (%) Projections by End-Use Industry Type, 2024 to 2034

Figure 69: Latin America Market Attractiveness by Type, 2024 to 2034

Figure 70: Latin America Market Attractiveness by Application Type, 2024 to 2034

Figure 71: Latin America Market Attractiveness by End-Use Industry Type, 2024 to 2034

Figure 72: Latin America Market Attractiveness by Country, 2024 to 2034

Figure 73: Western Europe Market Value (US$ Million) by Type, 2024 to 2034

Figure 74: Western Europe Market Value (US$ Million) by Application Type, 2024 to 2034

Figure 75: Western Europe Market Value (US$ Million) by End-Use Industry Type, 2024 to 2034

Figure 76: Western Europe Market Value (US$ Million) by Country, 2024 to 2034

Figure 77: Western Europe Market Value (US$ Million) Analysis by Country, 2019 to 2034

Figure 78: Western Europe Market Volume (Tons) Analysis by Country, 2019 to 2034

Figure 79: Western Europe Market Value Share (%) and BPS Analysis by Country, 2024 to 2034

Figure 80: Western Europe Market Y-o-Y Growth (%) Projections by Country, 2024 to 2034

Figure 81: Western Europe Market Value (US$ Million) Analysis by Type, 2019 to 2034

Figure 82: Western Europe Market Volume (Tons) Analysis by Type, 2019 to 2034

Figure 83: Western Europe Market Value Share (%) and BPS Analysis by Type, 2024 to 2034

Figure 84: Western Europe Market Y-o-Y Growth (%) Projections by Type, 2024 to 2034

Figure 85: Western Europe Market Value (US$ Million) Analysis by Application Type, 2019 to 2034

Figure 86: Western Europe Market Volume (Tons) Analysis by Application Type, 2019 to 2034

Figure 87: Western Europe Market Value Share (%) and BPS Analysis by Application Type, 2024 to 2034

Figure 88: Western Europe Market Y-o-Y Growth (%) Projections by Application Type, 2024 to 2034

Figure 89: Western Europe Market Value (US$ Million) Analysis by End-Use Industry Type, 2019 to 2034

Figure 90: Western Europe Market Volume (Tons) Analysis by End-Use Industry Type, 2019 to 2034

Figure 91: Western Europe Market Value Share (%) and BPS Analysis by End-Use Industry Type, 2024 to 2034

Figure 92: Western Europe Market Y-o-Y Growth (%) Projections by End-Use Industry Type, 2024 to 2034

Figure 93: Western Europe Market Attractiveness by Type, 2024 to 2034

Figure 94: Western Europe Market Attractiveness by Application Type, 2024 to 2034

Figure 95: Western Europe Market Attractiveness by End-Use Industry Type, 2024 to 2034

Figure 96: Western Europe Market Attractiveness by Country, 2024 to 2034

Figure 97: Eastern Europe Market Value (US$ Million) by Type, 2024 to 2034

Figure 98: Eastern Europe Market Value (US$ Million) by Application Type, 2024 to 2034

Figure 99: Eastern Europe Market Value (US$ Million) by End-Use Industry Type, 2024 to 2034

Figure 100: Eastern Europe Market Value (US$ Million) by Country, 2024 to 2034

Figure 101: Eastern Europe Market Value (US$ Million) Analysis by Country, 2019 to 2034

Figure 102: Eastern Europe Market Volume (Tons) Analysis by Country, 2019 to 2034

Figure 103: Eastern Europe Market Value Share (%) and BPS Analysis by Country, 2024 to 2034

Figure 104: Eastern Europe Market Y-o-Y Growth (%) Projections by Country, 2024 to 2034

Figure 105: Eastern Europe Market Value (US$ Million) Analysis by Type, 2019 to 2034

Figure 106: Eastern Europe Market Volume (Tons) Analysis by Type, 2019 to 2034

Figure 107: Eastern Europe Market Value Share (%) and BPS Analysis by Type, 2024 to 2034

Figure 108: Eastern Europe Market Y-o-Y Growth (%) Projections by Type, 2024 to 2034

Figure 109: Eastern Europe Market Value (US$ Million) Analysis by Application Type, 2019 to 2034

Figure 110: Eastern Europe Market Volume (Tons) Analysis by Application Type, 2019 to 2034

Figure 111: Eastern Europe Market Value Share (%) and BPS Analysis by Application Type, 2024 to 2034

Figure 112: Eastern Europe Market Y-o-Y Growth (%) Projections by Application Type, 2024 to 2034

Figure 113: Eastern Europe Market Value (US$ Million) Analysis by End-Use Industry Type, 2019 to 2034

Figure 114: Eastern Europe Market Volume (Tons) Analysis by End-Use Industry Type, 2019 to 2034

Figure 115: Eastern Europe Market Value Share (%) and BPS Analysis by End-Use Industry Type, 2024 to 2034

Figure 116: Eastern Europe Market Y-o-Y Growth (%) Projections by End-Use Industry Type, 2024 to 2034

Figure 117: Eastern Europe Market Attractiveness by Type, 2024 to 2034

Figure 118: Eastern Europe Market Attractiveness by Application Type, 2024 to 2034

Figure 119: Eastern Europe Market Attractiveness by End-Use Industry Type, 2024 to 2034

Figure 120: Eastern Europe Market Attractiveness by Country, 2024 to 2034

Figure 121: South Asia and Pacific Market Value (US$ Million) by Type, 2024 to 2034

Figure 122: South Asia and Pacific Market Value (US$ Million) by Application Type, 2024 to 2034

Figure 123: South Asia and Pacific Market Value (US$ Million) by End-Use Industry Type, 2024 to 2034

Figure 124: South Asia and Pacific Market Value (US$ Million) by Country, 2024 to 2034

Figure 125: South Asia and Pacific Market Value (US$ Million) Analysis by Country, 2019 to 2034

Figure 126: South Asia and Pacific Market Volume (Tons) Analysis by Country, 2019 to 2034

Figure 127: South Asia and Pacific Market Value Share (%) and BPS Analysis by Country, 2024 to 2034

Figure 128: South Asia and Pacific Market Y-o-Y Growth (%) Projections by Country, 2024 to 2034

Figure 129: South Asia and Pacific Market Value (US$ Million) Analysis by Type, 2019 to 2034

Figure 130: South Asia and Pacific Market Volume (Tons) Analysis by Type, 2019 to 2034

Figure 131: South Asia and Pacific Market Value Share (%) and BPS Analysis by Type, 2024 to 2034

Figure 132: South Asia and Pacific Market Y-o-Y Growth (%) Projections by Type, 2024 to 2034

Figure 133: South Asia and Pacific Market Value (US$ Million) Analysis by Application Type, 2019 to 2034

Figure 134: South Asia and Pacific Market Volume (Tons) Analysis by Application Type, 2019 to 2034

Figure 135: South Asia and Pacific Market Value Share (%) and BPS Analysis by Application Type, 2024 to 2034

Figure 136: South Asia and Pacific Market Y-o-Y Growth (%) Projections by Application Type, 2024 to 2034

Figure 137: South Asia and Pacific Market Value (US$ Million) Analysis by End-Use Industry Type, 2019 to 2034

Figure 138: South Asia and Pacific Market Volume (Tons) Analysis by End-Use Industry Type, 2019 to 2034

Figure 139: South Asia and Pacific Market Value Share (%) and BPS Analysis by End-Use Industry Type, 2024 to 2034

Figure 140: South Asia and Pacific Market Y-o-Y Growth (%) Projections by End-Use Industry Type, 2024 to 2034

Figure 141: South Asia and Pacific Market Attractiveness by Type, 2024 to 2034

Figure 142: South Asia and Pacific Market Attractiveness by Application Type, 2024 to 2034

Figure 143: South Asia and Pacific Market Attractiveness by End-Use Industry Type, 2024 to 2034

Figure 144: South Asia and Pacific Market Attractiveness by Country, 2024 to 2034

Figure 145: East Asia Market Value (US$ Million) by Type, 2024 to 2034

Figure 146: East Asia Market Value (US$ Million) by Application Type, 2024 to 2034

Figure 147: East Asia Market Value (US$ Million) by End-Use Industry Type, 2024 to 2034

Figure 148: East Asia Market Value (US$ Million) by Country, 2024 to 2034

Figure 149: East Asia Market Value (US$ Million) Analysis by Country, 2019 to 2034

Figure 150: East Asia Market Volume (Tons) Analysis by Country, 2019 to 2034

Figure 151: East Asia Market Value Share (%) and BPS Analysis by Country, 2024 to 2034

Figure 152: East Asia Market Y-o-Y Growth (%) Projections by Country, 2024 to 2034

Figure 153: East Asia Market Value (US$ Million) Analysis by Type, 2019 to 2034

Figure 154: East Asia Market Volume (Tons) Analysis by Type, 2019 to 2034

Figure 155: East Asia Market Value Share (%) and BPS Analysis by Type, 2024 to 2034

Figure 156: East Asia Market Y-o-Y Growth (%) Projections by Type, 2024 to 2034

Figure 157: East Asia Market Value (US$ Million) Analysis by Application Type, 2019 to 2034

Figure 158: East Asia Market Volume (Tons) Analysis by Application Type, 2019 to 2034

Figure 159: East Asia Market Value Share (%) and BPS Analysis by Application Type, 2024 to 2034

Figure 160: East Asia Market Y-o-Y Growth (%) Projections by Application Type, 2024 to 2034

Figure 161: East Asia Market Value (US$ Million) Analysis by End-Use Industry Type, 2019 to 2034

Figure 162: East Asia Market Volume (Tons) Analysis by End-Use Industry Type, 2019 to 2034

Figure 163: East Asia Market Value Share (%) and BPS Analysis by End-Use Industry Type, 2024 to 2034

Figure 164: East Asia Market Y-o-Y Growth (%) Projections by End-Use Industry Type, 2024 to 2034

Figure 165: East Asia Market Attractiveness by Type, 2024 to 2034

Figure 166: East Asia Market Attractiveness by Application Type, 2024 to 2034

Figure 167: East Asia Market Attractiveness by End-Use Industry Type, 2024 to 2034

Figure 168: East Asia Market Attractiveness by Country, 2024 to 2034

Figure 169: Middle East and Africa Market Value (US$ Million) by Type, 2024 to 2034

Figure 170: Middle East and Africa Market Value (US$ Million) by Application Type, 2024 to 2034

Figure 171: Middle East and Africa Market Value (US$ Million) by End-Use Industry Type, 2024 to 2034

Figure 172: Middle East and Africa Market Value (US$ Million) by Country, 2024 to 2034

Figure 173: Middle East and Africa Market Value (US$ Million) Analysis by Country, 2019 to 2034

Figure 174: Middle East and Africa Market Volume (Tons) Analysis by Country, 2019 to 2034

Figure 175: Middle East and Africa Market Value Share (%) and BPS Analysis by Country, 2024 to 2034

Figure 176: Middle East and Africa Market Y-o-Y Growth (%) Projections by Country, 2024 to 2034

Figure 177: Middle East and Africa Market Value (US$ Million) Analysis by Type, 2019 to 2034

Figure 178: Middle East and Africa Market Volume (Tons) Analysis by Type, 2019 to 2034

Figure 179: Middle East and Africa Market Value Share (%) and BPS Analysis by Type, 2024 to 2034

Figure 180: Middle East and Africa Market Y-o-Y Growth (%) Projections by Type, 2024 to 2034

Figure 181: Middle East and Africa Market Value (US$ Million) Analysis by Application Type, 2019 to 2034

Figure 182: Middle East and Africa Market Volume (Tons) Analysis by Application Type, 2019 to 2034

Figure 183: Middle East and Africa Market Value Share (%) and BPS Analysis by Application Type, 2024 to 2034

Figure 184: Middle East and Africa Market Y-o-Y Growth (%) Projections by Application Type, 2024 to 2034

Figure 185: Middle East and Africa Market Value (US$ Million) Analysis by End-Use Industry Type, 2019 to 2034

Figure 186: Middle East and Africa Market Volume (Tons) Analysis by End-Use Industry Type, 2019 to 2034

Figure 187: Middle East and Africa Market Value Share (%) and BPS Analysis by End-Use Industry Type, 2024 to 2034

Figure 188: Middle East and Africa Market Y-o-Y Growth (%) Projections by End-Use Industry Type, 2024 to 2034

Figure 189: Middle East and Africa Market Attractiveness by Type, 2024 to 2034

Figure 190: Middle East and Africa Market Attractiveness by Application Type, 2024 to 2034

Figure 191: Middle East and Africa Market Attractiveness by End-Use Industry Type, 2024 to 2034

Figure 192: Middle East and Africa Market Attractiveness by Country, 2024 to 2034

Frequently Asked Questions

How big is the polyphenylenes market?

The global polyphenylene market is valued at USD 4.2 billion in 2024.

Which is the top polyphenylene type?

Polyphenylene sulfide leads the global polyphenylene market.

Which countries dominate the global polyphenylene market?

The global polyphenylene market is controlled by the United States, China, Japan, South Korea, and the United Kingdom.

What is the polyphenylene market growth outlook for 2034?

The global polyphenylene market is anticipated to surpass USD 10.5 billion by 2034.

What is the sales outlook for the polyphenylene from 2024 to 2034?

The global polyphenylene market is anticipated to expand at a CAGR of 9.6% from 2024 to 2034.

Future Market Insights

Polyphenylene Market