The global market for propanol is expected to grow steadily from 2025 to 2035, driven by its widespread use as a solvent in the chemical, paint, ink, cosmetic, and pharmaceutical sectors. Propanol predominates in two isomers: n-propanol and isopropanol, with the latter being applied more intensively due to its effective utilization as both a disinfectant and a cleanser.
The sustained demand for chemical intermediates, surface disinfectants, and industrial solvents drives market growth. The propanol market is expected to be USD 4,125.7 million by 2025, growing at a CAGR of 5.3% during this forecast period and reach USD 6,937.1 million by 2035.
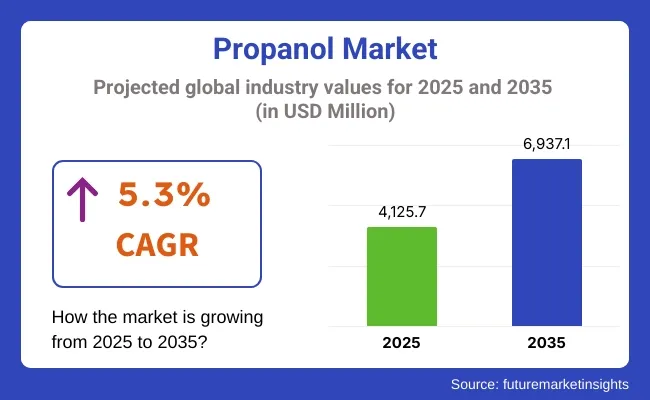
| Metric | Value |
|---|---|
| Market Size in 2025 | USD 4,125.7 million |
| Projected Market Size in 2035 | USD 6,937.1 million |
| CAGR (2025 to 2035) | 5.3% |
Isopropanol in sanitizers and personal care, and n-propanol used in pharmaceutical, coatings, and flexographic ink formulations drive the market. The waterborne coatings and green formulation drive is also compelling the use of propanol due to its higher solvent quality.
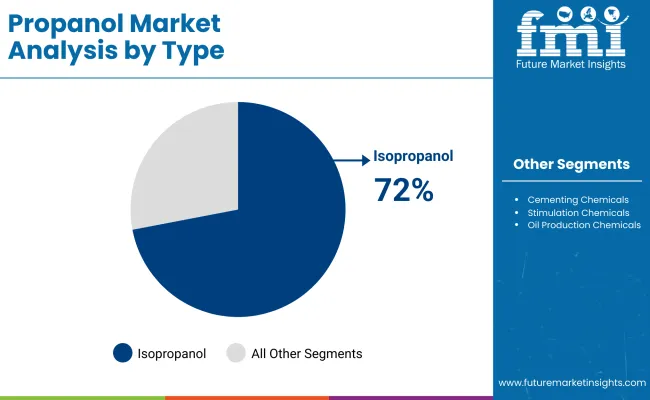
| Type | Market Share (2025) |
|---|---|
| Isopropanol | 72% |
Isopropanol is poised to lead the propanol market, accounting for approximately 72% of the overall market share by 2025. It is primarily this growth in demand, fueled largely by its essential role in disinfectants, such as hand sanitizers, which has witnessed explosive sales growth during the COVID-19 pandemic and remains in extremely high demand post-pandemic. Outside of hygiene products, isopropanol is used as a solvent in various applications across different industry sectors, including pharmaceuticals, electronics cleaning processes, and the cosmetic industry.
Major chemical corporations, such as Dow and LyondellBasell, are increasing their manufacturing capacities to meet the growing demand for hygiene products worldwide, positioning isopropanol as an essential product in both consumer and industrial segments. Since hygiene and cleaning practices are a priority worldwide, isopropanol's market share will continue to increase due to its efficiency and widespread applicability.
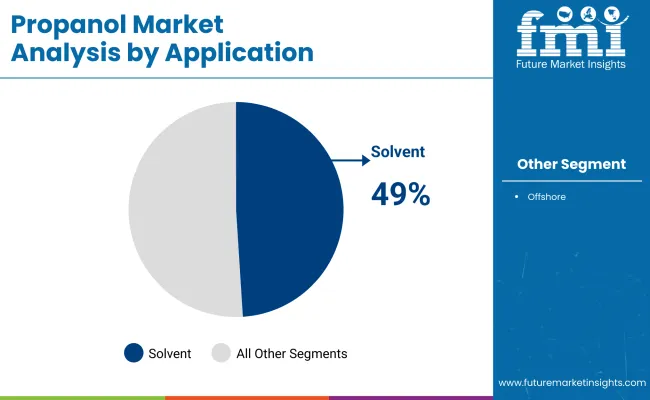
| Application | Market Share (2025) |
|---|---|
| Solvent | 49% |
The solvent segment is expected to account for nearly 49% of the total propanol market size by 2025, with n-propanol and isopropanol being the largest consumers owing to their volatility and compatibility with water. These properties make them excellent solvents for industrial, pharmaceutical, and commercial applications. They are also extensively used in the production of printing inks, coatings, and cleaning liquids, which are in high demand in various regions, particularly Southeast Asia and Europe.
In Southeast Asia, the rapid growth of pharmaceuticals and electronics manufacturing continues to drive the demand for solvents in cleaning and surface preparation applications. Similarly, a healthy industrial base in Europe is constantly driving up demand for solvents in coatings and inks. For isopropanol and n-propanol, as these markets grow, solvent uses will increase sharply, reinforcing their position as important market players.
Challenges: Feedstock Volatility, VOC Regulations, and Safety Concerns
The market is also confronted with price volatility of petrochemical feedstocks, such as propylene, which has a direct impact on the cost of propanol production. The environmental regulations that reduce the application of volatile organic compounds (VOCs) also limit their use in certain applications. Flammability and storage safety issues also require robust handling standards.
Opportunities: Bio-Based Production, Pharma Demand, and Electronics Cleaning
There are prospects in the production of renewable raw material-based bio-based propanol that can lead to sustainability objectives. The increasing use of propanol in the manufacture of pharmaceuticals, cleaning of semiconductors, and biocidal products presents high growth potential for development. Deployment of automated distribution networks and precision dosing in factories is also enhancing efficiency and driving adoption.
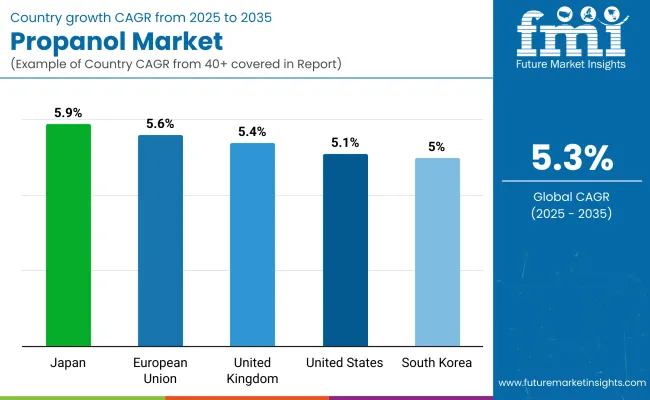
The USA market benefits from propanol’s strong position in industrial cleaning agents, ink solvents, and personal care products. Growth is supported by pharmaceutical contract manufacturing and the increasing switch to bio-based solvents by paint and coating formulators. Investments in low-VOC solvent innovation are becoming more prominent.
| Country | CAGR (2025 to 2035) |
|---|---|
| USA | 5.1% |
In the UK, demand for propanol is being driven by its integration into environmentally compliant industrial cleaners and precision coatings. The market is transitioning toward greener alternatives, with producers collaborating with universities and chemical startups to scale up renewable propanol from waste biomass.
| Country | CAGR (2025 to 2035) |
|---|---|
| UK | 5.4% |
Within the EU, REACH regulations are shaping the demand for safe and low-toxicity solvents. Countries like Germany and the Netherlands are using propanol in biodegradable printing inks, food-safe coatings, and fragrance-free disinfectants. Bio-propanol pilot plants are receiving research and development (R&D) funding under the EU Green Deal framework.
| Region | CAGR (2025 to 2035) |
|---|---|
| European Union (EU) | 5.6% |
Japan continues to drive innovation in specialty uses of propanol, particularly in electronics-grade solvents and low-odor intermediates for cosmetic formulations. Regulatory emphasis on workplace air quality is accelerating the shift to low-VOC formulations. Domestic producers are adopting hybrid synthesis methods to reduce carbon emissions.
| Country | CAGR (2025 to 2035) |
|---|---|
| Japan | 5.9% |
In South Korea, applications of propanol in semiconductors, battery production, and pharmaceutical synthesis are driving high growth. Chemical players in the country are investing in energy-intensive distillation and refining processes to meet high-purity solvent demands. Propanol is also penetrating the specialty agrochemical solvents segment.
| Country | CAGR (2025 to 2035) |
|---|---|
| South Korea | 5.0% |
The propanol market is anticipated to witness steady growth due to its use as a solvent in various industries, including pharmaceuticals, personal care, and chemicals. A significant factor contributing to market growth is the increasing use of propanol in the manufacturing of pharmaceuticals, cosmetics, and industrial solvents.
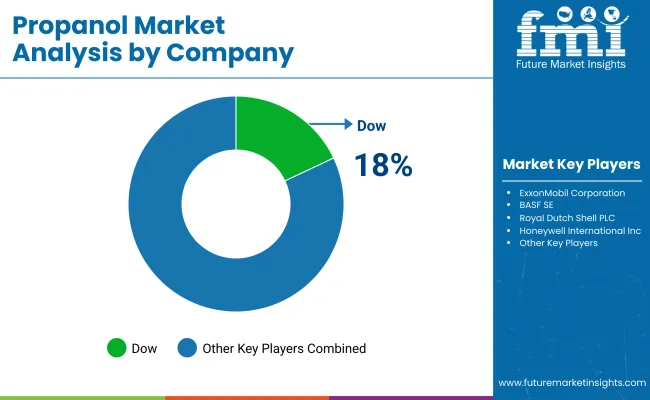
Dow (15-18%)
Dow leads the market with significant investments in production capacity and a focus on sustainable product lines, particularly catering to the pharmaceutical and personal care industries.
ExxonMobil Corporation (12-15%)
ExxonMobil leverages advanced catalytic technologies to produce high-quality propanol, strengthening its position through strategic partnerships in the pharmaceutical sector.
BASF SE (10-13%)
BASF emphasizes sustainability by developing bio-based propanol products and investing in research to enhance applications in high-performance coatings.
Royal Dutch Shell PLC (8-11%)
Shell focuses on high-purity propanol products for specialized industries like electronics and is actively pursuing digital initiatives to optimize production efficiency.
Honeywell International Inc. (5-8%)
Honeywell is expanding its product portfolio with innovative propanol derivatives and strengthening its presence in the Asia-Pacific market through strategic collaborations.
Other Key Players (35-50% Combined)
The propanol market was valued at approximately USD 4,125.7 million in 2025.
The market is projected to reach around USD 6,937.1 million by 2035.
Key drivers include the rising use of propanol in pharmaceuticals, personal care products, paints, resins, de-icers, cosmetics, inks, food, and adhesives.
The leading countries in the propanol market include China, India, the United States, Germany, and Japan.
The isopropanol segment holds the largest market share, accounting for over 55% of the global market in 2025.
Table 01: Global Propanol Market Volume (KT) and Value (US$ Mn) Forecast By Type, 2022-2029
Table 02: Global Propanol Market Volume (KT) and Value (US$ Mn) Forecast by Application, 2022-2029
Table 03: Global Propanol Market Volume (KT) and Value (US$ Mn) Forecast by Region, 2022-2029
Table 04: North America Propanol Market Volume (KT) and Value (US$ Mn) Forecast by Country, 2022-2029
Table 05: North America Propanol Market Volume (KT) and Value (US$ Mn) Forecast By Type, 2022-2029
Table 06: North America Propanol Market Volume (KT) and Value (US$ Mn) Forecast by Application, 2022-2029
Table 07: Latin America Propanol Market Volume (KT) and Value (US$ Mn) Forecast by Country, 2022-2029
Table 08: Latin America Propanol Market Volume (KT) and Value (US$ Mn) Forecast By Type, 2022-2029
Table 09: Latin America Propanol Market Volume (KT) and Value (US$ Mn) Forecast by Application, 2022-2029
Table 10: Europe Propanol Market Volume (KT) and Value (US$ Mn) Forecast by Country, 2022-2029
Table 11: Europe Propanol Market Volume (KT) and Value (US$ Mn) Forecast By Type, 2022-2029
Table 12: Europe Propanol Market Volume (KT) and Value (US$ Mn) Forecast by Application, 2022-2029
Table 13: East Asia Propanol Market Volume (KT) and Value (US$ Mn) Forecast by Country, 2022-2029
Table 14: East Asia Propanol Market Volume (KT) and Value (US$ Mn) Forecast By Type, 2022-2029
Table 15: East Asia Propanol Market Volume (KT) and Value (US$ Mn) Forecast by Application, 2022-2029
Table 16: South Asia Propanol Market Volume (KT) and Value (US$ Mn) Forecast by Country, 2022-2029
Table 17: South Asia Propanol Market Volume (KT) and Value (US$ Mn) Forecast By Type, 2022-2029
Table 18: South Asia Propanol Market Volume (KT) and Value (US$ Mn) Forecast by Application, 2022-2029
Table 19: Oceania Propanol Market Volume (KT) and Value (US$ Mn) Forecast by Country, 2022-2029
Table 20: Oceania Propanol Market Volume (KT) and Value (US$ Mn) Forecast By Type, 2022-2029
Table 21: Oceania Propanol Market Volume (KT) and Value (US$ Mn) Forecast by Application, 2022-2029
Table 22: MEA Propanol Market Volume (KT) and Value (US$ Mn) Forecast by Country, 2022-2029
Table 23: MEA Propanol Market Volume (KT) and Value (US$ Mn) Forecast By Type, 2022-2029
Table 24: MEA Propanol Market Volume (KT) and Value (US$ Mn) Forecast by Application, 2022-2029
Table 25: India Propanol Market Volume (KT) and Value (US$ Mn) Forecast By Type, 2022-2029
Table 26: India Propanol Market Volume (KT) and Value (US$ Mn) Forecast by Application, 2022-2029
Table 27: China Propanol Market Volume (KT) and Value (US$ Mn) Forecast By Type, 2022-2029
Table 28: China Propanol Market Volume (KT) and Value (US$ Mn) Forecast by Application, 2022-2029
Table 29: Mexico Propanol Market Volume (KT) and Value (US$ Mn) Forecast By Type, 2022-2029
Table 30: Mexico Propanol Market Volume (KT) and Value (US$ Mn) Forecast by Application, 2022-2029
Figure 01: Global Propanol Market Historical Volume (KT), 2014 – 2021
Figure 02: Global Propanol Market Volume (KT) Forecast, 2022 – 2029
Figure 03: Global Propanol Market Historical Value (US$ Mn) & Y-o-Y Growth (%), 2014–2021
Figure 04: Global Propanol Market Value (US$ Mn) Forecast & Y-o-Y Growth (%), 2022-2029
Figure 05: Global Propanol Market Absolute $ Opportunity, 2022-2029
Figure 06: Global Propanol Market Share and BPS Analysis by Type - 2012 & 2029
Figure 07: Global Propanol Market Y-o-Y Growth Projections by Type, 2022-2029
Figure 08: Global Propanol Market Attractiveness by Type, 2022-2029
Figure 09: Global Propanol Market Absolute $ Opportunity by n-Propanol Segment, 2022-2029
Figure 10: Global Propanol Market Absolute $ Opportunity by Isopropanol Segment, 2022-2029
Figure 11: Global Propanol Market Share and BPS Analysis by Application - 2022-2029
Figure 12: Global Propanol Market Y-o-Y Growth Projections by Application, 2022-2029
Figure 13: Global Propanol Market Attractiveness by Application, 2022-2029
Figure 14: Global Propanol Market Absolute $ Opportunity by Solvent Segment, 2022-2029
Figure 15: Global Propanol Market Absolute $ Opportunity by Chemical Intermediate Segment, 2022-2029
Figure 16: Global Propanol Market Absolute $ Opportunity by Pharmaceutical Segment, 2022-2029
Figure 17: Global Propanol Market Absolute $ Opportunity by Household and Personal Care Products Segment, 2022-2029
Figure 18: Global Propanol Market Absolute $ Opportunity by Acetone Production Segment, 2022-2029
Figure 19: Global Propanol Market Share and BPS Analysis by Region – 2022-2029
Figure 20: Global Propanol Market Y-o-Y Growth Projections by Region, 2022-2029
Figure 21: Global Propanol Market Attractiveness by Region, 2022-2029
Figure 22: Global Propanol Market Absolute $ Opportunity by North America, 2022-2029
Figure 23: Global Propanol Market Absolute $ Opportunity by Latin America, 2022-2029
Figure 24: Global Propanol Market Absolute $ Opportunity by Europe, 2022-2029
Figure 25: Global Propanol Market Absolute $ Opportunity by South Asia & Pacific & Pacific, 2022-2029
Figure 26: Global Propanol Market Absolute $ Opportunity by East Asia, 2022-2029
Figure 27: Global Propanol Market Absolute $ Opportunity by Oceania, 2022-2029
Figure 28: Global Propanol Market Absolute $ Opportunity by MEA, 2022-2029
Figure 29: North America Propanol Market Share and BPS Analysis by Country – 2022-2029
Figure 30: North America Propanol Market Y-o-Y Growth Projections by Country, 2022-2029
Figure 31: North America Propanol Market Attractiveness by Country, 2022-2029
Figure 32: North America Propanol Market Absolute $ Opportunity by US, 2022-2029
Figure 33: North America Propanol Market Absolute $ Opportunity by Canada, 2022-2029
Figure 34: North America Propanol Market Share and BPS Analysis by Type – 2022-2029
Figure 35: North America Propanol Market Y-o-Y Growth Projections by Type, 2022-2029
Figure 36: North America Propanol Market Attractiveness by Type, 2022-2029
Figure 37: North America Propanol Market Share and BPS Analysis by Application – 2022-2029
Figure 38: North America Propanol Market Y-o-Y Growth Projections by Application, 2022-2029
Figure 39: North America Propanol Market Attractiveness by Application, 2022-2029
Figure 40: Latin America Propanol Market Share and BPS Analysis by Country – 2022-2029
Figure 41: Latin America Propanol Market Y-o-Y Growth Projections by Country, 2022-2029
Figure 42: Latin America Propanol Market Attractiveness by Country, 2022-2029
Figure 43: Latin America Propanol Market Absolute $ Opportunity by Brazil, 2022-2029
Figure 44: Latin America Propanol Market Absolute $ Opportunity by Mexico, 2022-2029
Figure 45: Global Propanol Market Absolute $ Opportunity by Rest of Latin America, 2022-2029
Figure 46: Latin America Propanol Market Share and BPS Analysis by Type - 2022-2029
Figure 47: Latin America Propanol Market Y-o-Y Growth Projections by Type, 2022-2029
Figure 48: Latin America Propanol Market Attractiveness by Type, 2022-2029
Figure 49: Latin America Propanol Market Share and BPS Analysis by Application - 2022-2029
Figure 50: Latin America Propanol Market Y-o-Y Growth Projections by Application, 2022-2029
Figure 51: Latin America Propanol Market Attractiveness by Application, 2022-2029
Figure 52: Europe Propanol Market Share and BPS Analysis by Country - 2022-2029
Figure 53: Europe Propanol Market Y-o-Y Growth Projections by Country, 2022-2029
Figure 54: Europe Propanol Market Attractiveness by Country, 2022-2029
Figure 55: Europe Propanol Market Absolute $ Opportunity by Germany, 2022-2029
Figure 56: Europe Propanol Market Absolute $ Opportunity by Italy, 2022-2029
Figure 57: Europe Propanol Market Absolute $ Opportunity by France, 2022-2029
Figure 58: Europe Propanol Market Absolute $ Opportunity by UK, 2022-2029
Figure 59: Europe Propanol Market Absolute $ Opportunity by Spain, 2022-2029
Figure 60: Europe Propanol Market Absolute $ Opportunity by Benelux, 2022-2029
Figure 61: Europe Propanol Market Absolute $ Opportunity by Russia, 2022-2029
Figure 62: Europe Propanol Market Absolute $ Opportunity by Rest of Europe, 2022-2029
Figure 63: Europe Propanol Market Share and BPS Analysis by Type - 2022-2029
Figure 64: Europe Propanol Market Y-o-Y Growth Projections by Type, 2022-2029
Figure 65: Europe Propanol Market Attractiveness by Type, 2022-2029
Figure 66: Europe Propanol Market Share and BPS Analysis by Application - 2022-2029
Figure 67: Europe Propanol Market Y-o-Y Growth Projections by Application, 2022-2029
Figure 68: Europe Propanol Market Attractiveness by Application, 2022-2029
Figure 69: East Asia Propanol Market Share and BPS Analysis by Country - 2022-2029
Figure 70: East Asia Propanol Market Y-o-Y Growth Projections by Country, 2022-2029
Figure 71: East Asia Propanol Market Attractiveness by Country, 2022-2029
Figure 72: East Asia Propanol Market Absolute $ Opportunity by China, 2022-2029
Figure 73: East Asia Propanol Market Absolute $ Opportunity by Japan, 2022-2029
Figure 74: Global Propanol Market Absolute $ Opportunity by South Korea, 2022-2029
Figure 75: East Asia Propanol Market Share and BPS Analysis by Type - 2022-2029
Figure 76: East Asia Propanol Market Y-o-Y Growth Projections by Type, 2022-2029
Figure 77: East Asia Propanol Market Attractiveness by Type, 2022-2029
Figure 78: East Asia Propanol Market Share and BPS Analysis by Application - 2022-2029
Figure 79: East Asia Propanol Market Y-o-Y Growth Projections by Application, 2022-2029
Figure 80: East Asia Propanol Market Attractiveness by Application, 2022-2029
Figure 81: South Asia Propanol Market Share and BPS Analysis by Country - 2022-2029
Figure 82: South Asia Propanol Market Y-o-Y Growth Projections by Country, 2022-2029
Figure 83: South Asia Propanol Market Attractiveness by Country, 2022-2029
Figure 84: South Asia Propanol Market Absolute $ Opportunity by India, 2022-2029
Figure 85: South Asia Propanol Market Absolute $ Opportunity by Thailand, 2022-2029
Figure 86: South Asia Propanol Market Absolute $ Opportunity by Indonesia, 2022-2029
Figure 87: South Asia Propanol Market Absolute $ Opportunity by Malaysia, 2022-2029
Figure 88: South Asia Propanol Market Absolute $ Opportunity by Rest of South Asia, 2022-2029
Figure 89: South Asia Propanol Market Share and BPS Analysis by Type - 2022-2029
Figure 90: South Asia Propanol Market Y-o-Y Growth Projections by Type, 2022-2029
Figure 91: South Asia Propanol Market Attractiveness by Type, 2022-2029
Figure 92: South Asia Propanol Market Share and BPS Analysis by Application - 2022-2029
Figure 93: South Asia Propanol Market Y-o-Y Growth Projections by Application, 2022-2029
Figure 94: South Asia Propanol Market Attractiveness by Application, 2022-2029
Figure 95: Oceania Propanol Market Share and BPS Analysis by Country - 2022-2029
Figure 96: Oceania Propanol Market Y-o-Y Growth Projections by Country, 2022-2029
Figure 97: Oceania Propanol Market Attractiveness by Country, 2022-2029
Figure 98: Oceania Propanol Market Absolute $ Opportunity by Australia, 2022-2029
Figure 99: Oceania Propanol Market Absolute $ Opportunity by New Zealand, 2022-2029
Figure 100: Oceania Propanol Market Share and BPS Analysis by Type - 2022-2029
Figure 101: Oceania Propanol Market Y-o-Y Growth Projections by Type, 2022-2029
Figure 102: Oceania Propanol Market Attractiveness by Type, 2022-2029
Figure 103: Oceania Propanol Market Share and BPS Analysis by Application - 2022-2029
Figure 104: Oceania Propanol Market Y-o-Y Growth Projections by Application, 2022-2029
Figure 105: Oceania Propanol Market Attractiveness by Application, 2022-2029
Figure 106: MEA Propanol Market Share and BPS Analysis by Country - 2022-2029
Figure 107: MEA Propanol Market Y-o-Y Growth Projections by Country, 2022-2029
Figure 108: MEA Propanol Market Attractiveness by Country, 2022-2029
Figure 109: MEA Propanol Market Absolute $ Opportunity by GCC Countries, 2022-2029
Figure 110: MEA Propanol Market Absolute $ Opportunity by Turkey, 2022-2029
Figure 111: MEA Propanol Market Absolute $ Opportunity by Northern Africa, 2022-2029
Figure 112: MEA Propanol Market Absolute $ Opportunity by South Africa, 2022-2029
Figure 113: MEA Propanol Market Absolute $ Opportunity by Rest of MEA, 2022-2029
Figure 114: MEA Propanol Market Share and BPS Analysis by Type - 2022-2029
Figure 115: MEA Propanol Market Y-o-Y Growth Projections by Type, 2022-2029
Figure 116: MEA Propanol Market Attractiveness by Type, 2022-2029
Figure 117: MEA Propanol Market Share and BPS Analysis by Application - 2022-2029
Figure 118: MEA Propanol Market Y-o-Y Growth Projections by Application, 2022-2029
Figure 119: MEA Propanol Market Attractiveness by Application, 2022-2029
Figure 120: Global & Emerging Countries Propanol Market Share and BPS Analysis – 2022 & 2028
Figure 121: Global & Emerging Countries Propanol Market Y-o-Y Growth Projections, 2022-2029
Figure 122: India Propanol Market Share and BPS Analysis by Type - 2022-2029
Figure 123: India Propanol Market Y-o-Y Growth Projections by Type, 2022-2029
Figure 124: India Propanol Market Attractiveness by Type, 2022-2029
Figure 125: India Propanol Market Share and BPS Analysis by Application - 2022-2029
Figure 126: India Propanol Market Y-o-Y Growth Projections by Application, 2022-2029
Figure 127: India Propanol Market Attractiveness by Application, 2022-2029
Figure 128: China Propanol Market Share and BPS Analysis by Type - 2022-2029
Figure 129: China Propanol Market Y-o-Y Growth Projections by Type, 2022-2029
Figure 130: China Propanol Market Attractiveness by Type, 2022-2029
Figure 131: China Propanol Market Share and BPS Analysis by Application - 2022-2029
Figure 132: China Propanol Market Y-o-Y Growth Projections by Application, 2022-2029
Figure 133: China Propanol Market Attractiveness by Application, 2022-2029
Figure 134: Mexico Propanol Market Share and BPS Analysis by Type - 2022-2029
Figure 135: Mexico Propanol Market Y-o-Y Growth Projections by Type, 2022-2029
Figure 136: Mexico Propanol Market Attractiveness by Type, 2022-2029
Figure 137: Mexico Propanol Market Share and BPS Analysis by Application - 2022-2029
Figure 138: Mexico Propanol Market Y-o-Y Growth Projections by Application, 2022-2029
Figure 139: Mexico Propanol Market Attractiveness by Application, 2022-2029


Full Research Suite comprises of:
Market outlook & trends analysis
Interviews & case studies
Strategic recommendations
Vendor profiles & capabilities analysis
5-year forecasts
8 regions and 60+ country-level data splits
Market segment data splits
12 months of continuous data updates
DELIVERED AS:
PDF EXCEL ONLINE
N-Propanol Market Size and Share Forecast Outlook 2025 to 2035
Monoisopropanolamine Market
(S)-(+)-2-Amino-1-Propanol Market Size and Share Forecast Outlook 2025 to 2035

Thank you!
You will receive an email from our Business Development Manager. Please be sure to check your SPAM/JUNK folder too.
Chat With
MaRIA