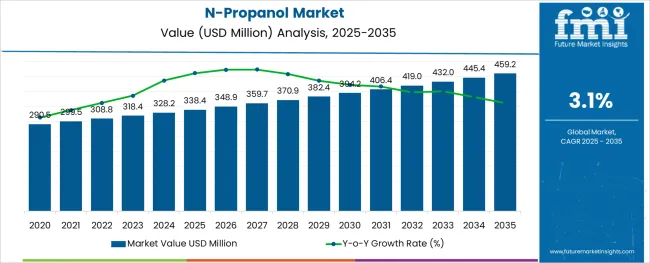
The N-Propanol Market is estimated to be valued at USD 338.4 million in 2025 and is projected to reach USD 459.2 million by 2035, registering a compound annual growth rate (CAGR) of 3.1% over the forecast period.

The alginic acid market is undergoing consistent growth, propelled by rising demand from food processing, pharmaceutical formulations, and cosmetic applications. A growing focus on natural and sustainable ingredients in manufacturing processes has positioned alginic acid as a preferred biopolymer across industries.
The market is further supported by its diverse functional benefits, including water retention, gelling, and stabilizing properties, which make it indispensable in high-performance formulations. Increased regulatory acceptance of alginates as safe additives and the push towards cleaner labeling in food and personal care products have reinforced their adoption.
Ongoing innovation in extraction technologies and the utilization of algae as a renewable resource are paving the way for cost-effective production and expanded applications, ensuring sustained market expansion in the coming years.
The market is segmented by Application and End Use and region. By Application, the market is divided into Solvents, Chemical Intermediates, Entrainer, Deicing Fluids, and Others. In terms of End Use, the market is classified into Pharmaceuticals, Household & Personal Care Products, Chemical Production, Coatings, Anti-freeze, and Others. Regionally, the market is classified into North America, Latin America, Western Europe, Eastern Europe, Balkan & Baltic Countries, Russia & Belarus, Central Asia, East Asia, South Asia & Pacific, and the Middle East & Africa.
When segmented by salts, sodium alginate is expected to command 27.5% of the market revenue in 2025, marking it as the leading subsegment in this category. This leadership has been driven by its superior solubility, ease of incorporation into formulations, and versatility in a wide range of applications.
Its ability to form stable gels and maintain viscosity under varying conditions has made it highly sought after in both food and pharmaceutical sectors. Manufacturers have prioritized sodium alginate due to its consistent performance, cost-effectiveness, and regulatory acceptance, which have collectively strengthened its position.
The segment’s prominence has also been enhanced by its adaptability to evolving consumer preferences for plant-derived and sustainable ingredients, reinforcing its market share.
Segmented by end user industry, the food industry is projected to hold 33.0% of the market revenue in 2025, positioning it as the most prominent sector. This dominance has been shaped by the industry’s increasing reliance on alginic acid and its derivatives to deliver desirable textures, stabilize emulsions, and improve shelf life of processed foods.
As consumer demand for clean label and natural additives has intensified, the food sector has responded by integrating alginates into bakery, dairy, and confectionery products. Enhanced production efficiency and compliance with food safety standards have further encouraged widespread use.
The segment’s leadership has also been supported by product differentiation strategies where alginates contribute to premium quality and innovation, securing their role in modern food formulations.
The overall market for n-propanol witnessed year-over-year growth of about 1.7% to 3.1% during the past few years. However, based on the current estimations, the global n-propyl alcohol market is projected to grow at about 3.1% CAGR between 2025 and 2035.
Demand for n-propanol has been consistently growing owing to the robust growth of the end-use industries such as pharmaceuticals, coatings, and personal care.
1-propanol is substantially used as an industrial solvent in prominent chemical sectors. It is utilized for the production of a variety of products, including paints and inks, adhesives, cosmetics, plastics, rubber, and coatings. They are effective solvents due to their miscibility with water and little reactivity towards the bulk of common compounds.
Globally, rising infrastructure spending in developing nations is anticipated to significantly boost demand for goods including paints and coatings, adhesives, and industrial machinery. This in turn will have a favorable knock-on effect on n-propanol usage.
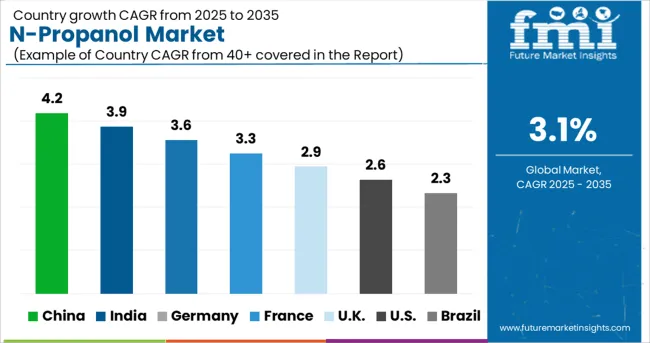
Significant growth potential exists in emerging economies such as those in the Asia Pacific. There is a considerable demand for n-propanol products in countries such as India and China owing to the booming construction, chemical, and paint & coatings industries.
Since the chemical industry is consolidated, investments in product development by key manufacturers and rapid industrialization & urbanization could create a significant opportunity for n-propanol manufacturers.
Furthermore, the rising prevalence of chronic diseases coupled with increasing production and consumption of pharmaceuticals will boost sales of n-propanol during the projection period.
Widening Applications in Pharmaceutical and Coating Industries Boost market
The growth of n-propanol is expressively driven by increasing usage in the pharmaceutical and coating industries. N-propanol finds application as a chemical intermediate, solvent, and organic synthesis in many industries. It is mainly used as a solvent in solvent-based coatings, pharmaceuticals, paints, etc.
Owing to the growing usage of n-propanol as a solvent in pharmaceutical and coating industries, a positive growth trajectory has been predicted by FMI for the global n-propyl alcohol market during the forecast period.
Moreover, as an inert ingredient, n-propanol is a cosolvent and solvent in many pesticide products, including those used in agriculture. Thus, growing demand for these pesticide products will eventually boost the sales of n-propanol over the projected period.

Increasing Usage of N-Propanol in the Pharmaceutical Industry Driving Sales in the USA
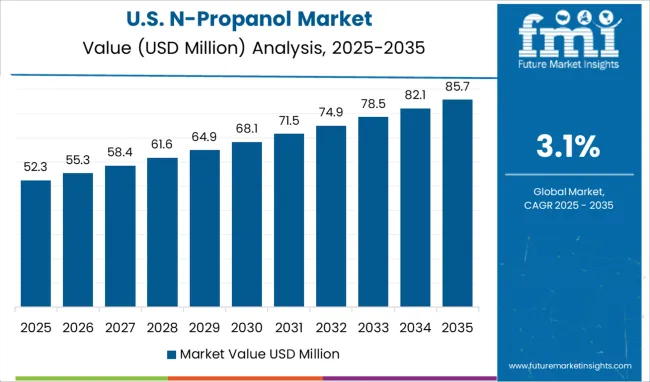
Demand for propyl alcohol is expected to rise at a steady pace across the USA during the next ten years, owing to the substantial development in the manufacturing industries and chemical industries.

Similarly, a strong end-user presence in the country has resulted in higher demand for N-propanol as compared with the domestic supply capacity.
The USA is estimated to be a key importer of 1-propanol all over the globe with import volume reaching about 34,110.6 tons in 2024.
Substantial production of pharma drugs and medicines, strong development in the coatings industries, and higher demand for cosmetics are expected to emerge as the key driving factors for the propan-1-ol in the USA
Robust Growth of Construction Industry to Elevate Demand for N-Propanol in China
As per FMI, China is anticipated to be a leading country in terms of the consumption of n-propyl alcohol in the global market. The consumption of n-propyl alcohol in China is estimated to witness a 3.5% growth over the assessment period of 2025 and 2035. The country has an immense old-age population that creates a huge demand for medicine and pharma products.
To cater to such a huge demand, pharmaceutical giants in the country are ramping up their production capacities. They are extensively using solvents like m-propanol for manufacturing various medicines and pharma products.
Additionally, the increasing demand for paints and coatings owing to the rapid development in the construction industry is boosting sales of n-propanol in the country.
According to the data provided by the institute of civil engineers, the construction output will rise by 86 percent to USD 16.5 trillion by 2035 globally, with three countries China, India, and the USA leading the pack. Thus, the expansion of the construction industry in the USA will continue to generate high demand for products like n-propanol over the next ten years.
Solvents and Chemical Intermediates to Remain Lucrative Applications of N-Propanol
Solvents and chemical intermediates will remain the key applications of n-propanol during the forecast period, owing to the growing demand for the production of various drugs and medicine, pesticide products, and other chemicals.
n-propanol is used as an intermediate and as raw material for the production of various organic compounds including esters, halides, propyl amines, and propyl acetate.
The increasing need for intermediates in the chemical industries for the manufacturing of organic derivatives, pesticides, antifreeze compositions, and certain organic chemicals is expected to propel the growth of the n-propanol market.
Similarly, n-propanol is being increasingly used as a solvent in the manufacturing of pharmaceuticals, dental lotions, paint additives, fuel additives, pigments, coatings, de-greasing fluids, etc. Thus, growing demand and consumption of these products will continue to boost sales of n-propanol over the next decade.
Additionally, the rising usage of this chemical as a laboratory reagent is also expected to benefit the n-propanol industry owing to increasing investment in research and development.

Due to a rise in the demand for n-propanol, more expansion activities have been seen over the last several years. Market players are raising their installed capacity in order to meet the escalating demand from the end-use industries.
Due to the significant growth of the paints and coatings industry, additionally, market competitors are concentrating on producing solvents and chemical intermediates. For Instance,
| Attribute | Details |
|---|---|
| Estimated Market Size (2025) | USD 338.4 million |
| Projected Market Size (2035) | USD 459.2 million |
| Anticipated Growth Rate (2025 to 2035) | 3.1% CAGR |
| Forecast Period | 2025 to 2035 |
| Historical Data Available for | 2020 to 2024 |
| Market Analysis | million for Value and Tons for Volume |
| Key Countries Covered | USA, Canada, Brazil, Mexico, Germany, Italy, France, United Kingdom, Spain, BENELUX, Russia, China, Japan, South Korea, India, ASEAN, Australia and New Zealand, GCC Countries, Turkey, South Africa |
| Key Segments Covered | Application, End Use, and Region |
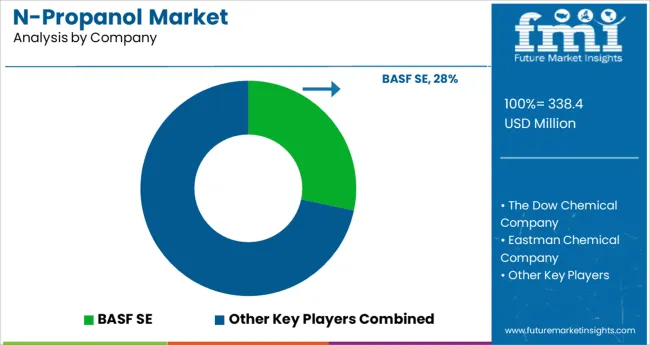
| Key Companies Profiled | BASF SE; The Dow Chemical Company; Eastman Chemical Company; Sasol Limited; OQ Chemicals; Spectrum Chemicals; Solvay S.A.; Dairen Chemical Corporation; Zibo Nalcohol Chemical Co., Ltd.; Solventis Ltd.; Hefei TNJ Chemical Industry Co., Ltd.; Others |
| Report Coverage | Market Forecast, Company Share Analysis, Competition Intelligence, Drivers, Restraints, Opportunities and Threats Analysis, Market Dynamics and Challenges, and Strategic Growth Initiatives |
The global n-propanol market is estimated to be valued at USD 338.4 million in 2025.
It is projected to reach USD 459.2 million by 2035.
The market is expected to grow at a 3.1% CAGR between 2025 and 2035.
The key product types are solvents, chemical intermediates, entrainer, deicing fluids and others.
pharmaceuticals segment is expected to dominate with a 41.9% industry share in 2025.


Our Research Products

The "Full Research Suite" delivers actionable market intel, deep dives on markets or technologies, so clients act faster, cut risk, and unlock growth.

The Leaderboard benchmarks and ranks top vendors, classifying them as Established Leaders, Leading Challengers, or Disruptors & Challengers.

Locates where complements amplify value and substitutes erode it, forecasting net impact by horizon

We deliver granular, decision-grade intel: market sizing, 5-year forecasts, pricing, adoption, usage, revenue, and operational KPIs—plus competitor tracking, regulation, and value chains—across 60 countries broadly.

Spot the shifts before they hit your P&L. We track inflection points, adoption curves, pricing moves, and ecosystem plays to show where demand is heading, why it is changing, and what to do next across high-growth markets and disruptive tech

Real-time reads of user behavior. We track shifting priorities, perceptions of today’s and next-gen services, and provider experience, then pace how fast tech moves from trial to adoption, blending buyer, consumer, and channel inputs with social signals (#WhySwitch, #UX).

Partner with our analyst team to build a custom report designed around your business priorities. From analysing market trends to assessing competitors or crafting bespoke datasets, we tailor insights to your needs.
Supplier Intelligence
Discovery & Profiling
Capacity & Footprint
Performance & Risk
Compliance & Governance
Commercial Readiness
Who Supplies Whom
Scorecards & Shortlists
Playbooks & Docs
Category Intelligence
Definition & Scope
Demand & Use Cases
Cost Drivers
Market Structure
Supply Chain Map
Trade & Policy
Operating Norms
Deliverables
Buyer Intelligence
Account Basics
Spend & Scope
Procurement Model
Vendor Requirements
Terms & Policies
Entry Strategy
Pain Points & Triggers
Outputs
Pricing Analysis
Benchmarks
Trends
Should-Cost
Indexation
Landed Cost
Commercial Terms
Deliverables
Brand Analysis
Positioning & Value Prop
Share & Presence
Customer Evidence
Go-to-Market
Digital & Reputation
Compliance & Trust
KPIs & Gaps
Outputs
Full Research Suite comprises of:
Market outlook & trends analysis
Interviews & case studies
Strategic recommendations
Vendor profiles & capabilities analysis
5-year forecasts
8 regions and 60+ country-level data splits
Market segment data splits
12 months of continuous data updates
DELIVERED AS:
PDF EXCEL ONLINE

Thank you!
You will receive an email from our Business Development Manager. Please be sure to check your SPAM/JUNK folder too.
Chat With
MaRIA