Quercetin Market
Quercetin: A Potent and Versatile Flavonoid Gaining Popularity Across The USA, Japan, Korea, The United Kingdom, and 30+Countries for its Anti-inflammatory and Anti-Oxidant Properties! Explore More with FMI
Quercetin Market by Product, Nature, Sales Channel, End User & Region | Forecast 2022 to 2032
Quercetin Market Outlook (2022 to 2032)
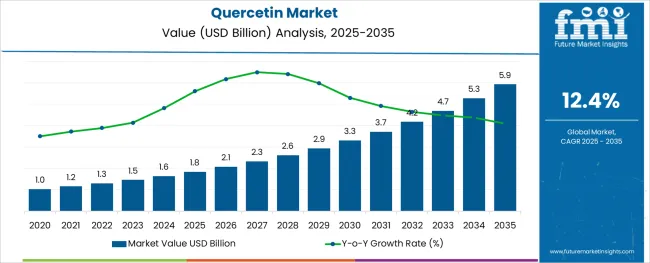
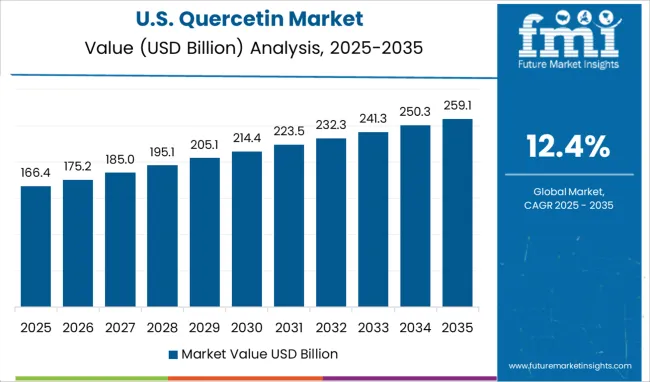
The global quercetin market size is expected to be valued at US$ 1,296 million in 2022 and further grow at a CAGR of 12.4% from 2022 to 2032. Overall quercetin sales are anticipated to total a market valuation of US$ 3,968 million by the end of 2032. Growing usage across industries such as pharmaceutical, food & beverage, and dietary supplement is a key factor propelling quercetin demand globally.
Quercetin is a plant pigment found in several fruits, vegetables, seeds, leaves, grains, and other sources. This plant flavonol is believed to have anti-inflammatory and antioxidant properties. As a result, it has become a commonly used ingredient in functional foods, dietary supplements, and beverages.
The increasing quercetin demand is attributed to the growing popularity of food products and supplements with health benefits. Quercetin is increasingly being used in food products as a natural antioxidant and preservative. It is a strong scavenger and anti-inflammatory agent which has been found to have significant health benefits such as reducing the risk of cancer, heart disease, and age-related conditions such as cognitive decline and Alzheimer's disease.
Quercetin is also being used in dietary supplements and functional foods to provide antioxidant protection and support cardiovascular health. Hence, rising production and consumption of these products will eventually boost quercetin sales over the next ten years.
Similarly, the rapid transition towards natural food and beverage preservatives is expected to create growth prospects for the quercetin market during the forthcoming decade.
There is a growing trend of people preferring natural foods and beverages, which has compelled manufacturers to use natural preservatives like the quercetin in their products. The key reasons for this are health concerns around the use of artificial additives in food and beverage products, as well as environmental concerns about the production of chemicals.
Thus, a shift towards using more natural ingredients due to their various benefits coupled with an increasing focus on holistic wellness therapies and rising concerns over food safety will help the quercetin industry to thrive at a stellar pace during the projection period.
Today, quercetin is also being studied for its potential use in the prevention and treatment of diseases such as cancer, heart disease, diabetes, and Alzheimer's. Various trials are being conducted on quercetin worldwide to explore its therapeutic effects on ovarian cancer cells, prophylaxis, and several other medical conditions. For instance, a new clinical trial was conducted in 2020 to evaluate the possible role of quercetin in the prophylaxis and treatment of COVID-19. This in turn will create a conducive environment for the expansion of the quercetin industry.
Attribute |
Key Insights |
Global Quercetin Market Estimated Value (2022E) |
US$ 1,296 million |
Projected Market Value (2033F) |
US$ 3,968 million |
Value-based CAGR (2022 to 2032) |
12.4% |
USA Market Share |
48.6% |
Let us know your requirement to get
100% FREE customization
2017 to 2021 Quercetin Market Outlook Compared to 2022 to 2032 Forecast
The global quercetin demand is expected to grow at an impressive CAGR of over 12.4% between 2023 to 2033, in comparison to the 9.5% CAGR registered during the historical period from 2017 to 2021. The growing popularity of quercetin across diverse industries due to its numerous health benefits is a key factor driving the global quercetin industry forward.
Over the years, growing health awareness has prompted consumers to opt for food products and supplements containing ingredients like quercetin. This has provided a strong impetus to the global market.
Quercetin is a flavonoid commonly found in various fruits and vegetables. The substance possesses anti-inflammatory and antioxidant properties and thus helps to improve blood circulation, reduce the risk of heart diseases, and protect cells from damage. Hence, it is being increasingly used in pharmaceuticals, functional foods, nutraceuticals, and dietary supplements.
Increasing production and consumption of functional foods, dietary supplements, and nutraceuticals coupled with growing awareness about the potential benefits of quercetin will help the market to thrive at a stupendous pace over the next ten years.
Comparative Analysis of Quercetin Markets
Quercetin Market:
Differentiating Aspects |
Quercetin Market |
CAGR in 2022 to 2032 |
12.4% |
Current Valuation in 2022 |
US$ 1,296 million |
Projected Valuation in 2032 |
US$ 3,968 million |
Demand Drivers |
|
Food Coating Ingredients Market:
Differentiating Aspects |
Food Coating Ingredients Market |
CAGR in 2022 to 2032 |
6.4% |
Current Valuation in 2022 |
US$ 3.5 billion |
Projected Valuation in 2032 |
US$ 6.5 billion |
Demand Drivers |
|
Food Grade Lubricants Market:
Differentiating Aspects |
Food Grade Lubricants Market |
CAGR in 2022 to 2032 |
6.0% |
Current Valuation in 2022 |
US$ 258.43 million |
Projected Valuation in 2032 |
US$ 462.81 million |
Demand Drivers |
|
Find your sweet spots for generating winning opportunities in this market.
Talk to AnalystCountry-wise Insights
How is the USA Quercetin Market Shaping?
Rising Demand for Natural Healthy Food Ingredients Propelling Quercetin in the USA
In recent years, there has been a growing trend of consumers seeking out natural ingredients in their everyday lives. This has led to the growth of the USA global quercetin market.
According to Future Market Insights, quercetin demand in the USA is likely to surge at a robust pace during the next ten years owing to the rising inclination towards healthy food products and increasing awareness about health and wellbeing.
Similarly, the growing popularity of functional foods and supplements and the strong presence of leading players such as BASF SE, DSM Naturals Holding BV, and Wuxi App Tech Co., Ltd are positively influencing the USA quercetin industry.
How is the United Kingdom Assisting Europe in Becoming a Leading Global Quercetin Producer and Consumer?
Rising Application in Pharmaceutical Industry Boosting Sales in the United Kingdom
Europe is considered to become a leading global quercetin producer due to its favorable climate and favorable soil conditions. The continent has a long history of growing produce, making it well-suited to the cultivation of plants that produce quercetin. The region also has a high concentration of quercetin-rich plant species, making it possible for farmers to cultivate these crops profitably.
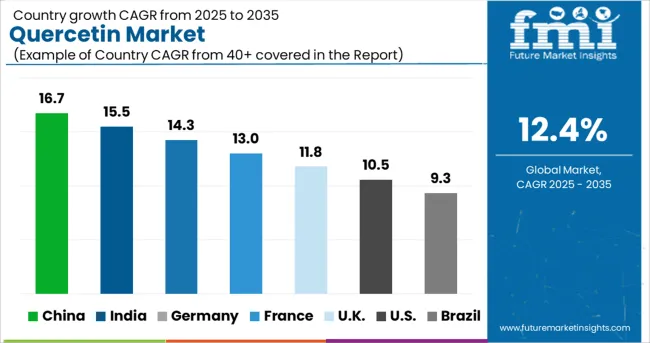
Further, European countries like the United Kingdom and Germany are witnessing high demand for food supplements and dietary supplements that contain quercetin. This will boost quercetin sales over the forecast period.
FMI, predicts the United Kingdom to emerge as one of the lucrative markets for quercetin across Europe during the forecast period, owing to the widening application of quercetin in pharmaceutical and dietary supplement sectors.
Category-wise Insights
Who is the Leading End User of Quercetin?
Food & Beverage Remains the Leading End User for Quercetin
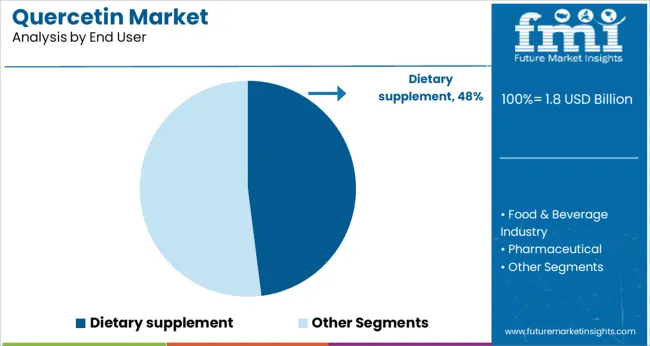
Based on end users, the global market for quercetin is segmented into the food & beverage industry, pharmaceutical, dietary supplement, and nutraceutical. Among these, the food & beverage industry holds the largest share of the global market owing to the rising usage of quercetin as a natural food and beverage preservative globally.
There is a growing trend of people preferring natural foods and beverages, which is driving the market for preservatives made from natural ingredients. The key reasons for this are health concerns around the use of artificial additives in food and beverage products, as well as environmental concerns about the production of chemicals. This has led to a shift towards using more natural ingredients like quercetin.
Similarly, growing demand for functional food products from health-conscious consumers will boost quercetin sales during the forecast period. As quercetin possesses antioxidant and anti-inflammatory properties, it has become an essential ingredient used by manufacturers of functional foods.
Additionally, factors such as increasing awareness about the benefits of using natural ingredients, rising focus on holistic wellness therapies, and growing food safety concerns will continue to generate high demand for quercetin over the next ten years.

A unified Market Research Subscription Platform, built for today's disparate research needs.
Competitive Landscape
Key players in the market include King herbs Ltd, Natural Anhui Biotechnology Co. Ltd., Xi’an Tianuri Biotech Co. Ltd., Natrol Llc., and Hengyang Densen Biotechnology co. ltd., Xi,anFrankherb Biotech Co. Ltd., Nanjing Zelang Medical Technology Co. Ltd., NOW Health Group Inc., Bluebonnet Nutrition Corporation, Wuxi Gorunjie Natural Pharma Co. Ltd., Oregon’s Wild Harvest Ltd., and Source Naturals Inc.
New product launches, investments in research and development (R&D), facility expansions, mergers, acquisitions, partnerships, and collaborations are some of the key strategies adopted by companies to increase their customer base and solidify their position in the market. Some of the recent developments are given below:
- In 2022, ALPS Pharmaceutical Ind. Co., Ltd. launched Eubioflavonoid, a water-soluble quercetin delivery composition derived from Sophora Japonica. The new product can deliver more quercetin to the body in a smaller dose.
- In 2022, Taiyo launched SunActive IsoQ, a water-soluble form of quercetin precursor that is many times higher than free quercetin.
- In 2022, Natrol and Jarrow, two leading vitamin and supplement brands, combined to pave the way for a new company called Vytalogy Wellness.
Scope of the Report
Attribute |
Details |
Estimated Market Size (2022) |
US$1,296 million |
Projected Market Size (2032) |
US$ 3,968 million |
Anticipated Growth Rate (2022 to 2032) |
12.4% CAGR |
Forecast Period |
2022 to 2032 |
Historical Data Available for |
2017 to 2021 |
Market Analysis |
US$ million for Value and million. Sq. M. for Volume |
Key Regions Covered |
North America, Latin America, Europe, East Asia, South Asia, and the Middle East & Africa |
Key Countries Covered |
The USA, Brazil, Mexico, Germany,United Kingdom, China, India, Japan, Australia, and GCC Countries |
Key Segments Covered |
Product, Nature, End User, Sales Channel, and Region |
Key Companies Profiled |
|
Report Coverage |
Market Forecast, Company Share Analysis, Competition Intelligence, DROT Analysis, Market Dynamics and Challenges, and Strategic Growth Initiatives |
Quercetin Industry by Category
By Product:
- Liquid
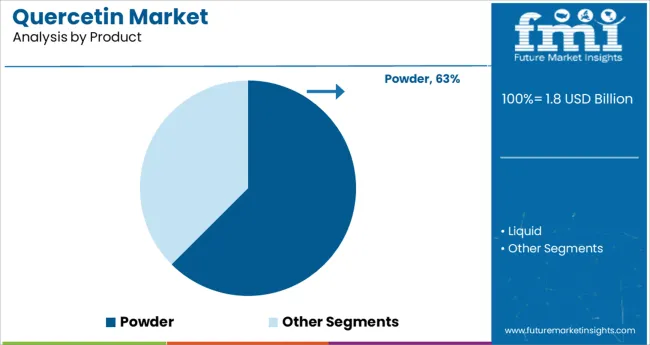
- Powder
By Nature:
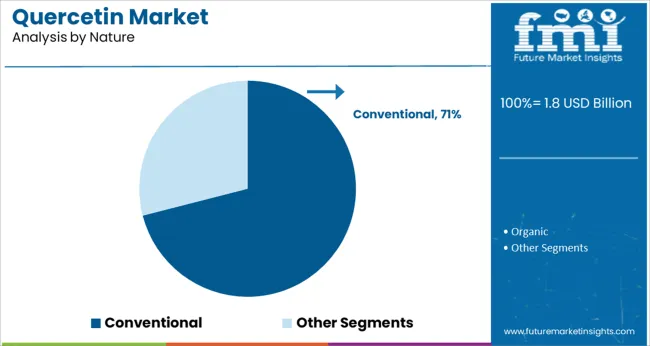
- Organic
- Inorganic
By End User:
- Food & Beverage Industry
- Pharmaceutical
- Dietary supplement
- Nutraceutical
By Sales Channel:
- Stored -based retailing
- Modern Grocery Store
- Convince store
- Discounters
- Hypermarket
- Supermarket
- Traditional Retailers
- Food specialist
- Independent small Grocer
- Other Grocers
- Online Retailing /Delivery
- Direct Sales
By Region:
- North America
- Latin America
- Europe
- Middle east and Africa
- East Asia
- South Asia
- Oceania
Frequently Asked Questions
How big is the global market for quercetin?
The global quercetin market size is assessed to be US$ 1,296 Mn currently (2022).
At what rate is the demand for quercetin expected to rise during the forecast period.?
The global quercetin demand is expected to rise at a CAGR of 12.4% between 2022 and 2032.
What is the demand outlook for the global quercetin industry in 2032?
By 2032, the worldwide quercetin industry is projected to surpass a valuation of US$ 3,968 Mn.
Which are the major countries driving demand for quercetin?
The USA, China, Canada, Germany, and Mexico are the major countries driving demand for quercetin.
At what rate will quercetin demand grow in China between 2022 and 2032?
Demand for quercetin in China is projected to grow at 12% CAGR from 2022 to 2032.
How will growth unfold in the India market?
The market for quercetin in India is projected to grow at a CAGR of 14.3% during the forecast period.
At what rate is the quercetin demand expected to grow in Japan?
The demand for quercetin in Japan is expected to grow at 11% CAGR over the next ten years.
Table of Content
1. Executive Summary 1.1. Global Market Outlook 1.2. Demand-side Trends 1.3. Supply-side Trends 1.4. Technology Roadmap Analysis 1.5. Analysis and Recommendations 2. Market Overview 2.1. Market Coverage / Taxonomy 2.2. Market Definition / Scope / Limitations 3. Market Background 3.1. Market Dynamics 3.1.1. Drivers 3.1.2. Restraints 3.1.3. Opportunity 3.1.4. Trends 3.2. Scenario Forecast 3.2.1. Demand in Optimistic Scenario 3.2.2. Demand in Likely Scenario 3.2.3. Demand in Conservative Scenario 3.3. Product launches & Recent Developments 3.4. Product Life Cycle Analysis 3.5. Value Chain Analysis 3.5.1. Supply Side Participants and their Roles 3.5.1.1. Producers 3.5.1.2. Mid-Level Participants (Traders/ Agents/ Brokers) 3.5.1.3. Wholesalers and Distributors 3.5.2. % of Operating Margin Analysis 3.5.3. List of Raw Material Suppliers 3.5.4. List of Existing and Potential Buyer’s 3.6. Global Market - Pricing Analysis 3.6.1. Price Point Assessment by Region 3.6.2. Price Point Assessment by Product Type 3.6.3. Price Forecast till 2033 3.6.4. Factors affecting pricing 3.7. Forecast Factors - Relevance & Impact 3.8. PESTLE and Porter’s Analysis 3.9. Regulatory Landscape 3.9.1. Packaging & Labelling Regulations 3.9.2. Certifications and Certifying Agency Overview 3.9.3. Import/Export Policies 3.10. Regional Parent Market Outlook 3.11. Production and Consumption Statistics 3.12. Import and Export Statistics 3.13. Consumers Survey Analysis 3.14. Macro-Economic Factors 3.15. Product Claims & Nutritional Information Scan by Buyers 4. Global Analysis 2017 to 2021and Forecast, 2022 to 2032 4.1. Historical Market Size Value (US$ million) & Volume (MT) Analysis, 2017 to 2021 4.2. Current and Future Market Size Value (US$ million) & Volume (MT) Projections, 2022 to 2032 4.2.1. Y-o-Y Growth Trend Analysis 4.2.2. Absolute $ Opportunity Analysis 5. Global Analysis 2017 to 2021 and Forecast 2022 to 2032, By Product 5.1. Introduction / Key Findings 5.2. Historical Market Size Value (US$ million) & Volume (MT) Analysis by Product, 2017 to 2021 5.3. Current and Future Market Size Value (US$ million) & Volume (MT) Analysis and Forecast by Product, 2022 to 2032 5.3.1. Liquid 5.3.2. Powder 5.4. Y-o-Y Growth Trend Analysis by Product, 2017 to 2021 5.5. Absolute $ Opportunity Analysis by Product, 2022 to 2032 6. Global Analysis 2017 to 2021and Forecast 2022 to 2032, By End User 6.1. Introduction / Key Findings 6.2. Historical Market Size Value (US$ million) & Volume (MT) Analysis by End User, 2017 to 2021 6.3. Current and Future Market Size Value (US$ million) & Volume (MT) Analysis and Forecast by End User, 2022 to 2032 6.3.1. Food & Beverage Industry 6.3.2. Pharmaceutical 6.3.3. Dietary supplement 6.3.4. Nutraceutical 6.4. Y-o-Y Growth Trend Analysis by End User, 2017 to 2021 6.5. Absolute $ Opportunity Analysis by End User, 2022 to 2032 7. Global Analysis 2017 to 2021and Forecast 2022 to 2032, By Nature 7.1. Introduction / Key Findings 7.2. Historical Market Size Value (US$ million) & Volume (MT) Analysis by Nature, 2017 to 2021 7.3. Current and Future Market Size Value (US$ million) & Volume (MT) Analysis and Forecast by Nature, 2022 to 2032 7.3.1. Organic 7.3.2. Conventional 7.4. Y-o-Y Growth Trend Analysis by Nature, 2017 to 2021 7.5. Absolute $ Opportunity Analysis by Nature, 2022 to 2032 8. Global Analysis 2017 to 2021and Forecast 2022 to 2032, By Sales Channel 8.1. Introduction / Key Findings 8.2. Historical Market Size Value (US$ million) & Volume (MT) Analysis by Sales Channel, 2017 to 2021 8.3. Current and Future Market Size Value (US$ million) & Volume (MT) Analysis and Forecast by Sales Channel, 2022 to 2032 8.3.1. Stored -based retailing 8.3.2. Modern Grocery Store 8.3.2.1. Convince store 8.3.2.2. Discounters 8.3.2.3. Hypermarket 8.3.2.4. Supermarket 8.3.3. Traditional Retailers 8.3.3.1. Food specialist 8.3.3.2. Independent small Grocer 8.3.3.3. Other Grocers 8.3.4. Online Retailing /Delivery 8.3.5. Direct Sales 8.4. Y-o-Y Growth Trend Analysis by Sales Channel, 2017 to 2021 8.5. Absolute $ Opportunity Analysis by Sales Channel, 2022 to 2032 9. Global Analysis 2017 to 2021and Forecast 2022 to 2032, By Region 9.1. Introduction 9.2. Historical Market Size Value (US$ million) & Volume (MT) Analysis by Region, 2017 to 2021 9.3. Current Market Size Value (US$ million) & Volume (MT) Analysis and Forecast by Region, 2022 to 2032 9.3.1. North America 9.3.2. Latin America 9.3.3. Europe 9.3.4. East Asia 9.3.5. South Asia 9.3.6. Oceania 9.3.7. MEA 9.4. Market Attractiveness Analysis by Region 10. North America Analysis 2017 to 2021and Forecast 2022 to 2032, By Country 10.1. Historical Market Size Value (US$ million) & Volume (MT) Trend Analysis by Market Taxonomy, 2017 to 2021 10.2. Market Size Value (US$ million) & Volume (MT) Forecast by Market Taxonomy, 2022 to 2032 10.2.1. By Country 10.2.1.1.The USA 10.2.1.2. Canada 10.2.2. By Product 10.2.3. By End User 10.2.4. By Nature 10.2.5. By Sales Channel 10.3. Market Attractiveness Analysis 10.3.1. By Country 10.3.2. By Product 10.3.3. By End User 10.3.4. By Nature 10.3.5. By Sales Channel 10.4. Key Takeaways 11. Latin America Analysis 2017 to 2021and Forecast 2022 to 2032, By Country 11.1. Historical Market Size Value (US$ million) & Volume (MT) Trend Analysis by Market Taxonomy, 2017 to 2021 11.2. Market Size Value (US$ million) & Volume (MT) Forecast by Market Taxonomy, 2022 to 2032 11.2.1. By Country 11.2.1.1. Brazil 11.2.1.2. Mexico 11.2.1.3. Argentina 11.2.1.4. Chile 11.2.1.5. Peru 11.2.1.6. Rest of Latin America 11.2.2. By Product 11.2.3. By End User 11.2.4. By Nature 11.2.5. By Sales Channel 11.3. Market Attractiveness Analysis 11.3.1. By Country 11.3.2. By Product 11.3.3. By End User 11.3.4. By Nature 11.3.5. By Sales Channel 11.4. Key Takeaways 12. Europe Analysis 2017 to 2021and Forecast 2022 to 2032, By Country 12.1. Historical Market Size Value (US$ million) & Volume (MT) Trend Analysis by Market Taxonomy, 2017 to 2021 12.2. Market Size Value (US$ million) & Volume (MT) Forecast by Market Taxonomy, 2022 to 2032 12.2.1. By Country 12.2.1.1. Germany 12.2.1.2. Italy 12.2.1.3. France 12.2.1.4. the United Kingdom 12.2.1.5. Spain 12.2.1.6. Russia 12.2.1.7. BENELUX 12.2.1.8. Poland 12.2.1.9. Nordic Countries 12.2.1.10. Rest of Europe 12.2.2. By Product 12.2.3. By End User 12.2.4. By Nature 12.2.5. By Sales Channel 12.3. Market Attractiveness Analysis 12.3.1. By Country 12.3.2. By Product 12.3.3. By End User 12.3.4. By Nature 12.3.5. By Sales Channel 12.4. Key Takeaways 13. East Asia Analysis 2017 to 2021and Forecast 2022 to 2032, By Country 13.1. Historical Market Size Value (US$ million) & Volume (MT) Trend Analysis by Market Taxonomy, 2017 to 2021 13.2. Market Size Value (US$ million) & Volume (MT) Forecast by Market Taxonomy, 2022 to 2032 13.2.1. By Country 13.2.1.1. China 13.2.1.2. Japan 13.2.1.3. South Korea 13.2.2. By Product 13.2.3. By End User 13.2.4. By Nature 13.2.5. By Sales Channel 13.3. Market Attractiveness Analysis 13.3.1. By Country 13.3.2. By Product 13.3.3. By End User 13.3.4. By Nature 13.3.5. By Sales Channel 13.4. Key Takeaways 14. South Asia Analysis 2017 to 2021and Forecast 2022 to 2032, By Country 14.1. Historical Market Size Value (US$ million) & Volume (MT) Trend Analysis by Market Taxonomy, 2017 to 2021 14.2. Market Size Value (US$ million) & Volume (MT) Forecast by Market Taxonomy, 2022 to 2032 14.2.1. By Country 14.2.1.1. India 14.2.1.2. Thailand 14.2.1.3. Malaysia 14.2.1.4. Indonesia 14.2.1.5. Singapore 14.2.1.6. Rest of South Asia 14.2.2. By Product 14.2.3. By End User 14.2.4. By Nature 14.2.5. By Sales Channel 14.3. Market Attractiveness Analysis 14.3.1. By Country 14.3.2. By Product 14.3.3. By End User 14.3.4. By Nature 14.3.5. By Sales Channel 14.4. Key Takeaways 15. Oceania Analysis 2017 to 2021and Forecast 2022 to 2032, By Country 15.1. Historical Market Size Value (US$ million) & Volume (MT) Trend Analysis by Market Taxonomy, 2017 to 2021 15.2. Market Size Value (US$ million) & Volume (MT) Forecast by Market Taxonomy, 2022 to 2032 15.2.1. By Country 15.2.1.1. Australia 15.2.1.2. New Zealand 15.2.2. By Product 15.2.3. By End User 15.2.4. By Nature 15.2.5. By Sales Channel 15.3. Market Attractiveness Analysis 15.3.1. By Country 15.3.2. By Product 15.3.3. By End User 15.3.4. By Nature 15.3.5. By Sales Channel 15.4. Key Takeaways 16. MEA Analysis 2017 to 2021and Forecast 2022 to 2032, By Country 16.1. Historical Market Size Value (US$ million) & Volume (MT) Trend Analysis by Market Taxonomy, 2017 to 2021 16.2. Market Size Value (US$ million) & Volume (MT) Forecast by Market Taxonomy, 2022 to 2032 16.2.1. By Country 16.2.1.1. GCC Countries 16.2.1.2. South Africa 16.2.1.3. Central Africa 16.2.1.4. North Africa 16.2.2. By Product 16.2.3. By End User 16.2.4. By Nature 16.2.5. By Sales Channel 16.3. Market Attractiveness Analysis 16.3.1. By Country 16.3.2. By Product 16.3.3. By End User 16.3.4. By Nature 16.3.5. By Sales Channel 16.4. Key Takeaways 17. Key Countries Analysis 17.1. The USA 17.1.1. Pricing Analysis 17.1.2. Market Share Analysis, 2022 17.1.2.1. By Product 17.1.2.2. By End User 17.1.2.3. By Nature 17.1.2.4. By Sales Channel 17.2. Canada 17.2.1. Pricing Analysis 17.2.2. Market Share Analysis, 2022 17.2.2.1. By Product 17.2.2.2. By End User 17.2.2.3. By Nature 17.2.2.4. By Sales Channel 17.3. Brazil 17.3.1. Pricing Analysis 17.3.2. Market Share Analysis, 2022 17.3.2.1. By Product 17.3.2.2. By End User 17.3.2.3. By Nature 17.3.2.4. By Sales Channel 17.4. Mexico 17.4.1. Pricing Analysis 17.4.2. Market Share Analysis, 2022 17.4.2.1. By Product 17.4.2.2. By End User 17.4.2.3. By Nature 17.4.2.4. By Sales Channel 17.5. Argentina 17.5.1. Pricing Analysis 17.5.2. Market Share Analysis, 2022 17.5.2.1. By Product 17.5.2.2. By End User 17.5.2.3. By Nature 17.5.2.4. By Sales Channel 17.6. Chile 17.6.1. Pricing Analysis 17.6.2. Market Share Analysis, 2022 17.6.2.1. By Product 17.6.2.2. By End User 17.6.2.3. By Nature 17.6.2.4. By Sales Channel 17.7. Peru 17.7.1. Pricing Analysis 17.7.2. Market Share Analysis, 2022 17.7.2.1. By Product 17.7.2.2. By End User 17.7.2.3. By Nature 17.7.2.4. By Sales Channel 17.8. Germany 17.8.1. Pricing Analysis 17.8.2. Market Share Analysis, 2022 17.8.2.1. By Product 17.8.2.2. By End User 17.8.2.3. By Nature 17.8.2.4. By Sales Channel 17.9. Italy 17.9.1. Pricing Analysis 17.9.2. Market Share Analysis, 2022 17.9.2.1. By Product 17.9.2.2. By End User 17.9.2.3. By Nature 17.9.2.4. By Sales Channel 17.10. France 17.10.1. Pricing Analysis 17.10.2. Market Share Analysis, 2022 17.10.2.1. By Product 17.10.2.2. By End User 17.10.2.3. By Nature 17.10.2.4. By Sales Channel 17.11. Spain 17.11.1. Pricing Analysis 17.11.2. Market Share Analysis, 2022 17.11.2.1. By Product 17.11.2.2. By End User 17.11.2.3. By Nature 17.11.2.4. By Sales Channel 17.12. the United Kingdom 17.12.1. Pricing Analysis 17.12.2. Market Share Analysis, 2022 17.12.2.1. By Product 17.12.2.2. By End User 17.12.2.3. By Nature 17.12.2.4. By Sales Channel 17.13. Russia 17.13.1. Pricing Analysis 17.13.2. Market Share Analysis, 2022 17.13.2.1. By Product 17.13.2.2. By End User 17.13.2.3. By Nature 17.13.2.4. By Sales Channel 17.14. Poland 17.14.1. Pricing Analysis 17.14.2. Market Share Analysis, 2022 17.14.2.1. By Product 17.14.2.2. By End User 17.14.2.3. By Nature 17.14.2.4. By Sales Channel 17.15. BENELUX 17.15.1. Pricing Analysis 17.15.2. Market Share Analysis, 2022 17.15.2.1. By Product 17.15.2.2. By End User 17.15.2.3. By Nature 17.15.2.4. By Sales Channel 17.16. Nordic Countries 17.16.1. Pricing Analysis 17.16.2. Market Share Analysis, 2022 17.16.2.1. By Product 17.16.2.2. By End User 17.16.2.3. By Nature 17.16.2.4. By Sales Channel 17.17. China 17.17.1. Pricing Analysis 17.17.2. Market Share Analysis, 2022 17.17.2.1. By Product 17.17.2.2. By End User 17.17.2.3. By Nature 17.17.2.4. By Sales Channel 17.18. Japan 17.18.1. Pricing Analysis 17.18.2. Market Share Analysis, 2022 17.18.2.1. By Product 17.18.2.2. By End User 17.18.2.3. By Nature 17.18.2.4. By Sales Channel 17.19. South Korea 17.19.1. Pricing Analysis 17.19.2. Market Share Analysis, 2022 17.19.2.1. By Product 17.19.2.2. By End User 17.19.2.3. By Nature 17.19.2.4. By Sales Channel 17.20. India 17.20.1. Pricing Analysis 17.20.2. Market Share Analysis, 2022 17.20.2.1. By Product 17.20.2.2. By End User 17.20.2.3. By Nature 17.20.2.4. By Sales Channel 17.21. Thailand 17.21.1. Pricing Analysis 17.21.2. Market Share Analysis, 2022 17.21.2.1. By Product 17.21.2.2. By End User 17.21.2.3. By Nature 17.21.2.4. By Sales Channel 17.22. Indonesia 17.22.1. Pricing Analysis 17.22.2. Market Share Analysis, 2022 17.22.2.1. By Product 17.22.2.2. By End User 17.22.2.3. By Nature 17.22.2.4. By Sales Channel 17.23. Malaysia 17.23.1. Pricing Analysis 17.23.2. Market Share Analysis, 2022 17.23.2.1. By Product 17.23.2.2. By End User 17.23.2.3. By Nature 17.23.2.4. By Sales Channel 17.24. Singapore 17.24.1. Pricing Analysis 17.24.2. Market Share Analysis, 2022 17.24.2.1. By Product 17.24.2.2. By End User 17.24.2.3. By Nature 17.24.2.4. By Sales Channel 17.25. Australia 17.25.1. Pricing Analysis 17.25.2. Market Share Analysis, 2022 17.25.2.1. By Product 17.25.2.2. By End User 17.25.2.3. By Nature 17.25.2.4. By Sales Channel 17.26. New Zealand 17.26.1. Pricing Analysis 17.26.2. Market Share Analysis, 2022 17.26.2.1. By Product 17.26.2.2. By End User 17.26.2.3. By Nature 17.26.2.4. By Sales Channel 17.27. GCC Countries 17.27.1. Pricing Analysis 17.27.2. Market Share Analysis, 2022 17.27.2.1. By Product 17.27.2.2. By End User 17.27.2.3. By Nature 17.27.2.4. By Sales Channel 17.28. South Africa 17.28.1. Pricing Analysis 17.28.2. Market Share Analysis, 2022 17.28.2.1. By Product 17.28.2.2. By End User 17.28.2.3. By Nature 17.28.2.4. By Sales Channel 17.29. North Africa 17.29.1. Pricing Analysis 17.29.2. Market Share Analysis, 2022 17.29.2.1. By Product 17.29.2.2. By End User 17.29.2.3. By Nature 17.29.2.4. By Sales Channel 17.30. Central Africa 17.30.1. Pricing Analysis 17.30.2. Market Share Analysis, 2022 17.30.2.1. By Product 17.30.2.2. By End User 17.30.2.3. By Nature 17.30.2.4. By Sales Channel 18. Market Structure Analysis 18.1. Competition Dashboard 18.2. Competition Benchmarking 18.3. Market Share Analysis of Top Players 18.3.1. By Regional 18.3.2. By Product 18.3.3. By End User 18.3.4. By Nature 18.3.5. By Sales Channel 19. Competition Analysis 19.1. Competition Deep Dive 19.1.1. Kingherbs Ltd 19.1.1.1. Overview 19.1.1.2. Product Portfolio 19.1.1.3. Profitability by Market Segments (Product/End User/Nature/Sales Channel/Region) 19.1.1.4. Sales Footprint 19.1.1.5. Strategy Overview 19.1.1.5.1. Marketing Strategy 19.1.1.5.2. Product Strategy 19.1.1.5.3. Channel Strategy 19.1.2. Natural Anhui Biotechnology Co. Ltd. 19.1.2.1. Overview 19.1.2.2. Product Portfolio 19.1.2.3. Profitability by Market Segments (Product/End User/Nature/Sales Channel/Region) 19.1.2.4. Sales Footprint 19.1.2.5. Strategy Overview 19.1.2.5.1. Marketing Strategy 19.1.2.5.2. Product Strategy 19.1.2.5.3. Channel Strategy 19.1.3. Xi’an Tianuri Biotech Co. Ltd. 19.1.3.1. Overview 19.1.3.2. Product Portfolio 19.1.3.3. Profitability by Market Segments (Product/End User/Nature/Sales Channel/Region) 19.1.3.4. Sales Footprint 19.1.3.5. Strategy Overview 19.1.3.5.1. Marketing Strategy 19.1.3.5.2. Product Strategy 19.1.3.5.3. Channel Strategy 19.1.4. Natrol Llc. 19.1.4.1. Overview 19.1.4.2. Product Portfolio 19.1.4.3. Profitability by Market Segments (Product/End User/Nature/Sales Channel/Region) 19.1.4.4. Sales Footprint 19.1.4.5. Strategy Overview 19.1.4.5.1. Marketing Strategy 19.1.4.5.2. Product Strategy 19.1.4.5.3. Channel Strategy 19.1.5. Hengyang Densen Biotechnology Co. Ltd. 19.1.5.1. Overview 19.1.5.2. Product Portfolio 19.1.5.3. Profitability by Market Segments (Product/End User/Nature/Sales Channel/Region) 19.1.5.4. Sales Footprint 19.1.5.5. Strategy Overview 19.1.5.5.1. Marketing Strategy 19.1.5.5.2. Product Strategy 19.1.5.5.3. Channel Strategy 19.1.6. Xi, An Frankherb Biotech Co. Ltd. 19.1.6.1. Overview 19.1.6.2. Product Portfolio 19.1.6.3. Profitability by Market Segments (Product/End User/Nature/Sales Channel/Region) 19.1.6.4. Sales Footprint 19.1.6.5. Strategy Overview 19.1.6.5.1. Marketing Strategy 19.1.6.5.2. Product Strategy 19.1.6.5.3. Channel Strategy 19.1.7. Nanjing Zelang Medical Technology Co. Ltd. 19.1.7.1. Overview 19.1.7.2. Product Portfolio 19.1.7.3. Profitability by Market Segments (Product/End User/Nature/Sales Channel/Region) 19.1.7.4. Sales Footprint 19.1.7.5. Strategy Overview 19.1.7.5.1. Marketing Strategy 19.1.7.5.2. Product Strategy 19.1.7.5.3. Channel Strategy 19.1.8. NOW Health Group Inc. 19.1.8.1. Overview 19.1.8.2. Product Portfolio 19.1.8.3. Profitability by Market Segments (Product/End User/Nature/Sales Channel/Region) 19.1.8.4. Sales Footprint 19.1.8.5. Strategy Overview 19.1.8.5.1. Marketing Strategy 19.1.8.5.2. Product Strategy 19.1.8.5.3. Channel Strategy 19.1.9. Bluebonnet Nutrition Corporation 19.1.9.1. Overview 19.1.9.2. Product Portfolio 19.1.9.3. Profitability by Market Segments (Product/End User/Nature/Sales Channel/Region) 19.1.9.4. Sales Footprint 19.1.9.5. Strategy Overview 19.1.9.5.1. Marketing Strategy 19.1.9.5.2. Product Strategy 19.1.9.5.3. Channel Strategy 19.1.10. Wuxi Gorunjie Natural Pharma Co. Ltd. 19.1.10.1. Overview 19.1.10.2. Product Portfolio 19.1.10.3. Profitability by Market Segments (Product/End User/Nature/Sales Channel/Region) 19.1.10.4. Sales Footprint 19.1.10.5. Strategy Overview 19.1.10.5.1. Marketing Strategy 19.1.10.5.2. Product Strategy 19.1.10.5.3. Channel Strategy 19.1.11. Oregon’s Wild Harvest Ltd. 19.1.11.1. Overview 19.1.11.2. Product Portfolio 19.1.11.3. Profitability by Market Segments (Product/End User/Nature/Sales Channel/Region) 19.1.11.4. Sales Footprint 19.1.11.5. Strategy Overview 19.1.11.5.1. Marketing Strategy 19.1.11.5.2. Product Strategy 19.1.11.5.3. Channel Strategy 19.1.12. Source Naturals Inc 19.1.12.1. Overview 19.1.12.2. Product Portfolio 19.1.12.3. Profitability by Market Segments (Product/End User/Nature/Sales Channel/Region) 19.1.12.4. Sales Footprint 19.1.12.5. Strategy Overview 19.1.12.5.1. Marketing Strategy 19.1.12.5.2. Product Strategy 19.1.12.5.3. Channel Strategy 20. Assumptions & Acronyms Used 21. Research Methodology
Let us know your requirement to get
100% FREE customization
List of Tables
Table 1: Global Value (US$ million) Forecast by Region, 2017 to 2032 Table 2: Global Volume (MT) Forecast by Region, 2017 to 2032 Table 3: Global Value (US$ million) Forecast by Product, 2017 to 2032 Table 4: Global Volume (MT) Forecast by Product, 2017 to 2032 Table 5: Global Value (US$ million) Forecast by End User, 2017 to 2032 Table 6: Global Volume (MT) Forecast by End User, 2017 to 2032 Table 7: Global Value (US$ million) Forecast by Nature, 2017 to 2032 Table 8: Global Volume (MT) Forecast by Nature, 2017 to 2032 Table 9: Global Value (US$ million) Forecast by Sales Channel, 2017 to 2032 Table 10: Global Volume (MT) Forecast by Sales Channel, 2017 to 2032 Table 11: North America Value (US$ million) Forecast by Country, 2017 to 2032 Table 12: North America Volume (MT) Forecast by Country, 2017 to 2032 Table 13: North America Value (US$ million) Forecast by Product, 2017 to 2032 Table 14: North America Volume (MT) Forecast by Product, 2017 to 2032 Table 15: North America Value (US$ million) Forecast by End User, 2017 to 2032 Table 16: North America Volume (MT) Forecast by End User, 2017 to 2032 Table 17: North America Value (US$ million) Forecast by Nature, 2017 to 2032 Table 18: North America Volume (MT) Forecast by Nature, 2017 to 2032 Table 19: North America Value (US$ million) Forecast by Sales Channel, 2017 to 2032 Table 20: North America Volume (MT) Forecast by Sales Channel, 2017 to 2032 Table 21: Latin America Value (US$ million) Forecast by Country, 2017 to 2032 Table 22: Latin America Volume (MT) Forecast by Country, 2017 to 2032 Table 23: Latin America Value (US$ million) Forecast by Product, 2017 to 2032 Table 24: Latin America Volume (MT) Forecast by Product, 2017 to 2032 Table 25: Latin America Value (US$ million) Forecast by End User, 2017 to 2032 Table 26: Latin America Volume (MT) Forecast by End User, 2017 to 2032 Table 27: Latin America Value (US$ million) Forecast by Nature, 2017 to 2032 Table 28: Latin America Volume (MT) Forecast by Nature, 2017 to 2032 Table 29: Latin America Value (US$ million) Forecast by Sales Channel, 2017 to 2032 Table 30: Latin America Volume (MT) Forecast by Sales Channel, 2017 to 2032 Table 31: Europe Value (US$ million) Forecast by Country, 2017 to 2032 Table 32: Europe Volume (MT) Forecast by Country, 2017 to 2032 Table 33: Europe Value (US$ million) Forecast by Product, 2017 to 2032 Table 34: Europe Volume (MT) Forecast by Product, 2017 to 2032 Table 35: Europe Value (US$ million) Forecast by End User, 2017 to 2032 Table 36: Europe Volume (MT) Forecast by End User, 2017 to 2032 Table 37: Europe Value (US$ million) Forecast by Nature, 2017 to 2032 Table 38: Europe Volume (MT) Forecast by Nature, 2017 to 2032 Table 39: Europe Value (US$ million) Forecast by Sales Channel, 2017 to 2032 Table 40: Europe Volume (MT) Forecast by Sales Channel, 2017 to 2032 Table 41: East Asia Value (US$ million) Forecast by Country, 2017 to 2032 Table 42: East Asia Volume (MT) Forecast by Country, 2017 to 2032 Table 43: East Asia Value (US$ million) Forecast by Product, 2017 to 2032 Table 44: East Asia Volume (MT) Forecast by Product, 2017 to 2032 Table 45: East Asia Value (US$ million) Forecast by End User, 2017 to 2032 Table 46: East Asia Volume (MT) Forecast by End User, 2017 to 2032 Table 47: East Asia Value (US$ million) Forecast by Nature, 2017 to 2032 Table 48: East Asia Volume (MT) Forecast by Nature, 2017 to 2032 Table 49: East Asia Value (US$ million) Forecast by Sales Channel, 2017 to 2032 Table 50: East Asia Volume (MT) Forecast by Sales Channel, 2017 to 2032 Table 51: South Asia Value (US$ million) Forecast by Country, 2017 to 2032 Table 52: South Asia Volume (MT) Forecast by Country, 2017 to 2032 Table 53: South Asia Value (US$ million) Forecast by Product, 2017 to 2032 Table 54: South Asia Volume (MT) Forecast by Product, 2017 to 2032 Table 55: South Asia Value (US$ million) Forecast by End User, 2017 to 2032 Table 56: South Asia Volume (MT) Forecast by End User, 2017 to 2032 Table 57: South Asia Value (US$ million) Forecast by Nature, 2017 to 2032 Table 58: South Asia Volume (MT) Forecast by Nature, 2017 to 2032 Table 59: South Asia Value (US$ million) Forecast by Sales Channel, 2017 to 2032 Table 60: South Asia Volume (MT) Forecast by Sales Channel, 2017 to 2032 Table 61: Oceania Value (US$ million) Forecast by Country, 2017 to 2032 Table 62: Oceania Volume (MT) Forecast by Country, 2017 to 2032 Table 63: Oceania Value (US$ million) Forecast by Product, 2017 to 2032 Table 64: Oceania Volume (MT) Forecast by Product, 2017 to 2032 Table 65: Oceania Value (US$ million) Forecast by End User, 2017 to 2032 Table 66: Oceania Volume (MT) Forecast by End User, 2017 to 2032 Table 67: Oceania Value (US$ million) Forecast by Nature, 2017 to 2032 Table 68: Oceania Volume (MT) Forecast by Nature, 2017 to 2032 Table 69: Oceania Value (US$ million) Forecast by Sales Channel, 2017 to 2032 Table 70: Oceania Volume (MT) Forecast by Sales Channel, 2017 to 2032 Table 71: MEA Value (US$ million) Forecast by Country, 2017 to 2032 Table 72: MEA Volume (MT) Forecast by Country, 2017 to 2032 Table 73: MEA Value (US$ million) Forecast by Product, 2017 to 2032 Table 74: MEA Volume (MT) Forecast by Product, 2017 to 2032 Table 75: MEA Value (US$ million) Forecast by End User, 2017 to 2032 Table 76: MEA Volume (MT) Forecast by End User, 2017 to 2032 Table 77: MEA Value (US$ million) Forecast by Nature, 2017 to 2032 Table 78: MEA Volume (MT) Forecast by Nature, 2017 to 2032 Table 79: MEA Value (US$ million) Forecast by Sales Channel, 2017 to 2032 Table 80: MEA Volume (MT) Forecast by Sales Channel, 2017 to 2032
Find your sweet spots for generating winning opportunities in this market.
Talk to AnalystList of Charts
Figure 1: Global Value (US$ million) by Product, 2022 to 2032 Figure 2: Global Value (US$ million) by End User, 2022 to 2032 Figure 3: Global Value (US$ million) by Nature, 2022 to 2032 Figure 4: Global Value (US$ million) by Sales Channel, 2022 to 2032 Figure 5: Global Value (US$ million) by Region, 2022 to 2032 Figure 6: Global Value (US$ million) Analysis by Region, 2017 to 2032 Figure 7: Global Volume (MT) Analysis by Region, 2017 to 2032 Figure 8: Global Value Share (%) and BPS Analysis by Region, 2022 to 2032 Figure 9: Global Y-o-Y Growth (%) Projections by Region, 2022 to 2032 Figure 10: Global Value (US$ million) Analysis by Product, 2017 to 2032 Figure 11: Global Volume (MT) Analysis by Product, 2017 to 2032 Figure 12: Global Value Share (%) and BPS Analysis by Product, 2022 to 2032 Figure 13: Global Y-o-Y Growth (%) Projections by Product, 2022 to 2032 Figure 14: Global Value (US$ million) Analysis by End User, 2017 to 2032 Figure 15: Global Volume (MT) Analysis by End User, 2017 to 2032 Figure 16: Global Value Share (%) and BPS Analysis by End User, 2022 to 2032 Figure 17: Global Y-o-Y Growth (%) Projections by End User, 2022 to 2032 Figure 18: Global Value (US$ million) Analysis by Nature, 2017 to 2032 Figure 19: Global Volume (MT) Analysis by Nature, 2017 to 2032 Figure 20: Global Value Share (%) and BPS Analysis by Nature, 2022 to 2032 Figure 21: Global Y-o-Y Growth (%) Projections by Nature, 2022 to 2032 Figure 22: Global Value (US$ million) Analysis by Sales Channel, 2017 to 2032 Figure 23: Global Volume (MT) Analysis by Sales Channel, 2017 to 2032 Figure 24: Global Value Share (%) and BPS Analysis by Sales Channel, 2022 to 2032 Figure 25: Global Y-o-Y Growth (%) Projections by Sales Channel, 2022 to 2032 Figure 26: Global Attractiveness by Product, 2022 to 2032 Figure 27: Global Attractiveness by End User, 2022 to 2032 Figure 28: Global Attractiveness by Nature, 2022 to 2032 Figure 29: Global Attractiveness by Sales Channel, 2022 to 2032 Figure 30: Global Attractiveness by Region, 2022 to 2032 Figure 31: North America Value (US$ million) by Product, 2022 to 2032 Figure 32: North America Value (US$ million) by End User, 2022 to 2032 Figure 33: North America Value (US$ million) by Nature, 2022 to 2032 Figure 34: North America Value (US$ million) by Sales Channel, 2022 to 2032 Figure 35: North America Value (US$ million) by Country, 2022 to 2032 Figure 36: North America Value (US$ million) Analysis by Country, 2017 to 2032 Figure 37: North America Volume (MT) Analysis by Country, 2017 to 2032 Figure 38: North America Value Share (%) and BPS Analysis by Country, 2022 to 2032 Figure 39: North America Y-o-Y Growth (%) Projections by Country, 2022 to 2032 Figure 40: North America Value (US$ million) Analysis by Product, 2017 to 2032 Figure 41: North America Volume (MT) Analysis by Product, 2017 to 2032 Figure 42: North America Value Share (%) and BPS Analysis by Product, 2022 to 2032 Figure 43: North America Y-o-Y Growth (%) Projections by Product, 2022 to 2032 Figure 44: North America Value (US$ million) Analysis by End User, 2017 to 2032 Figure 45: North America Volume (MT) Analysis by End User, 2017 to 2032 Figure 46: North America Value Share (%) and BPS Analysis by End User, 2022 to 2032 Figure 47: North America Y-o-Y Growth (%) Projections by End User, 2022 to 2032 Figure 48: North America Value (US$ million) Analysis by Nature, 2017 to 2032 Figure 49: North America Volume (MT) Analysis by Nature, 2017 to 2032 Figure 50: North America Value Share (%) and BPS Analysis by Nature, 2022 to 2032 Figure 51: North America Y-o-Y Growth (%) Projections by Nature, 2022 to 2032 Figure 52: North America Value (US$ million) Analysis by Sales Channel, 2017 to 2032 Figure 53: North America Volume (MT) Analysis by Sales Channel, 2017 to 2032 Figure 54: North America Value Share (%) and BPS Analysis by Sales Channel, 2022 to 2032 Figure 55: North America Y-o-Y Growth (%) Projections by Sales Channel, 2022 to 2032 Figure 56: North America Attractiveness by Product, 2022 to 2032 Figure 57: North America Attractiveness by End User, 2022 to 2032 Figure 58: North America Attractiveness by Nature, 2022 to 2032 Figure 59: North America Attractiveness by Sales Channel, 2022 to 2032 Figure 60: North America Attractiveness by Country, 2022 to 2032 Figure 61: Latin America Value (US$ million) by Product, 2022 to 2032 Figure 62: Latin America Value (US$ million) by End User, 2022 to 2032 Figure 63: Latin America Value (US$ million) by Nature, 2022 to 2032 Figure 64: Latin America Value (US$ million) by Sales Channel, 2022 to 2032 Figure 65: Latin America Value (US$ million) by Country, 2022 to 2032 Figure 66: Latin America Value (US$ million) Analysis by Country, 2017 to 2032 Figure 67: Latin America Volume (MT) Analysis by Country, 2017 to 2032 Figure 68: Latin America Value Share (%) and BPS Analysis by Country, 2022 to 2032 Figure 69: Latin America Y-o-Y Growth (%) Projections by Country, 2022 to 2032 Figure 70: Latin America Value (US$ million) Analysis by Product, 2017 to 2032 Figure 71: Latin America Volume (MT) Analysis by Product, 2017 to 2032 Figure 72: Latin America Value Share (%) and BPS Analysis by Product, 2022 to 2032 Figure 73: Latin America Y-o-Y Growth (%) Projections by Product, 2022 to 2032 Figure 74: Latin America Value (US$ million) Analysis by End User, 2017 to 2032 Figure 75: Latin America Volume (MT) Analysis by End User, 2017 to 2032 Figure 76: Latin America Value Share (%) and BPS Analysis by End User, 2022 to 2032 Figure 77: Latin America Y-o-Y Growth (%) Projections by End User, 2022 to 2032 Figure 78: Latin America Value (US$ million) Analysis by Nature, 2017 to 2032 Figure 79: Latin America Volume (MT) Analysis by Nature, 2017 to 2032 Figure 80: Latin America Value Share (%) and BPS Analysis by Nature, 2022 to 2032 Figure 81: Latin America Y-o-Y Growth (%) Projections by Nature, 2022 to 2032 Figure 82: Latin America Value (US$ million) Analysis by Sales Channel, 2017 to 2032 Figure 83: Latin America Volume (MT) Analysis by Sales Channel, 2017 to 2032 Figure 84: Latin America Value Share (%) and BPS Analysis by Sales Channel, 2022 to 2032 Figure 85: Latin America Y-o-Y Growth (%) Projections by Sales Channel, 2022 to 2032 Figure 86: Latin America Attractiveness by Product, 2022 to 2032 Figure 87: Latin America Attractiveness by End User, 2022 to 2032 Figure 88: Latin America Attractiveness by Nature, 2022 to 2032 Figure 89: Latin America Attractiveness by Sales Channel, 2022 to 2032 Figure 90: Latin America Attractiveness by Country, 2022 to 2032 Figure 91: Europe Value (US$ million) by Product, 2022 to 2032 Figure 92: Europe Value (US$ million) by End User, 2022 to 2032 Figure 93: Europe Value (US$ million) by Nature, 2022 to 2032 Figure 94: Europe Value (US$ million) by Sales Channel, 2022 to 2032 Figure 95: Europe Value (US$ million) by Country, 2022 to 2032 Figure 96: Europe Value (US$ million) Analysis by Country, 2017 to 2032 Figure 97: Europe Volume (MT) Analysis by Country, 2017 to 2032 Figure 98: Europe Value Share (%) and BPS Analysis by Country, 2022 to 2032 Figure 99: Europe Y-o-Y Growth (%) Projections by Country, 2022 to 2032 Figure 100: Europe Value (US$ million) Analysis by Product, 2017 to 2032 Figure 101: Europe Volume (MT) Analysis by Product, 2017 to 2032 Figure 102: Europe Value Share (%) and BPS Analysis by Product, 2022 to 2032 Figure 103: Europe Y-o-Y Growth (%) Projections by Product, 2022 to 2032 Figure 104: Europe Value (US$ million) Analysis by End User, 2017 to 2032 Figure 105: Europe Volume (MT) Analysis by End User, 2017 to 2032 Figure 106: Europe Value Share (%) and BPS Analysis by End User, 2022 to 2032 Figure 107: Europe Y-o-Y Growth (%) Projections by End User, 2022 to 2032 Figure 108: Europe Value (US$ million) Analysis by Nature, 2017 to 2032 Figure 109: Europe Volume (MT) Analysis by Nature, 2017 to 2032 Figure 110: Europe Value Share (%) and BPS Analysis by Nature, 2022 to 2032 Figure 111: Europe Y-o-Y Growth (%) Projections by Nature, 2022 to 2032 Figure 112: Europe Value (US$ million) Analysis by Sales Channel, 2017 to 2032 Figure 113: Europe Volume (MT) Analysis by Sales Channel, 2017 to 2032 Figure 114: Europe Value Share (%) and BPS Analysis by Sales Channel, 2022 to 2032 Figure 115: Europe Y-o-Y Growth (%) Projections by Sales Channel, 2022 to 2032 Figure 116: Europe Attractiveness by Product, 2022 to 2032 Figure 117: Europe Attractiveness by End User, 2022 to 2032 Figure 118: Europe Attractiveness by Nature, 2022 to 2032 Figure 119: Europe Attractiveness by Sales Channel, 2022 to 2032 Figure 120: Europe Attractiveness by Country, 2022 to 2032 Figure 121: East Asia Value (US$ million) by Product, 2022 to 2032 Figure 122: East Asia Value (US$ million) by End User, 2022 to 2032 Figure 123: East Asia Value (US$ million) by Nature, 2022 to 2032 Figure 124: East Asia Value (US$ million) by Sales Channel, 2022 to 2032 Figure 125: East Asia Value (US$ million) by Country, 2022 to 2032 Figure 126: East Asia Value (US$ million) Analysis by Country, 2017 to 2032 Figure 127: East Asia Volume (MT) Analysis by Country, 2017 to 2032 Figure 128: East Asia Value Share (%) and BPS Analysis by Country, 2022 to 2032 Figure 129: East Asia Y-o-Y Growth (%) Projections by Country, 2022 to 2032 Figure 130: East Asia Value (US$ million) Analysis by Product, 2017 to 2032 Figure 131: East Asia Volume (MT) Analysis by Product, 2017 to 2032 Figure 132: East Asia Value Share (%) and BPS Analysis by Product, 2022 to 2032 Figure 133: East Asia Y-o-Y Growth (%) Projections by Product, 2022 to 2032 Figure 134: East Asia Value (US$ million) Analysis by End User, 2017 to 2032 Figure 135: East Asia Volume (MT) Analysis by End User, 2017 to 2032 Figure 136: East Asia Value Share (%) and BPS Analysis by End User, 2022 to 2032 Figure 137: East Asia Y-o-Y Growth (%) Projections by End User, 2022 to 2032 Figure 138: East Asia Value (US$ million) Analysis by Nature, 2017 to 2032 Figure 139: East Asia Volume (MT) Analysis by Nature, 2017 to 2032 Figure 140: East Asia Value Share (%) and BPS Analysis by Nature, 2022 to 2032 Figure 141: East Asia Y-o-Y Growth (%) Projections by Nature, 2022 to 2032 Figure 142: East Asia Value (US$ million) Analysis by Sales Channel, 2017 to 2032 Figure 143: East Asia Volume (MT) Analysis by Sales Channel, 2017 to 2032 Figure 144: East Asia Value Share (%) and BPS Analysis by Sales Channel, 2022 to 2032 Figure 145: East Asia Y-o-Y Growth (%) Projections by Sales Channel, 2022 to 2032 Figure 146: East Asia Attractiveness by Product, 2022 to 2032 Figure 147: East Asia Attractiveness by End User, 2022 to 2032 Figure 148: East Asia Attractiveness by Nature, 2022 to 2032 Figure 149: East Asia Attractiveness by Sales Channel, 2022 to 2032 Figure 150: East Asia Attractiveness by Country, 2022 to 2032 Figure 151: South Asia Value (US$ million) by Product, 2022 to 2032 Figure 152: South Asia Value (US$ million) by End User, 2022 to 2032 Figure 153: South Asia Value (US$ million) by Nature, 2022 to 2032 Figure 154: South Asia Value (US$ million) by Sales Channel, 2022 to 2032 Figure 155: South Asia Value (US$ million) by Country, 2022 to 2032 Figure 156: South Asia Value (US$ million) Analysis by Country, 2017 to 2032 Figure 157: South Asia Volume (MT) Analysis by Country, 2017 to 2032 Figure 158: South Asia Value Share (%) and BPS Analysis by Country, 2022 to 2032 Figure 159: South Asia Y-o-Y Growth (%) Projections by Country, 2022 to 2032 Figure 160: South Asia Value (US$ million) Analysis by Product, 2017 to 2032 Figure 161: South Asia Volume (MT) Analysis by Product, 2017 to 2032 Figure 162: South Asia Value Share (%) and BPS Analysis by Product, 2022 to 2032 Figure 163: South Asia Y-o-Y Growth (%) Projections by Product, 2022 to 2032 Figure 164: South Asia Value (US$ million) Analysis by End User, 2017 to 2032 Figure 165: South Asia Volume (MT) Analysis by End User, 2017 to 2032 Figure 166: South Asia Value Share (%) and BPS Analysis by End User, 2022 to 2032 Figure 167: South Asia Y-o-Y Growth (%) Projections by End User, 2022 to 2032 Figure 168: South Asia Value (US$ million) Analysis by Nature, 2017 to 2032 Figure 169: South Asia Volume (MT) Analysis by Nature, 2017 to 2032 Figure 170: South Asia Value Share (%) and BPS Analysis by Nature, 2022 to 2032 Figure 171: South Asia Y-o-Y Growth (%) Projections by Nature, 2022 to 2032 Figure 172: South Asia Value (US$ million) Analysis by Sales Channel, 2017 to 2032 Figure 173: South Asia Volume (MT) Analysis by Sales Channel, 2017 to 2032 Figure 174: South Asia Value Share (%) and BPS Analysis by Sales Channel, 2022 to 2032 Figure 175: South Asia Y-o-Y Growth (%) Projections by Sales Channel, 2022 to 2032 Figure 176: South Asia Attractiveness by Product, 2022 to 2032 Figure 177: South Asia Attractiveness by End User, 2022 to 2032 Figure 178: South Asia Attractiveness by Nature, 2022 to 2032 Figure 179: South Asia Attractiveness by Sales Channel, 2022 to 2032 Figure 180: South Asia Attractiveness by Country, 2022 to 2032 Figure 181: Oceania Value (US$ million) by Product, 2022 to 2032 Figure 182: Oceania Value (US$ million) by End User, 2022 to 2032 Figure 183: Oceania Value (US$ million) by Nature, 2022 to 2032 Figure 184: Oceania Value (US$ million) by Sales Channel, 2022 to 2032 Figure 185: Oceania Value (US$ million) by Country, 2022 to 2032 Figure 186: Oceania Value (US$ million) Analysis by Country, 2017 to 2032 Figure 187: Oceania Volume (MT) Analysis by Country, 2017 to 2032 Figure 188: Oceania Value Share (%) and BPS Analysis by Country, 2022 to 2032 Figure 189: Oceania Y-o-Y Growth (%) Projections by Country, 2022 to 2032 Figure 190: Oceania Value (US$ million) Analysis by Product, 2017 to 2032 Figure 191: Oceania Volume (MT) Analysis by Product, 2017 to 2032 Figure 192: Oceania Value Share (%) and BPS Analysis by Product, 2022 to 2032 Figure 193: Oceania Y-o-Y Growth (%) Projections by Product, 2022 to 2032 Figure 194: Oceania Value (US$ million) Analysis by End User, 2017 to 2032 Figure 195: Oceania Volume (MT) Analysis by End User, 2017 to 2032 Figure 196: Oceania Value Share (%) and BPS Analysis by End User, 2022 to 2032 Figure 197: Oceania Y-o-Y Growth (%) Projections by End User, 2022 to 2032 Figure 198: Oceania Value (US$ million) Analysis by Nature, 2017 to 2032 Figure 199: Oceania Volume (MT) Analysis by Nature, 2017 to 2032 Figure 200: Oceania Value Share (%) and BPS Analysis by Nature, 2022 to 2032 Figure 201: Oceania Y-o-Y Growth (%) Projections by Nature, 2022 to 2032 Figure 202: Oceania Value (US$ million) Analysis by Sales Channel, 2017 to 2032 Figure 203: Oceania Volume (MT) Analysis by Sales Channel, 2017 to 2032 Figure 204: Oceania Value Share (%) and BPS Analysis by Sales Channel, 2022 to 2032 Figure 205: Oceania Y-o-Y Growth (%) Projections by Sales Channel, 2022 to 2032 Figure 206: Oceania Attractiveness by Product, 2022 to 2032 Figure 207: Oceania Attractiveness by End User, 2022 to 2032 Figure 208: Oceania Attractiveness by Nature, 2022 to 2032 Figure 209: Oceania Attractiveness by Sales Channel, 2022 to 2032 Figure 210: Oceania Attractiveness by Country, 2022 to 2032 Figure 211: MEA Value (US$ million) by Product, 2022 to 2032 Figure 212: MEA Value (US$ million) by End User, 2022 to 2032 Figure 213: MEA Value (US$ million) by Nature, 2022 to 2032 Figure 214: MEA Value (US$ million) by Sales Channel, 2022 to 2032 Figure 215: MEA Value (US$ million) by Country, 2022 to 2032 Figure 216: MEA Value (US$ million) Analysis by Country, 2017 to 2032 Figure 217: MEA Volume (MT) Analysis by Country, 2017 to 2032 Figure 218: MEA Value Share (%) and BPS Analysis by Country, 2022 to 2032 Figure 219: MEA Y-o-Y Growth (%) Projections by Country, 2022 to 2032 Figure 220: MEA Value (US$ million) Analysis by Product, 2017 to 2032 Figure 221: MEA Volume (MT) Analysis by Product, 2017 to 2032 Figure 222: MEA Value Share (%) and BPS Analysis by Product, 2022 to 2032 Figure 223: MEA Y-o-Y Growth (%) Projections by Product, 2022 to 2032 Figure 224: MEA Value (US$ million) Analysis by End User, 2017 to 2032 Figure 225: MEA Volume (MT) Analysis by End User, 2017 to 2032 Figure 226: MEA Value Share (%) and BPS Analysis by End User, 2022 to 2032 Figure 227: MEA Y-o-Y Growth (%) Projections by End User, 2022 to 2032 Figure 228: MEA Value (US$ million) Analysis by Nature, 2017 to 2032 Figure 229: MEA Volume (MT) Analysis by Nature, 2017 to 2032 Figure 230: MEA Value Share (%) and BPS Analysis by Nature, 2022 to 2032 Figure 231: MEA Y-o-Y Growth (%) Projections by Nature, 2022 to 2032 Figure 232: MEA Value (US$ million) Analysis by Sales Channel, 2017 to 2032 Figure 233: MEA Volume (MT) Analysis by Sales Channel, 2017 to 2032 Figure 234: MEA Value Share (%) and BPS Analysis by Sales Channel, 2022 to 2032 Figure 235: MEA Y-o-Y Growth (%) Projections by Sales Channel, 2022 to 2032 Figure 236: MEA Attractiveness by Product, 2022 to 2032 Figure 237: MEA Attractiveness by End User, 2022 to 2032 Figure 238: MEA Attractiveness by Nature, 2022 to 2032 Figure 239: MEA Attractiveness by Sales Channel, 2022 to 2032 Figure 240: MEA Attractiveness by Country, 2022 to 2032
Need specific information?
Request CustomizationExplore Food and Beverage Insights
View Reports