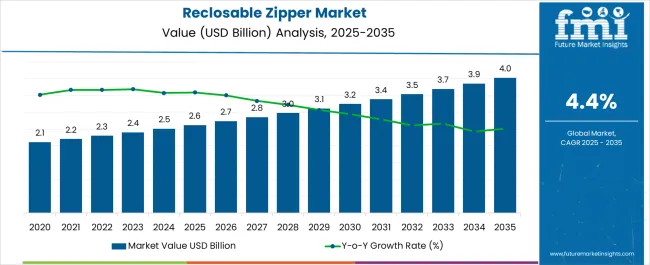
The reclosable zipper market is expected to be valued at USD 2.5 billion in 2024. For 2023, the value of the market was marked at USD 2.4 billion. The market is expected to progress at a modest rate over the period from 2024 to 2034, with a CAGR of 4.6%. By the end of the forecast period, the value of the reclosable zipper market is slated to have inflated to USD 3.9 billion.
Attributes | Details |
---|---|
Reclosable Zipper Market Value for 2024 | USD 2.5 billion |
Projected Market Value for 2034 | USD 3.9 billion |
Value-based CAGR of Market for 2024 to 2034 | 4.6% |
The reclosable zipper industry was tipped to have a value of USD 2.2 billion in 2019. The market likely progressed at a sluggish CAGR of 2.1% over the historical period from 2019 to 2023.
The market was heavily affected by the shutdown of various industrial operations during the pandemic. However, demand from the food & beverage and pharmaceutical industries for sustainable packaging started lifting the reclosable zipper market. By the end of the historical period in 2023, the market value had reached USD 2.4 billion.
Market Valuation (2019) | USD 2.2 billion |
---|---|
Historical CAGR (2019 to 2023) | 2.1% |
Market Valuation (2023) | USD 2.4 billion |
Long-term Analysis of Reclosable Zipper Market from 2024 to 2034
For 2024, the valuation for a reclosable zipper is estimated to be USD 2.5 billion. The growth of the market is predicted to elevate at a modest pace of 4.6% over the forecast period.
The expansion of industries like food & beverage and pharmaceuticals is conducive to the growth of the reclosable zipper market. Moreover, manufacturers are developing flexible packaging reclosable zippers with additional features to make them easy to use.
Consumers favor packaging that can be used again and again. Reusable packaging not only increases the convenience of consumers but also affords consumers savings on packaging material. Reusability is one of the key features of reclosable zippers. As such, the popularity of reclosable zippers is expected to soar over the forecast period. By the end of the forecast period, the value of the market is expected to reach USD 3.9 billion.
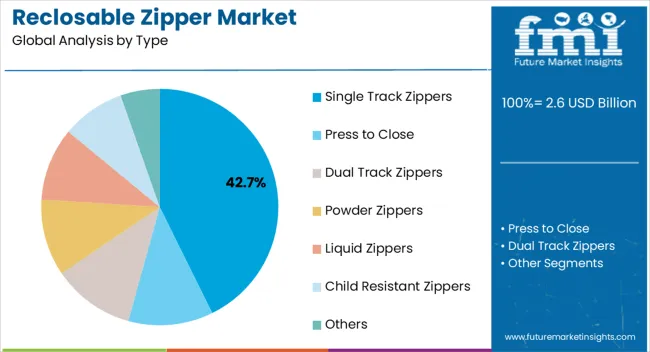
Press-to-close zippers are the standard type of closures in reclosable zipper packaging. For 2024, the market share by closure type of press-to-close zipper is pegged at a dominant 71.2%.
Press-to-close zippers provide a no-frills type of closing system for packaging. In addition, the optimal product production and its east-to-close design make them more affordable for consumers. For instance, LPS Industries launched Top-Loc Zipper with anti-static features for food & snacks, veterinary medicine, and OTC health & beauty.
Attributes | Details |
---|---|
Top Closure Type | Press-to-close |
Market Share in 2024 | 71.2% |
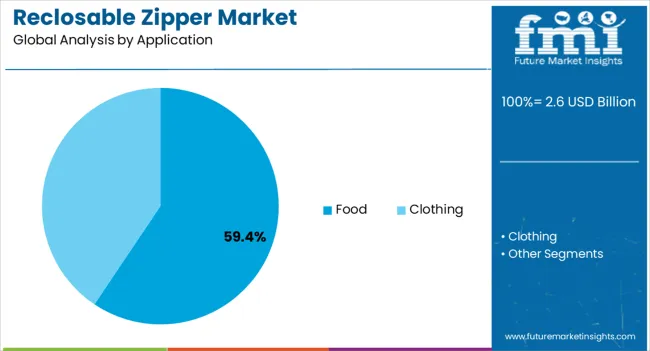
Food is the sector where reclosable zippers find numerous applications. For 2024, food is anticipated to hold 61.4% of the market share by end-use category.
The burgeoning food industry is in constant need of packaging that preserves them from contamination. In addition, the growing sale of food online is also creating an increased need for secure packaging. Reclosable zippers are increasingly used in candy and other sweets, beverages, and even pet food packaging.
Attributes | Details |
---|---|
Top Application | Food |
Market Share in 2024 | 61.4% |
The expanding food and packaging industry in the Asia Pacific, with the propensity to eat food at home, increasing urbanization, and growing population, is propelling the market in the region.
Countries | CAGR (2024 to 2034) |
---|---|
United Kingdom | 4.7% |
Australia | 4.2% |
Japan | 3.7% |
India | 6.2% |
China | 5.3% |
India is estimated to be one of the leading countries in the market over the forecast period, with a CAGR of 6.2%.
With the rising population, the food demand in India is significant. As a result, the food production in the country is rising, creating the need for large amounts of packaging.
For the forecast period, the CAGR in China is pegged to be an encouraging 5.3%. The online segment is helping the expansion of the packaging industry in China with its one-stop service. As a result, e-commerce is the key to market growth for easy access to a variety of reclosable zipper packaging.
Japan is another Asian country that holds opportunity for the market. For the forecast period, the CAGR for Japan is anticipated to be a steady 3.7%.
Manufacturers of reclosable zipper packaging products are getting creative with the design of the product. Various colors and tie-ins are used in the likes of bags and pouches. Thus, the market is being driven in Japan.
Sustainable practices are quickly becoming the norm in Australia. The recycled polyester trend is prevalent in packaging in the country to reduce greenhouse gas emissions. Moreover, paper over plastic packaging material for easy degradation is presenting key opportunities in the country. Thus, Australian consumers are leaning toward sustainable packaging closures. The CAGR for Australia over the forecast period is predicted to be a calm 4.2%.
The United Kingdom is one of the most promising countries in Europe for the market. For the 2024 to 2034 period, the CAGR for the United Kingdom is projected to be a respectable 4.7%.
Flexible packaging is a primary concern among suppliers in the United Kingdom. Consumers are also partial to the convenience provided by reclosable zippers. Thus, easy-to-handle reclosable zippers are gaining popularity in the United Kingdom.
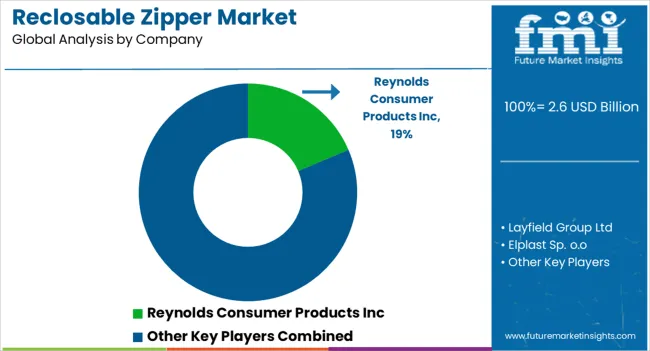
The reclosable zipper market needs to be more cohesive. Several multinational players exist, but small-scale local companies have plenty of room to grow.
Innovation is considered key by market players. In addition to innovative products, like ones made with recyclable material, innovative designs for ease of use are also given importance by market players.
Recent Developments in the Reclosable Zipper Market
Table 1: Global Market Value (US$ Million) Forecast by Region, 2019 to 2034
Table 2: Global Market Volume (Units) Forecast by Region, 2019 to 2034
Table 3: Global Market Value (US$ Million) Forecast by Type, 2019 to 2034
Table 4: Global Market Volume (Units) Forecast by Type, 2019 to 2034
Table 5: Global Market Value (US$ Million) Forecast by Application, 2019 to 2034
Table 6: Global Market Volume (Units) Forecast by Application, 2019 to 2034
Table 7: North America Market Value (US$ Million) Forecast by Country, 2019 to 2034
Table 8: North America Market Volume (Units) Forecast by Country, 2019 to 2034
Table 9: North America Market Value (US$ Million) Forecast by Type, 2019 to 2034
Table 10: North America Market Volume (Units) Forecast by Type, 2019 to 2034
Table 11: North America Market Value (US$ Million) Forecast by Application, 2019 to 2034
Table 12: North America Market Volume (Units) Forecast by Application, 2019 to 2034
Table 13: Latin America Market Value (US$ Million) Forecast by Country, 2019 to 2034
Table 14: Latin America Market Volume (Units) Forecast by Country, 2019 to 2034
Table 15: Latin America Market Value (US$ Million) Forecast by Type, 2019 to 2034
Table 16: Latin America Market Volume (Units) Forecast by Type, 2019 to 2034
Table 17: Latin America Market Value (US$ Million) Forecast by Application, 2019 to 2034
Table 18: Latin America Market Volume (Units) Forecast by Application, 2019 to 2034
Table 19: Europe Market Value (US$ Million) Forecast by Country, 2019 to 2034
Table 20: Europe Market Volume (Units) Forecast by Country, 2019 to 2034
Table 21: Europe Market Value (US$ Million) Forecast by Type, 2019 to 2034
Table 22: Europe Market Volume (Units) Forecast by Type, 2019 to 2034
Table 23: Europe Market Value (US$ Million) Forecast by Application, 2019 to 2034
Table 24: Europe Market Volume (Units) Forecast by Application, 2019 to 2034
Table 25: East Asia Market Value (US$ Million) Forecast by Country, 2019 to 2034
Table 26: East Asia Market Volume (Units) Forecast by Country, 2019 to 2034
Table 27: East Asia Market Value (US$ Million) Forecast by Type, 2019 to 2034
Table 28: East Asia Market Volume (Units) Forecast by Type, 2019 to 2034
Table 29: East Asia Market Value (US$ Million) Forecast by Application, 2019 to 2034
Table 30: East Asia Market Volume (Units) Forecast by Application, 2019 to 2034
Table 31: South Asia Market Value (US$ Million) Forecast by Country, 2019 to 2034
Table 32: South Asia Market Volume (Units) Forecast by Country, 2019 to 2034
Table 33: South Asia Market Value (US$ Million) Forecast by Type, 2019 to 2034
Table 34: South Asia Market Volume (Units) Forecast by Type, 2019 to 2034
Table 35: South Asia Market Value (US$ Million) Forecast by Application, 2019 to 2034
Table 36: South Asia Market Volume (Units) Forecast by Application, 2019 to 2034
Table 37: Oceania Market Value (US$ Million) Forecast by Country, 2019 to 2034
Table 38: Oceania Market Volume (Units) Forecast by Country, 2019 to 2034
Table 39: Oceania Market Value (US$ Million) Forecast by Type, 2019 to 2034
Table 40: Oceania Market Volume (Units) Forecast by Type, 2019 to 2034
Table 41: Oceania Market Value (US$ Million) Forecast by Application, 2019 to 2034
Table 42: Oceania Market Volume (Units) Forecast by Application, 2019 to 2034
Table 43: MEA Market Value (US$ Million) Forecast by Country, 2019 to 2034
Table 44: MEA Market Volume (Units) Forecast by Country, 2019 to 2034
Table 45: MEA Market Value (US$ Million) Forecast by Type, 2019 to 2034
Table 46: MEA Market Volume (Units) Forecast by Type, 2019 to 2034
Table 47: MEA Market Value (US$ Million) Forecast by Application, 2019 to 2034
Table 48: MEA Market Volume (Units) Forecast by Application, 2019 to 2034
Figure 1: Global Market Value (US$ Million) by Type, 2024 to 2034
Figure 2: Global Market Value (US$ Million) by Application, 2024 to 2034
Figure 3: Global Market Value (US$ Million) by Region, 2024 to 2034
Figure 4: Global Market Value (US$ Million) Analysis by Region, 2019 to 2034
Figure 5: Global Market Volume (Units) Analysis by Region, 2019 to 2034
Figure 6: Global Market Value Share (%) and BPS Analysis by Region, 2024 to 2034
Figure 7: Global Market Y-o-Y Growth (%) Projections by Region, 2024 to 2034
Figure 8: Global Market Value (US$ Million) Analysis by Type, 2019 to 2034
Figure 9: Global Market Volume (Units) Analysis by Type, 2019 to 2034
Figure 10: Global Market Value Share (%) and BPS Analysis by Type, 2024 to 2034
Figure 11: Global Market Y-o-Y Growth (%) Projections by Type, 2024 to 2034
Figure 12: Global Market Value (US$ Million) Analysis by Application, 2019 to 2034
Figure 13: Global Market Volume (Units) Analysis by Application, 2019 to 2034
Figure 14: Global Market Value Share (%) and BPS Analysis by Application, 2024 to 2034
Figure 15: Global Market Y-o-Y Growth (%) Projections by Application, 2024 to 2034
Figure 16: Global Market Attractiveness by Type, 2024 to 2034
Figure 17: Global Market Attractiveness by Application, 2024 to 2034
Figure 18: Global Market Attractiveness by Region, 2024 to 2034
Figure 19: North America Market Value (US$ Million) by Type, 2024 to 2034
Figure 20: North America Market Value (US$ Million) by Application, 2024 to 2034
Figure 21: North America Market Value (US$ Million) by Country, 2024 to 2034
Figure 22: North America Market Value (US$ Million) Analysis by Country, 2019 to 2034
Figure 23: North America Market Volume (Units) Analysis by Country, 2019 to 2034
Figure 24: North America Market Value Share (%) and BPS Analysis by Country, 2024 to 2034
Figure 25: North America Market Y-o-Y Growth (%) Projections by Country, 2024 to 2034
Figure 26: North America Market Value (US$ Million) Analysis by Type, 2019 to 2034
Figure 27: North America Market Volume (Units) Analysis by Type, 2019 to 2034
Figure 28: North America Market Value Share (%) and BPS Analysis by Type, 2024 to 2034
Figure 29: North America Market Y-o-Y Growth (%) Projections by Type, 2024 to 2034
Figure 30: North America Market Value (US$ Million) Analysis by Application, 2019 to 2034
Figure 31: North America Market Volume (Units) Analysis by Application, 2019 to 2034
Figure 32: North America Market Value Share (%) and BPS Analysis by Application, 2024 to 2034
Figure 33: North America Market Y-o-Y Growth (%) Projections by Application, 2024 to 2034
Figure 34: North America Market Attractiveness by Type, 2024 to 2034
Figure 35: North America Market Attractiveness by Application, 2024 to 2034
Figure 36: North America Market Attractiveness by Country, 2024 to 2034
Figure 37: Latin America Market Value (US$ Million) by Type, 2024 to 2034
Figure 38: Latin America Market Value (US$ Million) by Application, 2024 to 2034
Figure 39: Latin America Market Value (US$ Million) by Country, 2024 to 2034
Figure 40: Latin America Market Value (US$ Million) Analysis by Country, 2019 to 2034
Figure 41: Latin America Market Volume (Units) Analysis by Country, 2019 to 2034
Figure 42: Latin America Market Value Share (%) and BPS Analysis by Country, 2024 to 2034
Figure 43: Latin America Market Y-o-Y Growth (%) Projections by Country, 2024 to 2034
Figure 44: Latin America Market Value (US$ Million) Analysis by Type, 2019 to 2034
Figure 45: Latin America Market Volume (Units) Analysis by Type, 2019 to 2034
Figure 46: Latin America Market Value Share (%) and BPS Analysis by Type, 2024 to 2034
Figure 47: Latin America Market Y-o-Y Growth (%) Projections by Type, 2024 to 2034
Figure 48: Latin America Market Value (US$ Million) Analysis by Application, 2019 to 2034
Figure 49: Latin America Market Volume (Units) Analysis by Application, 2019 to 2034
Figure 50: Latin America Market Value Share (%) and BPS Analysis by Application, 2024 to 2034
Figure 51: Latin America Market Y-o-Y Growth (%) Projections by Application, 2024 to 2034
Figure 52: Latin America Market Attractiveness by Type, 2024 to 2034
Figure 53: Latin America Market Attractiveness by Application, 2024 to 2034
Figure 54: Latin America Market Attractiveness by Country, 2024 to 2034
Figure 55: Europe Market Value (US$ Million) by Type, 2024 to 2034
Figure 56: Europe Market Value (US$ Million) by Application, 2024 to 2034
Figure 57: Europe Market Value (US$ Million) by Country, 2024 to 2034
Figure 58: Europe Market Value (US$ Million) Analysis by Country, 2019 to 2034
Figure 59: Europe Market Volume (Units) Analysis by Country, 2019 to 2034
Figure 60: Europe Market Value Share (%) and BPS Analysis by Country, 2024 to 2034
Figure 61: Europe Market Y-o-Y Growth (%) Projections by Country, 2024 to 2034
Figure 62: Europe Market Value (US$ Million) Analysis by Type, 2019 to 2034
Figure 63: Europe Market Volume (Units) Analysis by Type, 2019 to 2034
Figure 64: Europe Market Value Share (%) and BPS Analysis by Type, 2024 to 2034
Figure 65: Europe Market Y-o-Y Growth (%) Projections by Type, 2024 to 2034
Figure 66: Europe Market Value (US$ Million) Analysis by Application, 2019 to 2034
Figure 67: Europe Market Volume (Units) Analysis by Application, 2019 to 2034
Figure 68: Europe Market Value Share (%) and BPS Analysis by Application, 2024 to 2034
Figure 69: Europe Market Y-o-Y Growth (%) Projections by Application, 2024 to 2034
Figure 70: Europe Market Attractiveness by Type, 2024 to 2034
Figure 71: Europe Market Attractiveness by Application, 2024 to 2034
Figure 72: Europe Market Attractiveness by Country, 2024 to 2034
Figure 73: East Asia Market Value (US$ Million) by Type, 2024 to 2034
Figure 74: East Asia Market Value (US$ Million) by Application, 2024 to 2034
Figure 75: East Asia Market Value (US$ Million) by Country, 2024 to 2034
Figure 76: East Asia Market Value (US$ Million) Analysis by Country, 2019 to 2034
Figure 77: East Asia Market Volume (Units) Analysis by Country, 2019 to 2034
Figure 78: East Asia Market Value Share (%) and BPS Analysis by Country, 2024 to 2034
Figure 79: East Asia Market Y-o-Y Growth (%) Projections by Country, 2024 to 2034
Figure 80: East Asia Market Value (US$ Million) Analysis by Type, 2019 to 2034
Figure 81: East Asia Market Volume (Units) Analysis by Type, 2019 to 2034
Figure 82: East Asia Market Value Share (%) and BPS Analysis by Type, 2024 to 2034
Figure 83: East Asia Market Y-o-Y Growth (%) Projections by Type, 2024 to 2034
Figure 84: East Asia Market Value (US$ Million) Analysis by Application, 2019 to 2034
Figure 85: East Asia Market Volume (Units) Analysis by Application, 2019 to 2034
Figure 86: East Asia Market Value Share (%) and BPS Analysis by Application, 2024 to 2034
Figure 87: East Asia Market Y-o-Y Growth (%) Projections by Application, 2024 to 2034
Figure 88: East Asia Market Attractiveness by Type, 2024 to 2034
Figure 89: East Asia Market Attractiveness by Application, 2024 to 2034
Figure 90: East Asia Market Attractiveness by Country, 2024 to 2034
Figure 91: South Asia Market Value (US$ Million) by Type, 2024 to 2034
Figure 92: South Asia Market Value (US$ Million) by Application, 2024 to 2034
Figure 93: South Asia Market Value (US$ Million) by Country, 2024 to 2034
Figure 94: South Asia Market Value (US$ Million) Analysis by Country, 2019 to 2034
Figure 95: South Asia Market Volume (Units) Analysis by Country, 2019 to 2034
Figure 96: South Asia Market Value Share (%) and BPS Analysis by Country, 2024 to 2034
Figure 97: South Asia Market Y-o-Y Growth (%) Projections by Country, 2024 to 2034
Figure 98: South Asia Market Value (US$ Million) Analysis by Type, 2019 to 2034
Figure 99: South Asia Market Volume (Units) Analysis by Type, 2019 to 2034
Figure 100: South Asia Market Value Share (%) and BPS Analysis by Type, 2024 to 2034
Figure 101: South Asia Market Y-o-Y Growth (%) Projections by Type, 2024 to 2034
Figure 102: South Asia Market Value (US$ Million) Analysis by Application, 2019 to 2034
Figure 103: South Asia Market Volume (Units) Analysis by Application, 2019 to 2034
Figure 104: South Asia Market Value Share (%) and BPS Analysis by Application, 2024 to 2034
Figure 105: South Asia Market Y-o-Y Growth (%) Projections by Application, 2024 to 2034
Figure 106: South Asia Market Attractiveness by Type, 2024 to 2034
Figure 107: South Asia Market Attractiveness by Application, 2024 to 2034
Figure 108: South Asia Market Attractiveness by Country, 2024 to 2034
Figure 109: Oceania Market Value (US$ Million) by Type, 2024 to 2034
Figure 110: Oceania Market Value (US$ Million) by Application, 2024 to 2034
Figure 111: Oceania Market Value (US$ Million) by Country, 2024 to 2034
Figure 112: Oceania Market Value (US$ Million) Analysis by Country, 2019 to 2034
Figure 113: Oceania Market Volume (Units) Analysis by Country, 2019 to 2034
Figure 114: Oceania Market Value Share (%) and BPS Analysis by Country, 2024 to 2034
Figure 115: Oceania Market Y-o-Y Growth (%) Projections by Country, 2024 to 2034
Figure 116: Oceania Market Value (US$ Million) Analysis by Type, 2019 to 2034
Figure 117: Oceania Market Volume (Units) Analysis by Type, 2019 to 2034
Figure 118: Oceania Market Value Share (%) and BPS Analysis by Type, 2024 to 2034
Figure 119: Oceania Market Y-o-Y Growth (%) Projections by Type, 2024 to 2034
Figure 120: Oceania Market Value (US$ Million) Analysis by Application, 2019 to 2034
Figure 121: Oceania Market Volume (Units) Analysis by Application, 2019 to 2034
Figure 122: Oceania Market Value Share (%) and BPS Analysis by Application, 2024 to 2034
Figure 123: Oceania Market Y-o-Y Growth (%) Projections by Application, 2024 to 2034
Figure 124: Oceania Market Attractiveness by Type, 2024 to 2034
Figure 125: Oceania Market Attractiveness by Application, 2024 to 2034
Figure 126: Oceania Market Attractiveness by Country, 2024 to 2034
Figure 127: MEA Market Value (US$ Million) by Type, 2024 to 2034
Figure 128: MEA Market Value (US$ Million) by Application, 2024 to 2034
Figure 129: MEA Market Value (US$ Million) by Country, 2024 to 2034
Figure 130: MEA Market Value (US$ Million) Analysis by Country, 2019 to 2034
Figure 131: MEA Market Volume (Units) Analysis by Country, 2019 to 2034
Figure 132: MEA Market Value Share (%) and BPS Analysis by Country, 2024 to 2034
Figure 133: MEA Market Y-o-Y Growth (%) Projections by Country, 2024 to 2034
Figure 134: MEA Market Value (US$ Million) Analysis by Type, 2019 to 2034
Figure 135: MEA Market Volume (Units) Analysis by Type, 2019 to 2034
Figure 136: MEA Market Value Share (%) and BPS Analysis by Type, 2024 to 2034
Figure 137: MEA Market Y-o-Y Growth (%) Projections by Type, 2024 to 2034
Figure 138: MEA Market Value (US$ Million) Analysis by Application, 2019 to 2034
Figure 139: MEA Market Volume (Units) Analysis by Application, 2019 to 2034
Figure 140: MEA Market Value Share (%) and BPS Analysis by Application, 2024 to 2034
Figure 141: MEA Market Y-o-Y Growth (%) Projections by Application, 2024 to 2034
Figure 142: MEA Market Attractiveness by Type, 2024 to 2034
Figure 143: MEA Market Attractiveness by Application, 2024 to 2034
Figure 144: MEA Market Attractiveness by Country, 2024 to 2034
The size of the reclosable zipper market is estimated to be USD 2.5 billion in 2024.
The CAGR of the reclosable zipper market is predicted at a sturdy 4.6% from 2024 to 2034.
The reclosable zipper market is expected to reach a valuation of USD 3.9 billion by 2034.
Based on closure type, press-to-close is the leading segment in the reclosable zipper market.
Child-resistant zippers and reclosable zippers made from sustainable material are two of the trends in the market.
Explore Similar Insights
Thank you!
You will receive an email from our Business Development Manager. Please be sure to check your SPAM/JUNK folder too.