Sailplane Market Size and Share Forecast Outlook 2025 to 2035

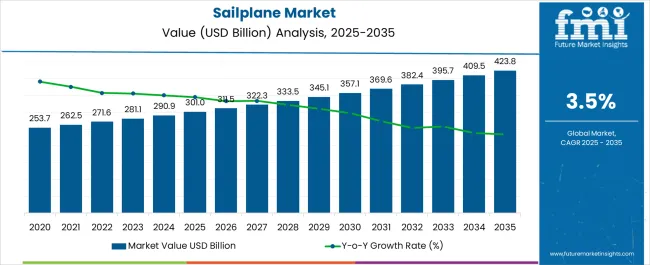
The Sailplane Market is estimated to be valued at USD 301.0 billion in 2025 and is projected to reach USD 423.8 billion by 2035, registering a compound annual growth rate (CAGR) of 3.5% over the forecast period.
Quick Stats for Sailplane Market

  • Sailplane Market Value (2025): USD 301.0 billion
  • Sailplane Market Forecast Value (2035): USD 423.8 billion
  • Sailplane Market Forecast CAGR: 3.5%
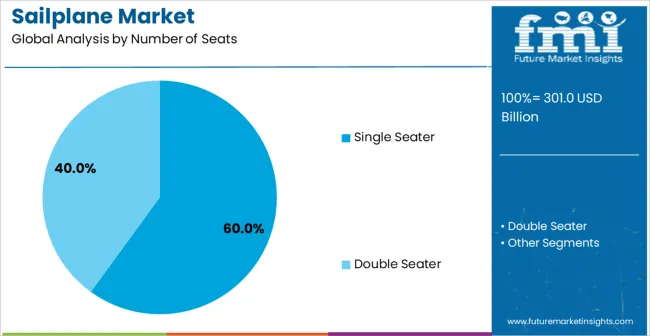
  • Leading Segment in Sailplane Market in 2025: Single Seater (60.0%)
  • Key Growth Regions in Sailplane Market: North America, Asia-Pacific, Europe
  • Top Key Players in Sailplane Market: Schempp-Hirth Flugzeugbau GmbH, Alexander Schleicher GmbH & Co., DG Flugzeugbau GmbH, Jonker Sailplanes (Pty) Ltd, Pipistrel d.o.o. Ajdovščina, Lange Aviation GmbH, Stemme AG, LZ Design

Sailplane Market Market Value Analysis

Sailplane Market Key Takeaways

Metric Value
Sailplane Market Estimated Value in (2025 E) USD 301.0 billion
Sailplane Market Forecast Value in (2035 F) USD 423.8 billion
Forecast CAGR (2025 to 2035) 3.5%

Why is the Sailplane Market Growing?

The Sailplane market is experiencing notable growth driven by rising interest in recreational aviation and the increasing popularity of sports and leisure flying activities. The future outlook for this market is shaped by the growing emphasis on sustainable aviation technologies and the adoption of electric-powered propulsion systems. Increasing investments in pilot training programs, flying clubs, and leisure aviation infrastructure are supporting market expansion.

The shift toward environmentally friendly and noise-reduced aircraft is encouraging the use of electric-powered sailplanes, which offer both operational efficiency and reduced ecological impact. Additionally, the growing participation in gliding competitions and adventure sports has elevated the demand for high-performance sailplanes.

Technological innovations in lightweight materials and aerodynamics are further enhancing flight efficiency and safety, making sailplanes more attractive to both amateur and professional pilots As recreational aviation becomes more accessible and government regulations support sport flying, the Sailplane market is anticipated to witness steady growth, with opportunities emerging in both mature and emerging regions.

Segmental Analysis

The sailplane market is segmented by number of seats, power source, end use, and geographic regions. By number of seats, sailplane market is divided into Single Seater and Double Seater. In terms of power source, sailplane market is classified into Electric Powered and Gasoline Powered. Based on end use, sailplane market is segmented into Sports & Leisure Activity and Military. Regionally, the sailplane industry is classified into North America, Latin America, Western Europe, Eastern Europe, Balkan & Baltic Countries, Russia & Belarus, Central Asia, East Asia, South Asia & Pacific, and the Middle East & Africa.
Insights into the Single Seater Segment

Sailplane Market Analysis By Number Of Seats

The single-seater segment is projected to hold 60.0% of the Sailplane market revenue share in 2025, establishing it as the leading configuration. The growth of this segment has been influenced by the preference for individual flying experiences in sports and leisure activities, which allow pilots to gain greater control and personal satisfaction.

Single-seater sailplanes are favored for training, competition, and recreational purposes due to their lighter weight, enhanced maneuverability, and ease of handling. The design flexibility of single-seater aircraft supports the integration of advanced cockpit instruments and aerodynamics features, improving performance and safety.

Moreover, single-seater sailplanes are more cost-effective in terms of maintenance and operational expenses, which encourages adoption among private pilots and flying clubs The segment’s prominence is further reinforced by the growing demand for personalized aviation experiences and competitive gliding sports, which continue to drive sales and market share growth.
Insights into the Electric-Powered Segment

Sailplane Market Analysis By Power Source

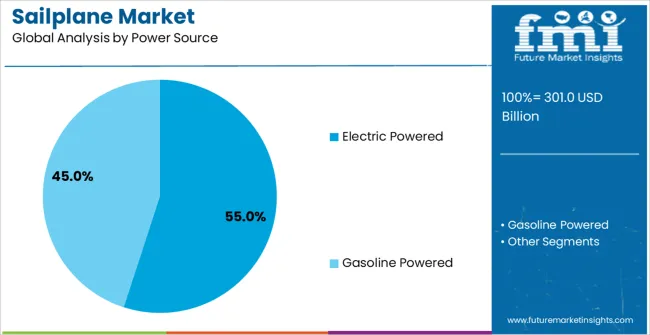
The electric-powered segment is expected to capture 55.0% of the Sailplane market revenue share in 2025, making it the leading power source type. The adoption of electric propulsion has been driven by the growing focus on environmental sustainability and the reduction of carbon emissions in aviation. Electric-powered sailplanes offer quieter operation, lower maintenance requirements, and improved energy efficiency compared to traditional combustion engines.

These benefits have made them increasingly preferred in sports, leisure, and training applications. Additionally, technological advancements in battery capacity and motor efficiency have enhanced flight duration and reliability, supporting wider acceptance of electric-powered models.

The rising regulatory emphasis on clean energy adoption and the promotion of green aviation initiatives are further contributing to the growth of this segment As pilots and clubs prioritize sustainable and cost-effective flying options, the electric-powered sailplane segment is expected to maintain its leading position in the market.
Insights into the Sports & Leisure Activity Segment

Sailplane Market Analysis By End Use

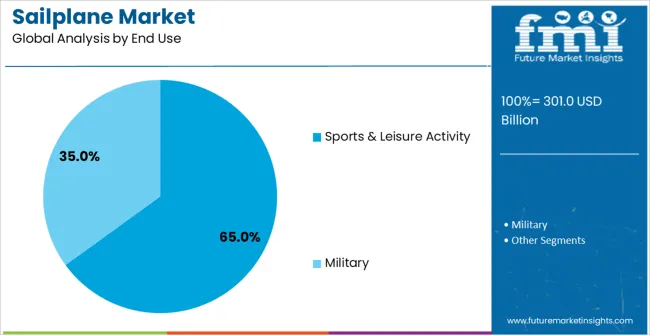
The sports and leisure activity segment is anticipated to account for 65.0% of the Sailplane market revenue in 2025, positioning it as the dominant end-use industry. This growth is driven by increasing recreational interest in gliding, adventure tourism, and competitive flying events. Sailplanes offer unique experiences that combine skill development, thrill, and environmental consciousness, which has amplified their popularity among enthusiasts.

The ability to engage in individual or group flying activities with minimal environmental impact has made sailplanes attractive for both private owners and aviation clubs. The segment’s growth is further supported by the expansion of leisure aviation infrastructure, such as gliding centers, flight schools, and sporting associations, which facilitate accessibility and training opportunities.

Additionally, the development of electric-powered and high-performance sailplanes has enhanced safety and flight efficiency, increasing adoption within sports and leisure applications As the demand for recreational aviation continues to rise, the sports and leisure activity segment is expected to remain the primary driver of the Sailplane market.

Market Overview

Sailplane Market: Introduction

A sailplane is a type of a glider aircraft generally used in the sports and leisure activity. The sports of flying sailplane is referred to as soaring. Sailplane is an aerodynamically designed aircraft developed with a high lift-to-drag ratio.

According to the Federal Aviation Administration, sailplane is defined as a heavier-than-air fixed-wing aircraft which is supported by the dynamic reaction of the air against its lifting surfaces during flight, and is not principally dependent on an engine.

A sailplane is designed to fly and gain altitude from the natural force such as thermal and ridge lift. Sailplanes are also equipped with engines to sustain and enable the level flight in area of descending air flow. The overall performance of the sailplane primarily depends on the various design parameters such as aerodynamic efficiency, flight mechanics, material used, aircraft structure, etc.

Sailplanes are generally made from made of lightweight high strength materials such as carbon fiber or glass fiber. Sailplanes are predominantly used in the sports and leisure activity and military applications. In military sailplane are used train cadets the fundamentals of flights.

Further, the advancement in computational methods and development of modern aerodynamic concept are some of the key factors aiding sailplane manufacturers to improve overall performance and increasing the lift to drag ratio.
Analysis of Sailplane Market By Key Countries

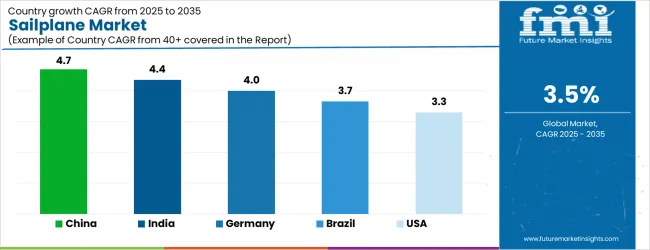
Sailplane Market Cagr Analysis By Country

Country CAGR
China 4.7%
India 4.4%
Germany 4.0%
Brazil 3.7%
USA 3.3%
UK 3.0%
Japan 2.6%

Country-wise Analysis

The Sailplane Market is expected to register a CAGR of 3.5% during the forecast period, exhibiting varied country level momentum. China leads with the highest CAGR of 4.7%, followed by India at 4.4%. Developed markets such as Germany, France, and the UK continue to expand steadily, while the USA is likely to grow at consistent rates. Japan posts the lowest CAGR at 2.6%, yet still underscores a broadly positive trajectory for the global Sailplane Market. In 2024, Germany held a dominant revenue in the Western Europe market and is expected to grow with a CAGR of 4.0%. The USA Sailplane Market is estimated to be valued at USD 108.2 billion in 2025 and is anticipated to reach a valuation of USD 108.2 billion by 2035. Sales are projected to rise at a CAGR of 0.0% over the forecast period between 2025 and 2035. While Japan and South Korea markets are estimated to be valued at USD 14.7 billion and USD 7.7 billion respectively in 2025.
Key Players in the Sailplane Market

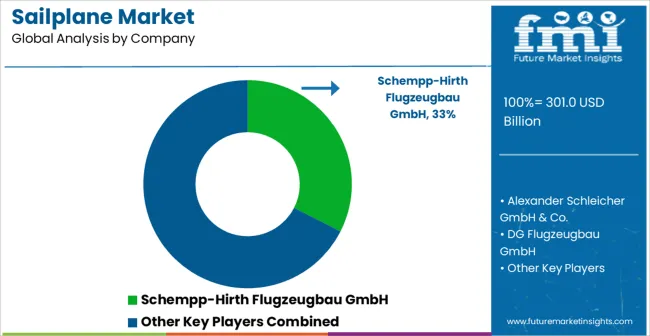
Sailplane Market Analysis By Company

  • Schempp-Hirth Flugzeugbau GmbH
  • Alexander Schleicher GmbH & Co.
  • DG Flugzeugbau GmbH
  • Jonker Sailplanes (Pty) Ltd
  • Pipistrel d.o.o. Ajdovščina
  • Lange Aviation GmbH
  • Stemme AG
  • LZ Design

Scope of the Report

Item Value
Quantitative Units USD 301.0 Billion
Number of Seats Single Seater and Double Seater
Power Source Electric Powered and Gasoline Powered
End Use Sports & Leisure Activity and Military
Regions Covered North America, Europe, Asia-Pacific, Latin America, Middle East & Africa
Country Covered United States, Canada, Germany, France, United Kingdom, China, Japan, India, Brazil, South Africa
Key Companies Profiled Schempp-Hirth Flugzeugbau GmbH, Alexander Schleicher GmbH & Co., DG Flugzeugbau GmbH, Jonker Sailplanes (Pty) Ltd, Pipistrel d.o.o. Ajdovščina, Lange Aviation GmbH, Stemme AG, and LZ Design

Sailplane Market by Segments

Number of Seats:

  • Single Seater
  • Double Seater

Power Source:

  • Electric Powered
  • Gasoline Powered

End Use:

  • Sports & Leisure Activity
  • Military

Region:

  • North America
    • USA
    • Canada
    • Mexico
  • Latin America
    • Brazil
    • Chile
    • Rest of Latin America
  • Western Europe
    • Germany
    • UK
    • Italy
    • Spain
    • France
    • Nordic
    • BENELUX
    • Rest of Western Europe
  • Eastern Europe
    • Russia
    • Poland
    • Hungary
    • Balkan & Baltic
    • Rest of Eastern Europe
  • East Asia
    • China
    • Japan
    • South Korea
  • South Asia and Pacific
    • India
    • ASEAN
    • Australia & New Zealand
    • Rest of South Asia and Pacific
  • Middle East & Africa
    • Kingdom of Saudi Arabia
    • Other GCC Countries
    • Turkiye
    • South Africa
    • Other African Union
    • Rest of Middle East & Africa

Frequently Asked Questions

How big is the sailplane market in 2025?

The global sailplane market is estimated to be valued at USD 301.0 billion in 2025.

What will be the size of sailplane market in 2035?

The market size for the sailplane market is projected to reach USD 423.8 billion by 2035.

How much will be the sailplane market growth between 2025 and 2035?

The sailplane market is expected to grow at a 3.5% CAGR between 2025 and 2035.

What are the key product types in the sailplane market?

The key product types in sailplane market are single seater and double seater.

Which power source segment to contribute significant share in the sailplane market in 2025?

In terms of power source, electric powered segment to command 55.0% share in the sailplane market in 2025.

Table of Content

  1. Executive Summary
    • Global Market Outlook
    • Demand-side Trends
    • Supply-side Trends
    • Technology Roadmap Analysis
    • Analysis and Recommendations
  2. Market Overview
    • Market Coverage / Taxonomy
    • Market Definition / Scope / Limitations
  3. Market Background
    • Market Dynamics
      • Drivers
      • Restraints
      • Opportunity
      • Trends
    • Scenario Forecast
      • Demand in Optimistic Scenario
      • Demand in Likely Scenario
      • Demand in Conservative Scenario
    • Opportunity Map Analysis
    • Product Life Cycle Analysis
    • Supply Chain Analysis
    • Investment Feasibility Matrix
    • Value Chain Analysis
    • PESTLE and Porter’s Analysis
    • Regulatory Landscape
    • Regional Parent Market Outlook
    • Production and Consumption Statistics
    • Import and Export Statistics
  4. Global Market Analysis 2020 to 2024 and Forecast, 2025 to 2035
    • Historical Market Size Value (USD Million) Analysis, 2020 to 2024
    • Current and Future Market Size Value (USD Million) Projections, 2025 to 2035
      • Y-o-Y Growth Trend Analysis
      • Absolute $ Opportunity Analysis
  5. Global Market Pricing Analysis 2020 to 2024 and Forecast 2025 to 2035
  6. Global Market Analysis 2020 to 2024 and Forecast 2025 to 2035, By Number of Seats
    • Introduction / Key Findings
    • Historical Market Size Value (USD Million) Analysis By Number of Seats , 2020 to 2024
    • Current and Future Market Size Value (USD Million) Analysis and Forecast By Number of Seats , 2025 to 2035
      • Single Seater
      • Double Seater
    • Y-o-Y Growth Trend Analysis By Number of Seats , 2020 to 2024
    • Absolute $ Opportunity Analysis By Number of Seats , 2025 to 2035
  7. Global Market Analysis 2020 to 2024 and Forecast 2025 to 2035, By Power Source
    • Introduction / Key Findings
    • Historical Market Size Value (USD Million) Analysis By Power Source, 2020 to 2024
    • Current and Future Market Size Value (USD Million) Analysis and Forecast By Power Source, 2025 to 2035
      • Electric Powered
      • Gasoline Powered
    • Y-o-Y Growth Trend Analysis By Power Source, 2020 to 2024
    • Absolute $ Opportunity Analysis By Power Source, 2025 to 2035
  8. Global Market Analysis 2020 to 2024 and Forecast 2025 to 2035, By End Use
    • Introduction / Key Findings
    • Historical Market Size Value (USD Million) Analysis By End Use, 2020 to 2024
    • Current and Future Market Size Value (USD Million) Analysis and Forecast By End Use, 2025 to 2035
      • Sports & Leisure Activity
      • Military
    • Y-o-Y Growth Trend Analysis By End Use, 2020 to 2024
    • Absolute $ Opportunity Analysis By End Use, 2025 to 2035
  9. Global Market Analysis 2020 to 2024 and Forecast 2025 to 2035, By Region
    • Introduction
    • Historical Market Size Value (USD Million) Analysis By Region, 2020 to 2024
    • Current Market Size Value (USD Million) Analysis and Forecast By Region, 2025 to 2035
      • North America
      • Latin America
      • Western Europe
      • Eastern Europe
      • East Asia
      • South Asia and Pacific
      • Middle East & Africa
    • Market Attractiveness Analysis By Region
  10. North America Market Analysis 2020 to 2024 and Forecast 2025 to 2035, By Country
    • Historical Market Size Value (USD Million) Trend Analysis By Market Taxonomy, 2020 to 2024
    • Market Size Value (USD Million) Forecast By Market Taxonomy, 2025 to 2035
      • By Country
        • USA
        • Canada
        • Mexico
      • By Number of Seats
      • By Power Source
      • By End Use
    • Market Attractiveness Analysis
      • By Country
      • By Number of Seats
      • By Power Source
      • By End Use
    • Key Takeaways
  11. Latin America Market Analysis 2020 to 2024 and Forecast 2025 to 2035, By Country
    • Historical Market Size Value (USD Million) Trend Analysis By Market Taxonomy, 2020 to 2024
    • Market Size Value (USD Million) Forecast By Market Taxonomy, 2025 to 2035
      • By Country
        • Brazil
        • Chile
        • Rest of Latin America
      • By Number of Seats
      • By Power Source
      • By End Use
    • Market Attractiveness Analysis
      • By Country
      • By Number of Seats
      • By Power Source
      • By End Use
    • Key Takeaways
  12. Western Europe Market Analysis 2020 to 2024 and Forecast 2025 to 2035, By Country
    • Historical Market Size Value (USD Million) Trend Analysis By Market Taxonomy, 2020 to 2024
    • Market Size Value (USD Million) Forecast By Market Taxonomy, 2025 to 2035
      • By Country
        • Germany
        • UK
        • Italy
        • Spain
        • France
        • Nordic
        • BENELUX
        • Rest of Western Europe
      • By Number of Seats
      • By Power Source
      • By End Use
    • Market Attractiveness Analysis
      • By Country
      • By Number of Seats
      • By Power Source
      • By End Use
    • Key Takeaways
  13. Eastern Europe Market Analysis 2020 to 2024 and Forecast 2025 to 2035, By Country
    • Historical Market Size Value (USD Million) Trend Analysis By Market Taxonomy, 2020 to 2024
    • Market Size Value (USD Million) Forecast By Market Taxonomy, 2025 to 2035
      • By Country
        • Russia
        • Poland
        • Hungary
        • Balkan & Baltic
        • Rest of Eastern Europe
      • By Number of Seats
      • By Power Source
      • By End Use
    • Market Attractiveness Analysis
      • By Country
      • By Number of Seats
      • By Power Source
      • By End Use
    • Key Takeaways
  14. East Asia Market Analysis 2020 to 2024 and Forecast 2025 to 2035, By Country
    • Historical Market Size Value (USD Million) Trend Analysis By Market Taxonomy, 2020 to 2024
    • Market Size Value (USD Million) Forecast By Market Taxonomy, 2025 to 2035
      • By Country
        • China
        • Japan
        • South Korea
      • By Number of Seats
      • By Power Source
      • By End Use
    • Market Attractiveness Analysis
      • By Country
      • By Number of Seats
      • By Power Source
      • By End Use
    • Key Takeaways
  15. South Asia and Pacific Market Analysis 2020 to 2024 and Forecast 2025 to 2035, By Country
    • Historical Market Size Value (USD Million) Trend Analysis By Market Taxonomy, 2020 to 2024
    • Market Size Value (USD Million) Forecast By Market Taxonomy, 2025 to 2035
      • By Country
        • India
        • ASEAN
        • Australia & New Zealand
        • Rest of South Asia and Pacific
      • By Number of Seats
      • By Power Source
      • By End Use
    • Market Attractiveness Analysis
      • By Country
      • By Number of Seats
      • By Power Source
      • By End Use
    • Key Takeaways
  16. Middle East & Africa Market Analysis 2020 to 2024 and Forecast 2025 to 2035, By Country
    • Historical Market Size Value (USD Million) Trend Analysis By Market Taxonomy, 2020 to 2024
    • Market Size Value (USD Million) Forecast By Market Taxonomy, 2025 to 2035
      • By Country
        • Kingdom of Saudi Arabia
        • Other GCC Countries
        • Turkiye
        • South Africa
        • Other African Union
        • Rest of Middle East & Africa
      • By Number of Seats
      • By Power Source
      • By End Use
    • Market Attractiveness Analysis
      • By Country
      • By Number of Seats
      • By Power Source
      • By End Use
    • Key Takeaways
  17. Key Countries Market Analysis
    • USA
      • Pricing Analysis
      • Market Share Analysis, 2024
        • By Number of Seats
        • By Power Source
        • By End Use
    • Canada
      • Pricing Analysis
      • Market Share Analysis, 2024
        • By Number of Seats
        • By Power Source
        • By End Use
    • Mexico
      • Pricing Analysis
      • Market Share Analysis, 2024
        • By Number of Seats
        • By Power Source
        • By End Use
    • Brazil
      • Pricing Analysis
      • Market Share Analysis, 2024
        • By Number of Seats
        • By Power Source
        • By End Use
    • Chile
      • Pricing Analysis
      • Market Share Analysis, 2024
        • By Number of Seats
        • By Power Source
        • By End Use
    • Germany
      • Pricing Analysis
      • Market Share Analysis, 2024
        • By Number of Seats
        • By Power Source
        • By End Use
    • UK
      • Pricing Analysis
      • Market Share Analysis, 2024
        • By Number of Seats
        • By Power Source
        • By End Use
    • Italy
      • Pricing Analysis
      • Market Share Analysis, 2024
        • By Number of Seats
        • By Power Source
        • By End Use
    • Spain
      • Pricing Analysis
      • Market Share Analysis, 2024
        • By Number of Seats
        • By Power Source
        • By End Use
    • France
      • Pricing Analysis
      • Market Share Analysis, 2024
        • By Number of Seats
        • By Power Source
        • By End Use
    • India
      • Pricing Analysis
      • Market Share Analysis, 2024
        • By Number of Seats
        • By Power Source
        • By End Use
    • ASEAN
      • Pricing Analysis
      • Market Share Analysis, 2024
        • By Number of Seats
        • By Power Source
        • By End Use
    • Australia & New Zealand
      • Pricing Analysis
      • Market Share Analysis, 2024
        • By Number of Seats
        • By Power Source
        • By End Use
    • China
      • Pricing Analysis
      • Market Share Analysis, 2024
        • By Number of Seats
        • By Power Source
        • By End Use
    • Japan
      • Pricing Analysis
      • Market Share Analysis, 2024
        • By Number of Seats
        • By Power Source
        • By End Use
    • South Korea
      • Pricing Analysis
      • Market Share Analysis, 2024
        • By Number of Seats
        • By Power Source
        • By End Use
    • Russia
      • Pricing Analysis
      • Market Share Analysis, 2024
        • By Number of Seats
        • By Power Source
        • By End Use
    • Poland
      • Pricing Analysis
      • Market Share Analysis, 2024
        • By Number of Seats
        • By Power Source
        • By End Use
    • Hungary
      • Pricing Analysis
      • Market Share Analysis, 2024
        • By Number of Seats
        • By Power Source
        • By End Use
    • Kingdom of Saudi Arabia
      • Pricing Analysis
      • Market Share Analysis, 2024
        • By Number of Seats
        • By Power Source
        • By End Use
    • Turkiye
      • Pricing Analysis
      • Market Share Analysis, 2024
        • By Number of Seats
        • By Power Source
        • By End Use
    • South Africa
      • Pricing Analysis
      • Market Share Analysis, 2024
        • By Number of Seats
        • By Power Source
        • By End Use
  18. Market Structure Analysis
    • Competition Dashboard
    • Competition Benchmarking
    • Market Share Analysis of Top Players
      • By Regional
      • By Number of Seats
      • By Power Source
      • By End Use
  19. Competition Analysis
    • Competition Deep Dive
      • Schempp-Hirth Flugzeugbau GmbH
        • Overview
        • Product Portfolio
        • Profitability by Market Segments (Product/Age /Sales Channel/Region)
        • Sales Footprint
        • Strategy Overview
          • Marketing Strategy
          • Product Strategy
          • Channel Strategy
      • Alexander Schleicher GmbH & Co.
      • DG Flugzeugbau GmbH
      • Jonker s (Pty) Ltd
      • Pipistrel d.o.o. Ajdovščina
      • Lange Aviation GmbH
      • Stemme AG
      • LZ Design
  20. Assumptions & Acronyms Used
  21. Research Methodology

List of Tables

  • Table 1: Global Market Value (USD Million) Forecast by Region, 2020 to 2035
  • Table 2: Global Market Value (USD Million) Forecast by Number of Seats , 2020 to 2035
  • Table 3: Global Market Value (USD Million) Forecast by Power Source, 2020 to 2035
  • Table 4: Global Market Value (USD Million) Forecast by End Use, 2020 to 2035
  • Table 5: North America Market Value (USD Million) Forecast by Country, 2020 to 2035
  • Table 6: North America Market Value (USD Million) Forecast by Number of Seats , 2020 to 2035
  • Table 7: North America Market Value (USD Million) Forecast by Power Source, 2020 to 2035
  • Table 8: North America Market Value (USD Million) Forecast by End Use, 2020 to 2035
  • Table 9: Latin America Market Value (USD Million) Forecast by Country, 2020 to 2035
  • Table 10: Latin America Market Value (USD Million) Forecast by Number of Seats , 2020 to 2035
  • Table 11: Latin America Market Value (USD Million) Forecast by Power Source, 2020 to 2035
  • Table 12: Latin America Market Value (USD Million) Forecast by End Use, 2020 to 2035
  • Table 13: Western Europe Market Value (USD Million) Forecast by Country, 2020 to 2035
  • Table 14: Western Europe Market Value (USD Million) Forecast by Number of Seats , 2020 to 2035
  • Table 15: Western Europe Market Value (USD Million) Forecast by Power Source, 2020 to 2035
  • Table 16: Western Europe Market Value (USD Million) Forecast by End Use, 2020 to 2035
  • Table 17: Eastern Europe Market Value (USD Million) Forecast by Country, 2020 to 2035
  • Table 18: Eastern Europe Market Value (USD Million) Forecast by Number of Seats , 2020 to 2035
  • Table 19: Eastern Europe Market Value (USD Million) Forecast by Power Source, 2020 to 2035
  • Table 20: Eastern Europe Market Value (USD Million) Forecast by End Use, 2020 to 2035
  • Table 21: East Asia Market Value (USD Million) Forecast by Country, 2020 to 2035
  • Table 22: East Asia Market Value (USD Million) Forecast by Number of Seats , 2020 to 2035
  • Table 23: East Asia Market Value (USD Million) Forecast by Power Source, 2020 to 2035
  • Table 24: East Asia Market Value (USD Million) Forecast by End Use, 2020 to 2035
  • Table 25: South Asia and Pacific Market Value (USD Million) Forecast by Country, 2020 to 2035
  • Table 26: South Asia and Pacific Market Value (USD Million) Forecast by Number of Seats , 2020 to 2035
  • Table 27: South Asia and Pacific Market Value (USD Million) Forecast by Power Source, 2020 to 2035
  • Table 28: South Asia and Pacific Market Value (USD Million) Forecast by End Use, 2020 to 2035
  • Table 29: Middle East & Africa Market Value (USD Million) Forecast by Country, 2020 to 2035
  • Table 30: Middle East & Africa Market Value (USD Million) Forecast by Number of Seats , 2020 to 2035
  • Table 31: Middle East & Africa Market Value (USD Million) Forecast by Power Source, 2020 to 2035
  • Table 32: Middle East & Africa Market Value (USD Million) Forecast by End Use, 2020 to 2035

List of Figures

  • Figure 1: Global Market Pricing Analysis
  • Figure 2: Global Market Value (USD Million) Forecast 2020-2035
  • Figure 3: Global Market Value Share and BPS Analysis by Number of Seats , 2025 and 2035
  • Figure 4: Global Market Y-o-Y Growth Comparison by Number of Seats , 2025-2035
  • Figure 5: Global Market Attractiveness Analysis by Number of Seats
  • Figure 6: Global Market Value Share and BPS Analysis by Power Source, 2025 and 2035
  • Figure 7: Global Market Y-o-Y Growth Comparison by Power Source, 2025-2035
  • Figure 8: Global Market Attractiveness Analysis by Power Source
  • Figure 9: Global Market Value Share and BPS Analysis by End Use, 2025 and 2035
  • Figure 10: Global Market Y-o-Y Growth Comparison by End Use, 2025-2035
  • Figure 11: Global Market Attractiveness Analysis by End Use
  • Figure 12: Global Market Value (USD Million) Share and BPS Analysis by Region, 2025 and 2035
  • Figure 13: Global Market Y-o-Y Growth Comparison by Region, 2025-2035
  • Figure 14: Global Market Attractiveness Analysis by Region
  • Figure 15: North America Market Incremental Dollar Opportunity, 2025-2035
  • Figure 16: Latin America Market Incremental Dollar Opportunity, 2025-2035
  • Figure 17: Western Europe Market Incremental Dollar Opportunity, 2025-2035
  • Figure 18: Eastern Europe Market Incremental Dollar Opportunity, 2025-2035
  • Figure 19: East Asia Market Incremental Dollar Opportunity, 2025-2035
  • Figure 20: South Asia and Pacific Market Incremental Dollar Opportunity, 2025-2035
  • Figure 21: Middle East & Africa Market Incremental Dollar Opportunity, 2025-2035
  • Figure 22: North America Market Value Share and BPS Analysis by Country, 2025 and 2035
  • Figure 23: North America Market Value Share and BPS Analysis by Number of Seats , 2025 and 2035
  • Figure 24: North America Market Y-o-Y Growth Comparison by Number of Seats , 2025-2035
  • Figure 25: North America Market Attractiveness Analysis by Number of Seats
  • Figure 26: North America Market Value Share and BPS Analysis by Power Source, 2025 and 2035
  • Figure 27: North America Market Y-o-Y Growth Comparison by Power Source, 2025-2035
  • Figure 28: North America Market Attractiveness Analysis by Power Source
  • Figure 29: North America Market Value Share and BPS Analysis by End Use, 2025 and 2035
  • Figure 30: North America Market Y-o-Y Growth Comparison by End Use, 2025-2035
  • Figure 31: North America Market Attractiveness Analysis by End Use
  • Figure 32: Latin America Market Value Share and BPS Analysis by Country, 2025 and 2035
  • Figure 33: Latin America Market Value Share and BPS Analysis by Number of Seats , 2025 and 2035
  • Figure 34: Latin America Market Y-o-Y Growth Comparison by Number of Seats , 2025-2035
  • Figure 35: Latin America Market Attractiveness Analysis by Number of Seats
  • Figure 36: Latin America Market Value Share and BPS Analysis by Power Source, 2025 and 2035
  • Figure 37: Latin America Market Y-o-Y Growth Comparison by Power Source, 2025-2035
  • Figure 38: Latin America Market Attractiveness Analysis by Power Source
  • Figure 39: Latin America Market Value Share and BPS Analysis by End Use, 2025 and 2035
  • Figure 40: Latin America Market Y-o-Y Growth Comparison by End Use, 2025-2035
  • Figure 41: Latin America Market Attractiveness Analysis by End Use
  • Figure 42: Western Europe Market Value Share and BPS Analysis by Country, 2025 and 2035
  • Figure 43: Western Europe Market Value Share and BPS Analysis by Number of Seats , 2025 and 2035
  • Figure 44: Western Europe Market Y-o-Y Growth Comparison by Number of Seats , 2025-2035
  • Figure 45: Western Europe Market Attractiveness Analysis by Number of Seats
  • Figure 46: Western Europe Market Value Share and BPS Analysis by Power Source, 2025 and 2035
  • Figure 47: Western Europe Market Y-o-Y Growth Comparison by Power Source, 2025-2035
  • Figure 48: Western Europe Market Attractiveness Analysis by Power Source
  • Figure 49: Western Europe Market Value Share and BPS Analysis by End Use, 2025 and 2035
  • Figure 50: Western Europe Market Y-o-Y Growth Comparison by End Use, 2025-2035
  • Figure 51: Western Europe Market Attractiveness Analysis by End Use
  • Figure 52: Eastern Europe Market Value Share and BPS Analysis by Country, 2025 and 2035
  • Figure 53: Eastern Europe Market Value Share and BPS Analysis by Number of Seats , 2025 and 2035
  • Figure 54: Eastern Europe Market Y-o-Y Growth Comparison by Number of Seats , 2025-2035
  • Figure 55: Eastern Europe Market Attractiveness Analysis by Number of Seats
  • Figure 56: Eastern Europe Market Value Share and BPS Analysis by Power Source, 2025 and 2035
  • Figure 57: Eastern Europe Market Y-o-Y Growth Comparison by Power Source, 2025-2035
  • Figure 58: Eastern Europe Market Attractiveness Analysis by Power Source
  • Figure 59: Eastern Europe Market Value Share and BPS Analysis by End Use, 2025 and 2035
  • Figure 60: Eastern Europe Market Y-o-Y Growth Comparison by End Use, 2025-2035
  • Figure 61: Eastern Europe Market Attractiveness Analysis by End Use
  • Figure 62: East Asia Market Value Share and BPS Analysis by Country, 2025 and 2035
  • Figure 63: East Asia Market Value Share and BPS Analysis by Number of Seats , 2025 and 2035
  • Figure 64: East Asia Market Y-o-Y Growth Comparison by Number of Seats , 2025-2035
  • Figure 65: East Asia Market Attractiveness Analysis by Number of Seats
  • Figure 66: East Asia Market Value Share and BPS Analysis by Power Source, 2025 and 2035
  • Figure 67: East Asia Market Y-o-Y Growth Comparison by Power Source, 2025-2035
  • Figure 68: East Asia Market Attractiveness Analysis by Power Source
  • Figure 69: East Asia Market Value Share and BPS Analysis by End Use, 2025 and 2035
  • Figure 70: East Asia Market Y-o-Y Growth Comparison by End Use, 2025-2035
  • Figure 71: East Asia Market Attractiveness Analysis by End Use
  • Figure 72: South Asia and Pacific Market Value Share and BPS Analysis by Country, 2025 and 2035
  • Figure 73: South Asia and Pacific Market Value Share and BPS Analysis by Number of Seats , 2025 and 2035
  • Figure 74: South Asia and Pacific Market Y-o-Y Growth Comparison by Number of Seats , 2025-2035
  • Figure 75: South Asia and Pacific Market Attractiveness Analysis by Number of Seats
  • Figure 76: South Asia and Pacific Market Value Share and BPS Analysis by Power Source, 2025 and 2035
  • Figure 77: South Asia and Pacific Market Y-o-Y Growth Comparison by Power Source, 2025-2035
  • Figure 78: South Asia and Pacific Market Attractiveness Analysis by Power Source
  • Figure 79: South Asia and Pacific Market Value Share and BPS Analysis by End Use, 2025 and 2035
  • Figure 80: South Asia and Pacific Market Y-o-Y Growth Comparison by End Use, 2025-2035
  • Figure 81: South Asia and Pacific Market Attractiveness Analysis by End Use
  • Figure 82: Middle East & Africa Market Value Share and BPS Analysis by Country, 2025 and 2035
  • Figure 83: Middle East & Africa Market Value Share and BPS Analysis by Number of Seats , 2025 and 2035
  • Figure 84: Middle East & Africa Market Y-o-Y Growth Comparison by Number of Seats , 2025-2035
  • Figure 85: Middle East & Africa Market Attractiveness Analysis by Number of Seats
  • Figure 86: Middle East & Africa Market Value Share and BPS Analysis by Power Source, 2025 and 2035
  • Figure 87: Middle East & Africa Market Y-o-Y Growth Comparison by Power Source, 2025-2035
  • Figure 88: Middle East & Africa Market Attractiveness Analysis by Power Source
  • Figure 89: Middle East & Africa Market Value Share and BPS Analysis by End Use, 2025 and 2035
  • Figure 90: Middle East & Africa Market Y-o-Y Growth Comparison by End Use, 2025-2035
  • Figure 91: Middle East & Africa Market Attractiveness Analysis by End Use
  • Figure 92: Global Market - Tier Structure Analysis
  • Figure 93: Global Market - Company Share Analysis
Dashboard
Dashboard
Dashboard
Dashboard
Dashboard
Dashboard

Full Research Suite comprises of:

Market outlook & trends analysis

Market outlook & trends analysis

Interviews & case studies

Interviews & case studies

Strategic recommendations

Strategic recommendations

Vendor profiles & capabilities analysis

Vendor profiles & capabilities analysis

5-year forecasts

5-year forecasts

8 regions and 60+ country-level data splits

8 regions and 60+ country-level data splits

Market segment data splits

Market segment data splits

12 months of continuous data updates

12 months of continuous data updates

DELIVERED AS:

PDF EXCEL ONLINE

Full Research Suite


$5000

$7500

$10000

Buy Report Now
Future Market Insights

Sailplane Market

Chat With MaRIA

Chat With

MaRIA

Hi There, I am MaRIA, Your Market Research Intelligence Assistant. How may I help you?