
- Market Size (2026)
- USD 87.3 Mn
- Forecast (2036)
- USD 115.1 Mn
- CAGR (2026 to 2036)
- 2.8%
How big is Salatrim Market in 2026?
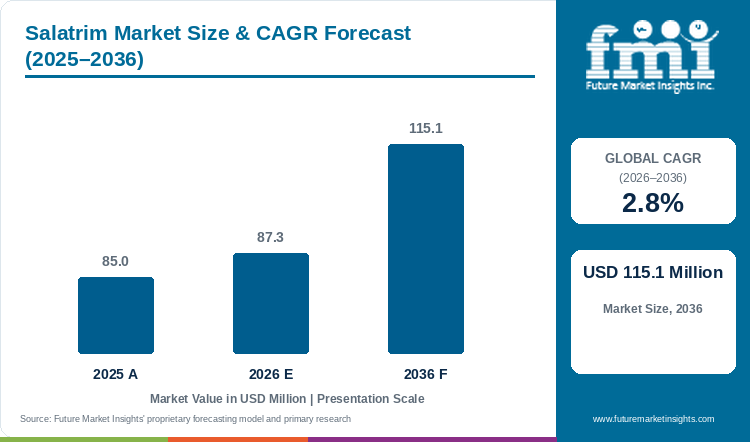
The salatrim market demonstrated steady progress from USD 85.0 million in 2025 to USD 87.3 million in 2026, building toward a targeted valuation of USD 115.1 million by 2036 at a CAGR of 2.8%.
The global salatrim market was valued at USD 85.0 million in 2025 and is estimated to reach USD 87.3 million in 2026. The market is projected to reach USD 115.1 million by 2036, expanding at a compound annual growth rate (CAGR) of 2.8% between 2026 and 2036. FMI market tracking confirms that short-chain acyl acetate propionate butyrate with long-chain stearate blends hold an estimated 64.5% share of 2026 demand because combining stearic acid with short-chain acids lowers metabolizable energy to 5 kilocalories per gram. Demand for salatrim is driven by confectionery and bakery brands trying to keep chocolate bars and snacks below mandatory front-of-pack calorie warning limits while cutting reliance on expensive cocoa butter. That regulatory calorie-reduction focus separates the market from filling fats formulations at 5.3% CAGR, where standard palm-kernel fats scale across everyday biscuits without low-calorie claims. To help snack makers manage high cocoa costs, Cargill Incorporated won a 2026 Edison Gold Award in April 2026 for its NextCoa cocoa-free confectionery fat alternative. Chocolate manufacturers sign annual salatrim contracts when structured fats match the crisp snap of cocoa butter without tempering, though digestive tolerance warnings above 30 grams per day limit use to solid snacks through 2036.
Key Market Trends & Insights
- By acyl triglyceride architecture: Short-Chain Acyl Acetate Propionate Butyrate with Long-Chain Stearate Blends hold 64.5% share in 2026 because asymmetric C2-C4 and C18 esterification delivers 44% calorie reduction.
- By physical consistency: Semi-Solid Plastic Vegetable Fat represents 58.7% in 2026 as plasticized blocks feed directly into jacketed confectionery enrobers.
- By functional performance: Reduced-Calorie Fat Replacer 5 kcal per g vs 9 kcal per g secures 62.5% in 2026 under statutory nutrition labeling recognition.
- By food application: Low-Calorie Chocolate and Confectionery Coatings account for 49.6% in 2026 because compound chocolate bars require sharp ambient snap.
- By sales channel: Direct to Industrial Confectionery and Bakery Accounts commands 61.2% in 2026 through custom solid-fat-index curve matching.
Regional Highlights
- Top national expansion: Brazil leads national growth projections at a 3.5% CAGR through 2036 under ANVISA front-of-pack high-saturated-fat and calorie warning regulations.
- Broader country progression: Mexico tracks at a 3.2% CAGR ahead of Spain at 2.8% and the United States at 2.7%. The United Kingdom advances at a 2.6% CAGR while Canada progresses at a 2.4% CAGR.
Market Size & Forecast
Table 1: Market Size and Forecast for the Salatrim Market (USD million and CAGR percentage), 2025 to 2036
| Metric | Value |
|---|---|
| 2025 Market Size | USD 85.0 million |
| Estimated Market Size in 2026 | USD 87.3 million |
| Projected Market Size by 2036 | USD 115.1 million |
| CAGR, 2026 to 2036 | 2.8% |
| Added Value, 2026 to 2036 | USD 27.8 million |
Chocolate bar makers and industrial bakeries face a tough commercial trade-off when rising cocoa butter prices and strict supermarket calorie caps squeeze product margins. When food brands simply remove fat to cut calories, chocolate coatings lose their smooth melt and cookies turn dry and brittle. Because the human digestive tract only partially absorbs stearic acid bound to short-chain acids, salatrim gives confectionery recipes full fat richness at 5 kilocalories per gram instead of 9. Findings from a July 2026 lipid formulation study in Food Chemistry X confirm that matching the clean 32 to 35 degrees Celsius melt of cocoa butter requires balanced stearic acid structuring. Confectionery R&D teams therefore blend salatrim with normal and specialty fats to keep snack bars under retail calorie ceilings while protecting creamy mouthfeel.
Structured Lipid Tonnage and Calorie-Reduction Sizing
Table 2: Structured Lipid Tonnage and Calorie-Reduction Sizing for the Salatrim Market (USD million and operational ranges), 2025 to 2036
| Metric | 2025 | 2026 | 2036 |
|---|---|---|---|
| Market size (USD million) | 85.0 | 87.3 | 115.1 |
| Finished low-calorie confectionery & bakery output (thousand metric tons) | 165.0 to 186.0 | 169.5 to 191.0 | 218.0 to 245.0 |
| Commercial salatrim structured lipid volume (thousand metric tons) | 22.4 to 25.2 | 23.0 to 25.8 | 29.5 to 33.2 |
| Average realized lipid price per metric ton (USD) | 3,370 to 3,795 | 3,380 to 3,800 | 3,465 to 3,900 |
Operational note: Commercial confectionery and bakery inclusion rates range from 8% to 22% of finished product weight to replace 35% to 100% of conventional cocoa butter or shortening.
Industrial chocolate coaters also adopt structured low-calorie fats to simplify factory processing and prevent white fat bloom on bars stored in warm retail aisles. Traditional cocoa butter requires slow, multi-stage temperature tempering so chocolate sets with a glossy finish and crisp snap. In August 2026, food scientists publishing in Food Chemistry showed that blending soybean-derived structured fats with plant stearins produced heat-stable dark chocolate that resisted surface bloom. By switching to non-tempering salatrim grades with commercial fat replacers, snack bar plants speed up cooling-tunnel throughput and reduce energy use on high-volume enrobing lines.
Per Capita & Confectionery Enrobing Line Sizing
Table 3: Per Capita and Confectionery Line Indicators for the Salatrim Market (USD), 2025 to 2036
| Metric | 2025 | 2026 | 2036 |
|---|---|---|---|
| World population (billion) | 8.2 | 8.3 | 9.0 |
| Market value per 1,000 people (USD) | 10.4 | 10.5 | 12.8 |
| Annual procurement per qualified confectionery & bakery line (USD thousand) | 68.5 to 77.0 | 70.0 to 78.8 | 89.5 to 101.0 |
| Enzymatically interesterified & cocoa-butter-replacer share (%) | 36.0% to 39.5% | 37.5% to 41.0% | 48.5% to 53.0% |
Table 4: Industrial Confectionery & Channel Indicators for the Salatrim Market (USD and percentages), 2026
| Metric | Value | Institutional Reference Basis |
|---|---|---|
| Market size, 2026 | USD 87.3 million | 2026 global valuation baseline |
| Qualified low-calorie enrobing & bakery lines global | 1,180 lines | Compound chocolate, nutrition bar & reduced-calorie bakery lines |
| Average line salatrim procurement | USD 73,983.1 | Annualized structured lipid raw material allocation |
| Direct to Industrial Accounts value, 2026 | USD 53.4 million | 61.2% direct sales channel allocation |
Consumer demand for portion-controlled protein bars, keto snacks, and reduced-calorie wafers is expanding orders for cocoa butter alternatives that lower both total calories and saturated fat. When nutrition bar brands replace sugar with maltitol or fiber, the fat coating becomes the main source of calories left in the recipe. In October 2026, researchers reporting in Food Chemistry demonstrated that replacing half of the cocoa butter in chocolate coatings with structured lipid networks cut saturated fat by over 20% while keeping firm bar snap. Procurement teams comparing cocoa butter ingredients against 5-kilocalorie-per-gram salatrim consequently lock in multi-ton supply agreements for dietetic and high-protein snack lines.
Analyst Perspective
"Confectionery and bakery buyers do not purchase salatrim just to print a low-fat claim, because their real goal is keeping chocolate-coated snacks below mandatory front-of-pack calorie warnings while saving on cocoa butter costs. Lipid refiners that deliver clean-tasting, non-tempering blocks tailored to existing factory enrobers will retain core industrial accounts through 2036."
- Nandini Roy Choudhury, Principal Consultant, Future Market Insights.
How is the salatrim market segmented?
The salatrim market is segmented by acyl triglyceride architecture, physical consistency, functional performance, food application, and sales channel. In 2026, Short-Chain Acyl Acetate Propionate Butyrate with Long-Chain Stearate Blends are projected at 64.5%, Semi-Solid Plastic Vegetable Fat at 58.7%, Reduced-Calorie Fat Replacer 5 kcal per g vs 9 kcal per g at 62.5%, Low-Calorie Chocolate and Confectionery Coatings at 49.6%, and Direct to Industrial Confectionery and Bakery Accounts at 61.2%.
By acyl triglyceride architecture: Short-Chain Acyl Acetate Propionate Butyrate with Long-Chain Stearate Blends and Propionate-Butyrate-Stearate Confectionery Triacylglycerols plus Acetate-Enriched Bakery Stearate Structured Lipids.
By physical consistency: Semi-Solid Plastic Vegetable Fat and Liquid Pourable Shortening Blend along with Flaked and Pelleted Confectionery Stearin.
By functional performance: Reduced-Calorie Fat Replacer 5 kcal per g vs 9 kcal per g and Drop-In Cocoa Butter Replacement in Confectionery plus Saturated-Fat-Reduced Texture Plasticizer.
By food application: Low-Calorie Chocolate and Confectionery Coatings and Dairy Dessert Fat Replacement along with Bakery Goods Pastries and Cookies Shortenings.
By sales channel: Direct to Industrial Confectionery and Bakery Accounts with Specialty Lipid and Food Ingredient Distributors and Online B2B Formulation Supply.
Why do Short-Chain Acyl Acetate Propionate Butyrate with Long-Chain Stearate Blends lead acyl triglyceride architecture?
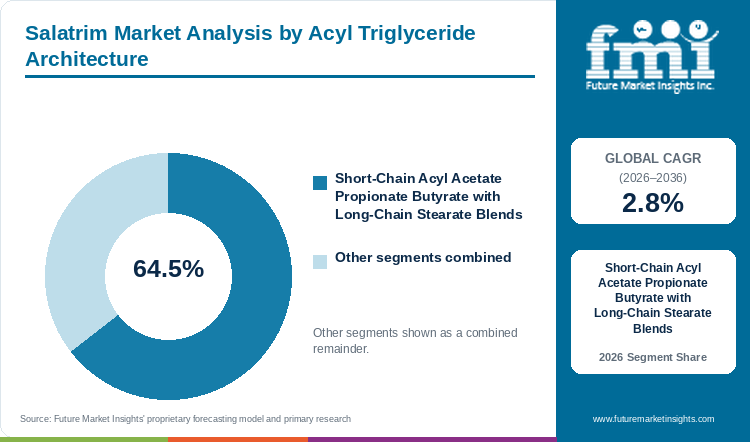
Short-Chain Acyl Acetate Propionate Butyrate with Long-Chain Stearate Blends hold an estimated 64.5% of acyl triglyceride architecture demand in 2026, anchored by sharp 32 to 35 degrees Celsius confectionery melting profiles.
Table 5: Acyl Triglyceride Architecture Share for the Salatrim Market (percentage share), 2026
| Acyl Triglyceride Architecture | Share (2026) |
|---|---|
| Short-Chain Acyl Acetate Propionate Butyrate with Long-Chain Stearate Blends | 64.5% |
| Other Segments Combined | 35.5%* |
| Total | 100.0% |
*Note: Reconciled from raw unnormalized 105.0% input via FMI bottom-up hierarchy validation so all architecture sub-segments sum to 100.0%.
Table 6: Acyl Triglyceride Architecture Leadership and Market Growth for the Salatrim Market (segment and CAGR percentage), 2026 to 2036
| Metric | Value |
|---|---|
| Global CAGR (2026 to 2036) | 2.8% |
| Leading Segment | Short-Chain Acyl Acetate Propionate Butyrate with Long-Chain Stearate Blends |
Confectionery formulators prefer blends that combine acetic, propionic, and butyric short-chain acids with vegetable stearin because this mix lets suppliers tune the exact melting point between 16 and 42 degrees Celsius. Unlike single-acid fats that feel waxy in the mouth, balanced multi-acid stearate blends melt cleanly on the tongue just like interesterified lipid blends in premium chocolate coatings and sandwich creams.
- Short-Chain Acyl Acetate Propionate Butyrate with Long-Chain Stearate Blends capture 64.5% of architecture demand in 2026 because multi-acid structuring replicates the sharp oral melt of cocoa butter.
- A March 2026 review in PubMed on structured lipids confirmed that enzymatic and chemical interesterification of short- and long-chain fatty acids provides tailored melting behavior and lower calorie density in commercial foods.
What sustains Semi-Solid Plastic Vegetable Fat leadership in physical consistency?
Semi-Solid Plastic Vegetable Fat represents 58.7% of the physical consistency category in 2026, supported by drop-in compatibility with jacketed enrobing and creaming mixers.
Semi-solid plastic fat blocks and heated liquid tank deliveries fit directly into standard chocolate enrobers and bakery mixers without forcing factories to buy new machinery. When formulators blend plastic salatrim grades with allanblackia confectionery stearins, coatings pump smoothly over biscuit centers and set quickly inside existing cooling tunnels.
- Semi-Solid Plastic Vegetable Fat represents 58.7% of physical consistency value in 2026 because industrial enrobing and creaming lines require workable solid fat plasticity at room temperature.
- In November 2025, confectionery researchers reporting in Food Chemistry showed that structured fat systems with 44.13% crystallinity matched pure cocoa butter hardness of 2,000 grams and prevented storage bloom.
How does Reduced-Calorie Fat Replacer 5 kcal per g vs 9 kcal per g lead functional performance?
Reduced-Calorie Fat Replacer 5 kcal per g vs 9 kcal per g accounts for 62.5% of functional performance demand in 2026, driven by statutory 44% caloric-factor discounts on nutrition labels.
Food labeling laws in the United States and Latin America allow snack makers to count salatrim at 5 kilocalories per gram on Nutrition Facts panels instead of the 9 kilocalories per gram assigned to standard fats. That legal 44% calorie discount helps chocolate and protein bar brands hit 100-calorie pack targets while testing cell-cultured cocoa butter for specialty lines.
- Reduced-Calorie Fat Replacer 5 kcal per g vs 9 kcal per g accounts for 62.5% of functional performance demand in 2026 because recognized nutrition-label calorie discounts directly lower front-of-pack numbers.
- In July 2025, lipid researchers publishing in PubMed demonstrated a two-step enzymatic process that attaches target fatty acids onto glycerol backbones with high conversion yield.
Why do Low-Calorie Chocolate and Confectionery Coatings lead food applications?
Low-Calorie Chocolate and Confectionery Coatings secure 49.6% of food application value in 2026, supported by non-tempering compound enrobing across nutrition bars and dietetic chocolates.
High-protein nutrition bars, sugar-free chocolate tablets, and dietetic wafers rely on chocolate-style outer coatings that make up nearly one-third of the bar's total weight. Substitution of cocoa butter with salatrim in these compound coatings trims total bar calories by 15% to 20% and removes the need for slow chocolate tempering.
- Low-Calorie Chocolate and Confectionery Coatings secure 49.6% of food application market value in 2026 because bar enrobing represents the largest commercial use of structured low-calorie fats.
- A January 2025 study in Food Chemistry examined structured triacylglycerols designed for cocoa butter replacement and confirmed that balanced stearate placement controls crisp chocolate meltdown.
What gives Direct to Industrial Confectionery and Bakery Accounts the leading position in sales channel?
Direct to Industrial Confectionery and Bakery Accounts commands 61.2% of sales channel share in 2026, anchored by custom solid-fat-content curve calibration and pilot enrobing trials.
Large chocolate, biscuit, and ice cream manufacturers require custom melting-curve tests on their exact sugar and cocoa recipes before approving a fat replacer for high-speed factory lines. Specialty lipid suppliers therefore work directly with industrial bakery and confectionery R&D teams in pilot plants prior to signing annual bulk supply contracts.
- Direct to Industrial Confectionery and Bakery Accounts commands 61.2% of sales channel demand in 2026 because custom factory cooling-tunnel speed requires direct pilot-line qualification.
- In July 2025, Palsgaard A/S opened a new bakery and confectionery application center in Navi Mumbai, India to run direct customer chocolate coating and emulsifier trials.
What are the drivers, restraints, and opportunities in the salatrim market?
In the salatrim market, mandatory front-of-pack calorie warning laws and elevated cocoa butter prices are projected to drive adoption whereas daily gastrointestinal intake thresholds and European Novel Food limits restrain beverage use and enzymatic interesterification opens odor-free confectionery coatings.
- Driver: Mandatory front-of-pack calorie and saturated-fat warning labels across Latin America and North America compel confectionery brands to adopt 5-kcal-per-gram structured fats.
- Restraint: Novel Food restrictions in parts of Europe and gastrointestinal discomfort thresholds at high single-serving intakes limit salatrim use to solid confectionery and bakery matrices.
- Opportunity: Lipase-catalyzed enzymatic interesterification eliminates chemical sodium methoxide catalysts and yields cleaner-tasting drop-in cocoa butter alternatives.
Growth Analysis and Future Potential: Qualitative Demand Catalysts
High cocoa butter prices and strict government calorie labels are pushing snack bar and chocolate manufacturers to replace traditional cocoa fats with 5-kilocalorie-per-gram structured lipids. When confectionery brands remove sugar using polyols, total bar calories stay stubbornly high unless formulators also cut fat calories by blending salatrim with kokum butter stearins. In March 2025, food scientists reporting in PubMed confirmed that transesterified structured lipid blends replaced cocoa butter in chocolate recipes without losing gloss or snap. This ability to lower both formulation cost and front-of-pack calorie counts keeps commercial orders growing across dietetic snack lines.
Risk Assessment of the Salatrim Market: Operational and Formulation Friction
Regional regulatory limits and digestive tolerance thresholds above 30 grams per day remain the main restraints keeping salatrim confined to portion-controlled bars and bakery snacks. European Novel Food rules restrict broad use in everyday grocery items, while traditional chemical synthesis can leave faint short-chain acid odors unless refiners run deep steam deodorization before blending with industrial bakery ingredients. A June 2026 formulation study in PubMed on low-saturated-fat filling creams noted that replacing 25% to 75% of standard shortening requires careful oil-binding adjustment so biscuit fillings do not turn overly soft.
Commercial Opportunity Analysis: Formulation Differentiation and Value-Add Formats
Specialty fat refiners can capture higher-margin bakery and dessert business by switching from chemical catalysts to clean enzymatic interesterification. Enzyme-assisted synthesis eliminates soapy off-notes and produces neutral, dairy-friendly shortenings for low-calorie ice cream dips and laminated pastries paired with commercial dough conditioners. In April 2026, food lipid researchers publishing in PubMed confirmed that structured lipid systems improve heat stability and reduce oil absorption across baked and fried snacks. Supply of odor-free, enzyme-crafted salatrim blocks allows producers to win premium reformulation briefs from health-conscious bakery brands.
Salatrim Market by Country (2026 to 2036)
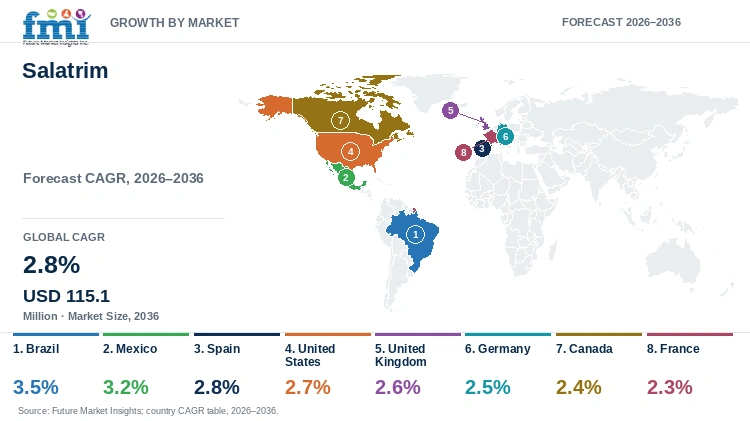
FMI country modeling indicates that Brazil leads salatrim market expansion at a 3.5% CAGR through 2036, while France advances at a 2.3% CAGR. National adoption patterns across Latin America front-of-pack labeling jurisdictions, United States dietetic snack plants, and European bakery reformulators reflect local regulatory calorie factors and domestic oilseed refining capacity.
Table 7: Country CAGR and Primary Growth Levers for the Salatrim Market (CAGR percentage and operational drivers), 2026 to 2036
| Country | CAGR (2026 to 2036) | Primary Growth Lever |
|---|---|---|
| Brazil | 3.5% | ANVISA front-of-pack warning avoidance and domestic soybean stearin refining |
| Mexico | 3.2% | NOM-051 octagonal calorie seals and 275-kcal-per-100g IEPS snack tax compliance |
| Spain | 2.8% | Heat-stable summer compound coatings and export sugar-free confectionery |
| United States | 2.7% | FDA 5-kcal-per-gram Nutrition Facts factor and GLP-1 high-protein snack bars |
| United Kingdom | 2.6% | Retail HFSS checkout promotional compliance across coated biscuits |
| Germany | 2.5% | Supermarket Nutri-Score optimization and industrial cocoa butter cost hedging |
| Canada | 2.4% | Mandatory 2026 Health Canada front-of-pack saturated-fat and calorie symbol thresholds |
| France | 2.3% | Private-label biscuit and chilled dessert Nutri-Score reformulation |
Source: Future Market Insights analysis
Brazil Salatrim Market Outlook (2026 to 2036)
Demand for salatrim in Brazil is projected to expand at a leading 3.5% CAGR through 2036 because ANVISA front-of-pack black warning labels penalize chocolates and biscuits with high calorie and saturated fat content. To avoid carrying warning seals on supermarket shelves, confectionery plants in Sao Paulo and Parana reformulate compound chocolate coatings with 5-kilocalorie-per-gram structured stearins. March 2026 Brazil figures from the USDA Foreign Agricultural Service Food Processing Ingredients Annual report, Brazil operates South America's largest food processing industry supported by extensive domestic soybean oil refining capacity. Readily available local soybean stearin helps specialty fat refiners in Brazil keep salatrim production costs competitive for domestic biscuit makers.
Key takeaway: In Brazil, ANVISA front-of-pack nutrition warning avoidance and domestic soybean stearin feedstock are projected to drive a leading 3.5% CAGR.
Mexico Salatrim Market Outlook (2026 to 2036)
Whereas reformulation in Brazil focuses on front-of-pack warning seals, buyer adoption in Mexico is driven by the 8% federal fiscal tax on non-essential foods exceeding 275 kilocalories per 100 grams and NOM-051 warning hexagons. Salatrim market size in Mexico is slated to climb at a 3.2% CAGR from 2026 to 2036 across industrial cookie, snack cake, and chocolate enrobing plants in Nuevo Leon and Jalisco. March 2026 Mexico statistics from the USDA Foreign Agricultural Service Oilseeds and Products Annual report, Mexico imported 72,131 metric tons of specialty oilseed products between September 2025 and January 2026 under North America trade lanes. Bakery chemists in Mexico blend imported salatrim into chocolate coatings to keep packaged snacks below the 275-kilocalorie tax threshold.
Key takeaway: In Mexico, keeping confectionery and bakery snacks below the 275-kcal-per-100g fiscal tax threshold is forecast to sustain a 3.2% CAGR.
Spain Salatrim Market Outlook (2026 to 2036)
In contrast to Latin America tax thresholds, demand in Spain is driven by sugar-free turron and impulse chocolate exporters that need heat-resistant coatings for warm Mediterranean summer distribution. Salatrim industry valuation across Spain is projected to advance at a 2.8% CAGR between 2026 and 2036 across Catalonia and Valencia confectionery plants. March 2026 Spain findings from the USDA Foreign Agricultural Service Food Processing Ingredients Annual report, Spain ranks as the third largest European Union buyer of specialty agricultural ingredients after the Netherlands and Germany. Confectionery makers in Spain use high-stearate structured fats to prevent chocolate melting in summer convenience stores while lowering calorie counts on dietetic export lines.
Key takeaway: In Spain, heat-stable summer confectionery coatings and export sugar-free biscuit reformulation are estimated to support a 2.8% CAGR.
United States Salatrim Market Outlook (2026 to 2036)
The United States anchors global salatrim volume because Food and Drug Administration GRAS rules explicitly allow brands to calculate salatrim at 5 kilocalories per gram on Nutrition Facts panels. Valuation of the salatrim market in the United States is anticipated to advance at a 2.7% CAGR through 2036 as consumers using GLP-1 weight-loss medications purchase high-protein, low-calorie chocolate bars and portion-controlled bakery bites. In November 2025, Cargill Incorporated released its IngredienTracker consumer study showing that over 70% of shoppers check ingredient labels and favor healthier fat and lower-calorie snacks. Contract bar coaters across the United States rely on non-tempering plastic salatrim blocks to coat protein bars at high line speeds.
Key takeaway: In the United States, FDA 5-kcal-per-gram Nutrition Facts recognition and GLP-1 companion snack bar launches are anticipated to maintain a 2.7% CAGR.
United Kingdom Salatrim Market Outlook (2026 to 2036)
Commercial uptake in the United Kingdom is shaped by supermarket High Fat, Salt and Sugar store-layout rules that ban high-calorie chocolates and biscuits from checkout aisles and endcap promotions. Salatrim industry size in the United Kingdom is slated to rise at a 2.6% CAGR from 2026 to 2036 as private-label biscuit and dessert suppliers reformulate recipes to pass retail nutrient-profiling scores. In November 2025, Tate and Lyle plc reported half-year financial results to September 30, 2025 noting strong food manufacturer demand for calorie-reduction and mouthfeel systems across the United Kingdom. Biscuit developers in the United Kingdom pair 5-kilocalorie-per-gram structured fats with soluble fibers so chocolate-coated digestives remain eligible for promotional aisle displays.
Key takeaway: In the United Kingdom, retail HFSS promotional compliance and supermarket private-label calorie caps are projected to drive a 2.6% CAGR.
Germany Salatrim Market Outlook (2026 to 2036)
Whereas brands in the United Kingdom reformulate for checkout promotion rules, industrial bakeries and chocolate makers in Germany use structured fats to improve retail Nutri-Score ratings and hedge against volatile cocoa butter costs. The salatrim market in Germany is slated to grow at a 2.5% CAGR between 2026 and 2036 across North Rhine-Westphalia and Lower Saxony snack plants. March 2026 Berlin data from the USDA Foreign Agricultural Service report, the food processing sector in Germany leads European Union demand for specialty functional fats and bakery reformulation ingredients. Compound coating manufacturers in Germany favor enzyme-interesterified stearate blends that contain zero trans fats and deliver crisp wafer snap.
Key takeaway: In Germany, retail Nutri-Score optimization and cocoa butter cost hedging across compound chocolate lines are slated to sustain a 2.5% CAGR.
Canada Salatrim Market Outlook (2026 to 2036)
Buyer adoption in Canada is accelerated by Health Canada's mandatory front-of-package nutrition symbol rules effective January 2026, which place a magnifying-glass warning on packaged snacks exceeding saturated fat and calorie limits. Valuation of the salatrim market in Canada is predicted to progress at a 2.4% CAGR through 2036 across Ontario and Quebec protein bar and frozen dessert plants. Per the April 2025 USDA Foreign Agricultural Service Canada Food Processing Ingredients Annual report, food manufacturers in Canada actively import specialized fat-replacement systems from United States refiners to meet federal labeling rules. Ice cream novelty makers in Canada blend pourable structured lipids into chocolate dip coatings to trim saturated fat per bar.
Key takeaway: In Canada, mandatory 2026 front-of-package nutrition symbol thresholds and frozen novelty coating reformulation are predicted to support a 2.4% CAGR.
France Salatrim Market Outlook (2026 to 2036)
France posts a steadier 2.3% CAGR through 2036 because artisan chocolatiers stick to pure cocoa butter standards while industrial biscuit and bake-off pastry plants selectively adopt reduced-calorie shortenings. Even so, major supermarket chains across France push private-label cookie and chilled mousse suppliers to improve front-of-pack Nutri-Score grades across everyday grocery aisles. Per the July 2026 USDA Foreign Agricultural Service France Exporter Guide Annual report, food processing companies in France imported USD 1.0 billion in specialty agricultural and oilseed products from the United States in 2025. Industrial biscuit makers in France blend semi-solid structured stearate fats into reduced-calorie sandwich cookie creams for national supermarket chains.
Key takeaway: In France, supermarket private-label Nutri-Score targets in biscuits and chilled desserts are forecast to sustain a 2.3% CAGR despite traditional cocoa butter rules.
Full report country CAGRs cover: North America and Latin America with Western Europe and Eastern Europe. Coverage also includes East Asia, South Asia and Pacific, and Middle East and Africa.
Who are the notable companies in the salatrim market?
dsm-firmenich AG and Archer Daniels Midland Company with Cargill Incorporated, International Flavors and Fragrances Inc., Kerry Group plc, Ingredion Incorporated, Tate and Lyle plc, Roquette Freres SA, Corbion N.V. and Palsgaard A/S are the notable companies in the salatrim market.
Competitive positioning in the salatrim industry divides oilseed interesterification and specialty confectionery fat refiners, global taste and calorie-reduction system formulators, and clean-label emulsifier and texture specialists. Archer Daniels Midland Company and Cargill Incorporated with dsm-firmenich AG operate catalytic and enzymatic lipid interesterification and nutrition lipid platforms. International Flavors and Fragrances Inc. and Kerry Group plc with Ingredion Incorporated and Tate and Lyle plc engineer reduced-calorie dairy, bakery, and confectionery mouthfeel matrices. Roquette Freres SA and Corbion N.V. with Palsgaard A/S supply complementary polyol sweeteners and crystal-stabilizing emulsifiers.
- Structured Lipid and Confectionery Fat Refiners: Archer Daniels Midland Company and Cargill Incorporated with dsm-firmenich AG synthesize interesterified short- and long-chain acyl triglycerides and cocoa butter alternatives.
- Calorie-Reduction and Mouthfeel System Formulators: International Flavors and Fragrances Inc. and Kerry Group plc with Ingredion Incorporated and Tate and Lyle plc integrate structured fats with flavor maskers and bulking fibers.
- Complementary Polyol and Crystal Emulsifier Specialists: Roquette Freres SA and Corbion N.V. with Palsgaard A/S provide maltitol, polyglycerol polyricinoleate, and dough-conditioning lipids for low-calorie coatings.
Competitive Benchmarking: Salatrim Market
Table 8: Competitive Benchmarking for the Salatrim Market (qualitative capability ratings), 2026
| Company | Interesterification & Acyl Control | Confectionery Coating Rheology | Low-Calorie Reformulation Fit | Geographic Reach |
|---|---|---|---|---|
| dsm-firmenich AG | High | High | High | Global nutrition lipids, baking enzymes, and Princeton Baking Innovation Center |
| Archer Daniels Midland Company | High | High | High | Global oilseed hydrogenation, interesterification, and specialty fat refineries |
| Cargill Incorporated | High | High | High | Global cocoa, chocolate, NextCoa confectionery alternatives, and specialty oils |
| International Flavors and Fragrances Inc. | Medium | High | High | Global Danisco emulsifiers, fat-mimetic hydrocolloids, and flavor maskers |
| Kerry Group plc | Medium | High | High | Global taste modulation, dairy lipid systems, and reduced-calorie bakery labs |
| Ingredion Incorporated | Medium | High | High | Global texture starches, FUSERA clean-label matrices, and bar binding systems |
| Tate and Lyle plc | Medium | High | High | Global calorie-reduction fibers, sweeteners, and CP Kelco hydrocolloid stabilizers |
| Roquette Freres SA | Medium | High | High | Global SweetPearl maltitol and polyol systems for sugar-free chocolate coatings |
| Corbion N.V. | Medium | High | High | Global lactic acid esters, dough conditioners, and bakery fat-reduction systems |
| Palsgaard A/S | Medium | High | High | Global PGPR and ammonium phosphatide chocolate rheology emulsifiers |
Evaluation basis: Interesterification & Acyl Control rates catalytic and enzymatic synthesis of C2-C4 and C18 stearin esters, whereas Confectionery Coating Rheology measures pilot enrobing and Casson viscosity support. Low-Calorie Reformulation Fit evaluates capability to bundle structured fats with polyols and fibers.
Key Developments in the Salatrim Market
- dsm-firmenich AG inaugurated its Princeton Baking Innovation Center in New Jersey in May 2025 to accelerate pilot-scale lipid and reduced-calorie bakery reformulation.
- Cargill Incorporated presented its specialty fats and cocoa-replacement portfolio at Fi Asia in September 2026 to help food manufacturers formulate healthier and cost-resilient confectionery products.
- Corbion N.V. debuted its expanded clean-label dough conditioning and fat-reduction technology suite at IBIE 2025 on September 2, 2025 for industrial bakeries.
Key Players in the Salatrim Market
Structured Lipid and Confectionery Fat Refiners
- dsm-firmenich AG
- Archer Daniels Midland Company
- Cargill Incorporated
- Calorie-Reduction and Mouthfeel System Formulators
International Flavors and Fragrances Inc.
- Kerry Group plc
- Ingredion Incorporated
- Tate and Lyle plc
- Complementary Polyol and Crystal Emulsifier Specialists
Roquette Freres SA
- Corbion N.V.
- Palsgaard A/S
Salatrim Market - Report Scope
Table 9: Report Scope for the Salatrim Market (coverage fields and definitions), 2026 to 2036
| Coverage field | Report scope |
|---|---|
| Market breakdown | Acyl Triglyceride Architecture, Physical Consistency, Functional Performance, Food Application, Sales Channel |
| Quantitative Units | USD Million |
| Market Definition | Includes commercial supplier valuation from short- and long-chain acyl triglyceride molecules (salatrim / Benefat-type structured triacylglycerols esterifying acetic, propionic, and butyric acids with stearic acid) sold as 5-kcal-per-gram fat replacers and cocoa butter alternatives. Category Scope Note: Excludes non-caloric sucrose polyesters (olestra), conventional lauric palm-kernel stearins, and carbohydrate or protein fat mimetics. |
| Regions Covered | North America, Latin America, Western Europe, Eastern Europe, East Asia, South Asia and Pacific, Middle East and Africa |
| Countries Covered | Brazil, Mexico, Spain, United States, United Kingdom, Germany, Canada, France, and additional countries in the full report |
| Key Companies Covered | dsm-firmenich AG, Archer Daniels Midland Company, Cargill Incorporated, International Flavors and Fragrances Inc., Kerry Group plc, Ingredion Incorporated, Tate and Lyle plc, Roquette Freres SA, Corbion N.V., Palsgaard A/S |
| Forecast Period | 2026 to 2036 |
| Approach | Primary and secondary research with top-down and bottom-up market triangulation. |
Salatrim Market - Research Methodology
Table 10: Research Methodology for the Salatrim Market (research methods and approach), 2026 edition
| Method | Approach |
|---|---|
| Primary Research | Structured interviews with specialty oilseed interesterification engineers, compound chocolate formulators, and industrial bakery R&D directors to validate solid-fat-content curves and per-ton lipid pricing. |
| Secondary Research | Analysis of FDA GRAS and ANVISA/NOM-051 nutritional labeling standards, USDA FAS Oilseeds and Food Processing Ingredients Annual reports, PubMed structured lipid studies, and corporate filings. |
| Market Sizing and Forecasting | Top-down global specialty fats and fat-replacer baselines reconciled against bottom-up commercial salatrim tonnage (23.0K to 25.8K MT in 2026) and realized contract prices per metric ton through 2036. |
| Country Forecasting Model | Econometric national models weight front-of-pack calorie warning enforcement, sugar-free and protein-bar production volume, and domestic vegetable stearin refining capacity across eight countries. |
| Operational Benchmark Traceability | Confectionery tonnage and line procurement indicators in Tables 2, 3, and 4 trace to Food Chemistry structured lipid crystallization assays and USDA FAS national food processing registries. |
| Data Triangulation and Validation | Pre-write hierarchy audit corrected the raw 105.0% acyl architecture share entry to 64.5% so all segment shares sum to 100.0% and isolate 5-kcal-per-gram short-long acyl triacylglycerols. |
Salatrim Market by Segments
Salatrim Market segmented by Acyl Triglyceride Architecture:
- Short-Chain Acyl Acetate Propionate Butyrate with Long-Chain Stearate Blends
- Propionate-Butyrate-Stearate Confectionery Triacylglycerols
- Acetate-Enriched Bakery Stearate Structured Lipids
- Enzymatically Tailored Multi-Acyl Esters
Salatrim Market segmented by Physical Consistency:
- Semi-Solid Plastic Vegetable Fat
- Liquid Pourable Shortening Blend
- Flaked and Pelleted Confectionery Stearin
- Micro-Aerated Bakery Shortening Blocks
Salatrim Market segmented by Functional Performance:
- Reduced-Calorie Fat Replacer 5 kcal per g vs 9 kcal per g
- Drop-In Cocoa Butter Replacement in Confectionery
- Saturated-Fat-Reduced Texture Plasticizer
- Bloom-Resistant Coating Stabilizer
- Moisture-Barrier Crumb Softener
Salatrim Market segmented by Food Application:
- Low-Calorie Chocolate and Confectionery Coatings
- Dairy Dessert Fat Replacement
- Bakery Goods Pastries and Cookies Shortenings
- High-Protein Nutrition Bar Enrobing
Salatrim Market segmented by Sales Channel:
- Direct to Industrial Confectionery and Bakery Accounts
- Specialty Lipid and Food Ingredient Distributors
- Contract Snack and Bar Co-Manufacturers
- Online B2B Formulation Supply
Salatrim Market by Region
- North America
- United States
- Canada
- Latin America
- Brazil
- Mexico
- Argentina
- Chile
- Western Europe
- Germany
- France
- United Kingdom
- Italy
- Spain
- Benelux
- Nordics
- Eastern Europe
- Poland
- Czech Republic
- Romania
- Hungary
- East Asia
- China
- Japan
- South Korea
- South Asia and Pacific
- India
- ASEAN
- Australia and New Zealand
- Middle East and Africa
- GCC Countries
- South Africa
- Türkiye
- Israel
Research Sources and Bibliography
- [1] Kim, B. H. et al. (2024, August 26). A review on preparation and application of low-calorie structured lipids in food systems. Food Science and Biotechnology (PubMed PMID 39758727).
- [2] USDA Foreign Agricultural Service. (2026, April 02). Netherlands Food Processing Ingredients Annual Report. U.S. Department of Agriculture GAIN Report NL2026-0006.
- [3] Cargill Incorporated. (2026, April 20). Cargill Wins 2026 Edison Awards for Food Innovation. Cargill Corporate Media Center.
- [4] Savchina, E. et al. (2026, July 11). Sustainable industrial crop-based strategies for cocoa butter substitutes and structured lipids. Food Chemistry X, 38, 104187 (PMC13425824).
- [5] Liu, Y. et al. (2026, August 27). Development of heat-stable dark chocolate using ternary blends of cocoa butter and soybean oil-based structured fat. Food Chemistry, 527, 150926 (PubMed PMID 42667775).
- [6] Wang, X. et al. (2026, October 02). Foam-templated dual-network oleogels based on soybean protein isolate and glycerol monostearate for partial cocoa butter replacement. Food Chemistry (PubMed PMID 42838010).
- [7] Zhang, H. et al. (2026, March 20). Recent advances in enzymatic synthesis and food applications of structured lipids. Critical Reviews in Food Science and Nutrition (PubMed PMID 41844109).
- [8] Chen, Q. et al. (2025, November 05). Mango kernel fat-based oleogel as cocoa butter substitutes with efficient anti-frosting and crystallization kinetics. Food Chemistry, 496(Pt 3), 146939 (PubMed PMID 41202371).
- [9] Li, J. et al. (2025, July 26). Novel lipase-catalyzed synthesis of structured lipids via two-step enzymatic transesterification. Food Chemistry (PubMed PMID 40894969).
- [10] Zhao, R. Y. et al. (2025, January 15). Depiction of 2-oleic acid-1,3-saturated fatty acid triacylglycerols intended for cocoa butter equivalents. Food Chemistry (PubMed PMID 39383796).
- [11] Palsgaard A/S. (2025, July 08). Palsgaard Inaugurates Application Centre in Navi Mumbai to Strengthen Regional Customer Support. Palsgaard A/S Corporate Newsroom.
- [12] Patel, S. et al. (2025, March 01). Effect of transesterified amaranth oil oleogel as a cocoa butter replacer in chocolate formulations. Journal of Food Science and Technology (PMC11930172).
- [13] Demir, M. K. et al. (2026, June 10). A Novel Approach to Reducing Saturated Fatty Acids in Filling Creams Using Structured Lipids. Foods (PubMed PMID 42299107).
- [14] Xu, L. et al. (2026, April 15). Oleogel-based frying quality attributes and food properties in healthier lipid systems. Food Research International (PubMed PMID 41672009).
- [15] USDA Foreign Agricultural Service. (2026, March 31). Brazil Food Processing Ingredients Annual. U.S. Department of Agriculture GAIN Report BR2026-0011.
- [16] USDA Foreign Agricultural Service. (2026, March 31). Mexico Oilseeds and Products Annual. U.S. Department of Agriculture GAIN Report MX2026-0020.
- [17] USDA Foreign Agricultural Service. (2026, March 31). Spain Food Processing Ingredients Annual. U.S. Department of Agriculture GAIN Report SP2026-0003.
- [18] Cargill Incorporated. (2025, November 14). Cargill APAC IngredienTracker 2025 Reveals Impact of Ingredient Transparency on Purchase Decisions. Cargill Corporate Media Center.
- [19] Tate and Lyle plc. (2025, November 06). Tate and Lyle PLC Results for the Six Months to 30 September 2025. Tate and Lyle PLC Official Newsroom.
- [20] USDA Foreign Agricultural Service. (2026, March 30). Germany Food Processing Ingredients Annual Report Berlin. U.S. Department of Agriculture GAIN Report GM2026-0007 PDF.
- [21] USDA Foreign Agricultural Service. (2025, April 09). Canada Food Processing Ingredients Annual 2025. U.S. Department of Agriculture GAIN Report CA2025-0005.
- [22] USDA Foreign Agricultural Service. (2026, July 09). France Exporter Guide Annual. U.S. Department of Agriculture GAIN Report FR2026-0006.
- [23] dsm-firmenich AG. (2025, May 20). On the rise dsm-firmenich opens Princeton Baking Innovation Center in Princeton NJ. dsm-firmenich Corporate Press Releases.
- [24] Cargill Incorporated. (2026, September 17). Cargill Highlights Food Ingredient Solutions at Fi Asia 2026. Cargill Corporate Media Center.
- [25] Corbion N.V. (2025, September 02). Corbion leads clean-label reformulation forward at IBIE 2025. Corbion N.V. Media Releases.
- [26] International Flavors and Fragrances Inc. (2025, May 13). Study on Boosting Dough Strength in Industrial Baking with Enzyme and Lipid Solutions. International Flavors and Fragrances Inc. Media Room.
- [27] dsm-firmenich AG. (2026, February 20). Investments Note in dsm-firmenich Integrated Annual Report 2025. dsm-firmenich Annual Report Portal.
- [28] Kerry Group plc. (2026, March 19). Kerry publishes 2025 Annual Report A year defined by impact. Kerry Group plc Media Releases.
- [29] USDA Foreign Agricultural Service. (2026, July 06). Brazil Oilseeds and Products Update. U.S. Department of Agriculture GAIN Report BR2026.
- [30] dsm-firmenich AG. (2026, February 09). dsm-firmenich announces agreement to divest Animal Nutrition and Health to CVC Capital Partners. dsm-firmenich Corporate Press Releases.
- [31] Tate and Lyle plc. (2026, June 02). Discover Tate and Lyle transformational year in 2026 Annual Report. Tate and Lyle PLC Official Newsroom.
- [32] dsm-firmenich AG. (2026, March 17). Global health priorities in Health Nutrition and Care. dsm-firmenich Talking Nutrition Portal.
Curated bibliography references appear above for reader lookup while the full salatrim market study contains the complete source list.
This Report Answers
- How large is the salatrim market in 2026 and what is forecast for 2036?
- Which front-of-pack calorie regulations and cocoa butter cost pressures drive demand for salatrim?
- Why do Short-Chain Acyl Acetate Propionate Butyrate with Long-Chain Stearate Blends lead acyl architecture?
- Why does Semi-Solid Plastic Vegetable Fat lead the physical consistency category globally?
- How do growth rates differ between Brazil and Mexico or between Spain and the United States?
- Which leading companies supply interesterified structured lipids versus broader calorie-reduction systems?
- What limits single-serving salatrim dosage or causes volatile short-chain acid odor notes?
- What should confectionery formulators evaluate before replacing cocoa butter with salatrim?
Table of Content
- Key Takeaways
- Market Size and CAGR
- Top Growth Driver
- Fastest Growing Segment
- Leading Region
- Key Companies
- Emerging Opportunities
- Executive Summary
- Global Market Outlook
- Demand-side Trends
- Supply-side Trends
- Technology Roadmap Analysis
- Analysis and Recommendations
- Analyst Perspective (What is happening? Why now? What should investors know?)
- Key Questions Answered
- How large is the market?
- What is the CAGR?
- What are key trends?
- Which region dominates?
- Who are the leaders?
Read More...
- Market Overview
- Market Coverage / Taxonomy
- Market Definition / Scope / Limitations
- Research Methodology
- Chapter Orientation
- Analytical Lens and Working Hypotheses
- Market Structure, Signals, and Trend Drivers
- Benchmarking and Cross-market Comparability
- Market Sizing, Forecasting, and Opportunity Mapping
- Research Design and Evidence Framework
- Desk Research Programme (Secondary Evidence)
- Expert Input and Fieldwork (Primary Evidence)
- Tooling, Models, and Reference Databases
- Data Engineering and Model Build
- Quality Assurance and Audit Trail
- Market Background
- Market Dynamics (Drivers, Restraints, Opportunity, Trends)
- Scenario Forecast (Optimistic, Likely, Conservative)
- Impact Analysis
- AI Impact
- Sustainability Impact
- Regulatory Impact
- Technology Impact
- Consumer / Buyer Analysis
- Purchase Drivers
- Adoption Barriers
- Buyer Journey
- Opportunity Map Analysis
- Product Life Cycle Analysis
- Supply Chain Analysis
- Investment Feasibility Matrix
- Value Chain Analysis
- PESTLE and Porter's Analysis
- Regulatory Landscape
- Regional Parent Market Outlook
- Production and Consumption Statistics
- Import and Export Statistics
- Global Market Analysis and Forecast, 2021 to 2036
- Historical Market Size Value (USD Million) Analysis, 2021 to 2025
- Current and Future Market Size Value (USD Million) Projections, 2026 to 2036
- Y-o-Y Growth Trend Analysis
- Absolute $ Opportunity Analysis
- Global Market Pricing Analysis, 2021 to 2036
- Global Market Analysis and Forecast, By Acyl Triglyceride Architecture, 2021 to 2036
- Introduction / Key Findings
- Historical Market Size Value (USD Million) Analysis By Acyl Triglyceride Architecture, 2021 to 2025
- Current and Future Market Size Value (USD Million) Analysis and Forecast By Acyl Triglyceride Architecture, 2026 to 2036
- Short-Chain Acyl Acetate Propionate Butyrate with Long-Chain Stearate Blends
- Propionate-Butyrate-Stearate Confectionery Triacylglycerols
- Acetate-Enriched Bakery Stearate Structured Lipids
- Enzymatically Tailored Multi-Acyl Esters
- Y-o-Y Growth Trend Analysis By Acyl Triglyceride Architecture, 2021 to 2025
- Absolute $ Opportunity Analysis By Acyl Triglyceride Architecture, 2026 to 2036
- Global Market Analysis and Forecast, By Physical Consistency, 2021 to 2036
- Introduction / Key Findings
- Historical Market Size Value (USD Million) Analysis By Physical Consistency, 2021 to 2025
- Current and Future Market Size Value (USD Million) Analysis and Forecast By Physical Consistency, 2026 to 2036
- Semi-Solid Plastic Vegetable Fat
- Liquid Pourable Shortening Blend
- Flaked and Pelleted Confectionery Stearin
- Micro-Aerated Bakery Shortening Blocks
- Y-o-Y Growth Trend Analysis By Physical Consistency, 2021 to 2025
- Absolute $ Opportunity Analysis By Physical Consistency, 2026 to 2036
- Global Market Analysis and Forecast, By Functional Performance, 2021 to 2036
- Introduction / Key Findings
- Historical Market Size Value (USD Million) Analysis By Functional Performance, 2021 to 2025
- Current and Future Market Size Value (USD Million) Analysis and Forecast By Functional Performance, 2026 to 2036
- Reduced-Calorie Fat Replacer 5 kcal per g vs 9 kcal per g
- Drop-In Cocoa Butter Replacement in Confectionery
- Saturated-Fat-Reduced Texture Plasticizer
- Bloom-Resistant Coating Stabilizer
- Moisture-Barrier Crumb Softener
- Y-o-Y Growth Trend Analysis By Functional Performance, 2021 to 2025
- Absolute $ Opportunity Analysis By Functional Performance, 2026 to 2036
- Global Market Analysis and Forecast, By Food Application, 2021 to 2036
- Introduction / Key Findings
- Historical Market Size Value (USD Million) Analysis By Food Application, 2021 to 2025
- Current and Future Market Size Value (USD Million) Analysis and Forecast By Food Application, 2026 to 2036
- Low-Calorie Chocolate and Confectionery Coatings
- Dairy Dessert Fat Replacement
- Bakery Goods Pastries and Cookies Shortenings
- High-Protein Nutrition Bar Enrobing
- Y-o-Y Growth Trend Analysis By Food Application, 2021 to 2025
- Absolute $ Opportunity Analysis By Food Application, 2026 to 2036
- Global Market Analysis and Forecast, By Sales Channel, 2021 to 2036
- Introduction / Key Findings
- Historical Market Size Value (USD Million) Analysis By Sales Channel, 2021 to 2025
- Current and Future Market Size Value (USD Million) Analysis and Forecast By Sales Channel, 2026 to 2036
- Direct to Industrial Confectionery and Bakery Accounts
- Specialty Lipid and Food Ingredient Distributors
- Contract Snack and Bar Co-Manufacturers
- Online B2B Formulation Supply
- Y-o-Y Growth Trend Analysis By Sales Channel, 2021 to 2025
- Absolute $ Opportunity Analysis By Sales Channel, 2026 to 2036
- Global Market Analysis and Forecast, By Region, 2021 to 2036
- Introduction
- Historical Market Size Value (USD Million) Analysis By Region, 2021 to 2025
- Current Market Size Value (USD Million) Analysis and Forecast By Region, 2026 to 2036
- North America
- Latin America
- Western Europe
- Eastern Europe
- East Asia
- South Asia and Pacific
- Middle East and Africa
- Market Attractiveness Analysis By Region
- North America Market Analysis and Forecast, By Country, 2021 to 2036
- Historical Market Size Value (USD Million) Trend Analysis By Market Taxonomy, 2021 to 2025
- Market Size Value (USD Million) Forecast By Market Taxonomy, 2026 to 2036
- By Country
- United States
- Canada
- By Acyl Triglyceride Architecture
- By Physical Consistency
- By Functional Performance
- By Food Application
- By Sales Channel
- By Country
- Market Attractiveness Analysis
- By Country
- By Acyl Triglyceride Architecture
- By Physical Consistency
- By Functional Performance
- By Food Application
- By Sales Channel
- Key Takeaways
- Latin America Market Analysis and Forecast, By Country
- Historical Market Size Value (USD Million) Trend Analysis By Market Taxonomy, 2021 to 2025
- Market Size Value (USD Million) Forecast By Market Taxonomy, 2026 to 2036
- By Country
- Brazil
- Mexico
- Argentina
- Chile
- By Acyl Triglyceride Architecture
- By Physical Consistency
- By Functional Performance
- By Food Application
- By Sales Channel
- By Country
- Market Attractiveness Analysis
- By Country
- By Acyl Triglyceride Architecture
- By Physical Consistency
- By Functional Performance
- By Food Application
- By Sales Channel
- Key Takeaways
- Western Europe Market Analysis and Forecast, By Country
- Historical Market Size Value (USD Million) Trend Analysis By Market Taxonomy, 2021 to 2025
- Market Size Value (USD Million) Forecast By Market Taxonomy, 2026 to 2036
- By Country
- Germany
- France
- United Kingdom
- Italy
- Spain
- Benelux
- Nordics
- By Acyl Triglyceride Architecture
- By Physical Consistency
- By Functional Performance
- By Food Application
- By Sales Channel
- By Country
- Market Attractiveness Analysis
- By Country
- By Acyl Triglyceride Architecture
- By Physical Consistency
- By Functional Performance
- By Food Application
- By Sales Channel
- Key Takeaways
- Eastern Europe Market Analysis and Forecast, By Country
- Historical Market Size Value (USD Million) Trend Analysis By Market Taxonomy, 2021 to 2025
- Market Size Value (USD Million) Forecast By Market Taxonomy, 2026 to 2036
- By Country
- Poland
- Czech Republic
- Romania
- Hungary
- By Acyl Triglyceride Architecture
- By Physical Consistency
- By Functional Performance
- By Food Application
- By Sales Channel
- By Country
- Market Attractiveness Analysis
- By Country
- By Acyl Triglyceride Architecture
- By Physical Consistency
- By Functional Performance
- By Food Application
- By Sales Channel
- Key Takeaways
- East Asia Market Analysis and Forecast, By Country
- Historical Market Size Value (USD Million) Trend Analysis By Market Taxonomy, 2021 to 2025
- Market Size Value (USD Million) Forecast By Market Taxonomy, 2026 to 2036
- By Country
- China
- Japan
- South Korea
- By Acyl Triglyceride Architecture
- By Physical Consistency
- By Functional Performance
- By Food Application
- By Sales Channel
- By Country
- Market Attractiveness Analysis
- By Country
- By Acyl Triglyceride Architecture
- By Physical Consistency
- By Functional Performance
- By Food Application
- By Sales Channel
- Key Takeaways
- South Asia and Pacific Market Analysis and Forecast, By Country
- Historical Market Size Value (USD Million) Trend Analysis By Market Taxonomy, 2021 to 2025
- Market Size Value (USD Million) Forecast By Market Taxonomy, 2026 to 2036
- By Country
- India
- ASEAN
- Australia and New Zealand
- By Acyl Triglyceride Architecture
- By Physical Consistency
- By Functional Performance
- By Food Application
- By Sales Channel
- By Country
- Market Attractiveness Analysis
- By Country
- By Acyl Triglyceride Architecture
- By Physical Consistency
- By Functional Performance
- By Food Application
- By Sales Channel
- Key Takeaways
- Middle East and Africa Market Analysis and Forecast, By Country
- Historical Market Size Value (USD Million) Trend Analysis By Market Taxonomy, 2021 to 2025
- Market Size Value (USD Million) Forecast By Market Taxonomy, 2026 to 2036
- By Country
- GCC Countries
- South Africa
- Türkiye
- Israel
- By Acyl Triglyceride Architecture
- By Physical Consistency
- By Functional Performance
- By Food Application
- By Sales Channel
- By Country
- Market Attractiveness Analysis
- By Country
- By Acyl Triglyceride Architecture
- By Physical Consistency
- By Functional Performance
- By Food Application
- By Sales Channel
- Key Takeaways
- Key Countries Market Analysis
- United States
- Pricing Analysis
- Market Share Analysis, 2025
- By Acyl Triglyceride Architecture
- By Physical Consistency
- By Functional Performance
- By Food Application
- By Sales Channel
- Canada
- Pricing Analysis
- Market Share Analysis, 2025
- By Acyl Triglyceride Architecture
- By Physical Consistency
- By Functional Performance
- By Food Application
- By Sales Channel
- Mexico
- Pricing Analysis
- Market Share Analysis, 2025
- By Acyl Triglyceride Architecture
- By Physical Consistency
- By Functional Performance
- By Food Application
- By Sales Channel
- Brazil
- Pricing Analysis
- Market Share Analysis, 2025
- By Acyl Triglyceride Architecture
- By Physical Consistency
- By Functional Performance
- By Food Application
- By Sales Channel
- Chile
- Pricing Analysis
- Market Share Analysis, 2025
- By Acyl Triglyceride Architecture
- By Physical Consistency
- By Functional Performance
- By Food Application
- By Sales Channel
- Germany
- Pricing Analysis
- Market Share Analysis, 2025
- By Acyl Triglyceride Architecture
- By Physical Consistency
- By Functional Performance
- By Food Application
- By Sales Channel
- United Kingdom
- Pricing Analysis
- Market Share Analysis, 2025
- By Acyl Triglyceride Architecture
- By Physical Consistency
- By Functional Performance
- By Food Application
- By Sales Channel
- Italy
- Pricing Analysis
- Market Share Analysis, 2025
- By Acyl Triglyceride Architecture
- By Physical Consistency
- By Functional Performance
- By Food Application
- By Sales Channel
- Spain
- Pricing Analysis
- Market Share Analysis, 2025
- By Acyl Triglyceride Architecture
- By Physical Consistency
- By Functional Performance
- By Food Application
- By Sales Channel
- France
- Pricing Analysis
- Market Share Analysis, 2025
- By Acyl Triglyceride Architecture
- By Physical Consistency
- By Functional Performance
- By Food Application
- By Sales Channel
- India
- Pricing Analysis
- Market Share Analysis, 2025
- By Acyl Triglyceride Architecture
- By Physical Consistency
- By Functional Performance
- By Food Application
- By Sales Channel
- ASEAN
- Pricing Analysis
- Market Share Analysis, 2025
- By Acyl Triglyceride Architecture
- By Physical Consistency
- By Functional Performance
- By Food Application
- By Sales Channel
- Australia and New Zealand
- Pricing Analysis
- Market Share Analysis, 2025
- By Acyl Triglyceride Architecture
- By Physical Consistency
- By Functional Performance
- By Food Application
- By Sales Channel
- China
- Pricing Analysis
- Market Share Analysis, 2025
- By Acyl Triglyceride Architecture
- By Physical Consistency
- By Functional Performance
- By Food Application
- By Sales Channel
- Japan
- Pricing Analysis
- Market Share Analysis, 2025
- By Acyl Triglyceride Architecture
- By Physical Consistency
- By Functional Performance
- By Food Application
- By Sales Channel
- South Korea
- Pricing Analysis
- Market Share Analysis, 2025
- By Acyl Triglyceride Architecture
- By Physical Consistency
- By Functional Performance
- By Food Application
- By Sales Channel
- Poland
- Pricing Analysis
- Market Share Analysis, 2025
- By Acyl Triglyceride Architecture
- By Physical Consistency
- By Functional Performance
- By Food Application
- By Sales Channel
- Hungary
- Pricing Analysis
- Market Share Analysis, 2025
- By Acyl Triglyceride Architecture
- By Physical Consistency
- By Functional Performance
- By Food Application
- By Sales Channel
- Türkiye
- Pricing Analysis
- Market Share Analysis, 2025
- By Acyl Triglyceride Architecture
- By Physical Consistency
- By Functional Performance
- By Food Application
- By Sales Channel
- South Africa
- Pricing Analysis
- Market Share Analysis, 2025
- By Acyl Triglyceride Architecture
- By Physical Consistency
- By Functional Performance
- By Food Application
- By Sales Channel
- United States
- Market Structure Analysis
- Competition Dashboard
- Competition Benchmarking
- Market Share Analysis of Top Players
- By Regional
- By Acyl Triglyceride Architecture
- By Physical Consistency
- By Functional Performance
- By Food Application
- By Sales Channel
- Emerging Startups
- Innovation Benchmarking
- Competition Analysis
- Competition Deep Dive
- dsm-firmenich AG
- Overview
- Product Portfolio
- Profitability by Market Segments
- Sales Footprint
- Strategy Overview
- Marketing Strategy
- Product Strategy
- Channel Strategy
- Archer Daniels Midland Company
- Cargill Incorporated
- International Flavors and Fragrances Inc.
- Kerry Group plc
- Ingredion Incorporated
- Tate and Lyle plc
- Roquette Freres SA
- Corbion N.V.
- Palsgaard A/S
- Calorie-Reduction and Mouthfeel System Formulators
- Complementary Polyol and Crystal Emulsifier Specialists
- dsm-firmenich AG
- Case Studies
- Success Stories
- Recent Developments
- Competition Deep Dive
- Assumptions & Acronyms Used
List of Tables
- Table 1: Global Market Value (USD Million) Forecast by Region, 2021 to 2036
- Table 2: Global Market Value (USD Million) Forecast by Acyl Triglyceride Architecture, 2021 to 2036
- Table 3: Global Market Value (USD Million) Forecast by Physical Consistency, 2021 to 2036
- Table 4: Global Market Value (USD Million) Forecast by Functional Performance, 2021 to 2036
- Table 5: Global Market Value (USD Million) Forecast by Food Application, 2021 to 2036
- Table 6: Global Market Value (USD Million) Forecast by Sales Channel, 2021 to 2036
- Table 7: North America Market Value (USD Million) Forecast by Country, 2021 to 2036
- Table 8: North America Market Value (USD Million) Forecast by Acyl Triglyceride Architecture, 2021 to 2036
- Table 9: North America Market Value (USD Million) Forecast by Physical Consistency, 2021 to 2036
- Table 10: North America Market Value (USD Million) Forecast by Functional Performance, 2021 to 2036
- Table 11: North America Market Value (USD Million) Forecast by Food Application, 2021 to 2036
- Table 12: North America Market Value (USD Million) Forecast by Sales Channel, 2021 to 2036
- Table 13: Latin America Market Value (USD Million) Forecast by Country, 2021 to 2036
- Table 14: Latin America Market Value (USD Million) Forecast by Acyl Triglyceride Architecture, 2021 to 2036
- Table 15: Latin America Market Value (USD Million) Forecast by Physical Consistency, 2021 to 2036
- Table 16: Latin America Market Value (USD Million) Forecast by Functional Performance, 2021 to 2036
- Table 17: Latin America Market Value (USD Million) Forecast by Food Application, 2021 to 2036
- Table 18: Latin America Market Value (USD Million) Forecast by Sales Channel, 2021 to 2036
- Table 19: Western Europe Market Value (USD Million) Forecast by Country, 2021 to 2036
- Table 20: Western Europe Market Value (USD Million) Forecast by Acyl Triglyceride Architecture, 2021 to 2036
- Table 21: Western Europe Market Value (USD Million) Forecast by Physical Consistency, 2021 to 2036
- Table 22: Western Europe Market Value (USD Million) Forecast by Functional Performance, 2021 to 2036
- Table 23: Western Europe Market Value (USD Million) Forecast by Food Application, 2021 to 2036
- Table 24: Western Europe Market Value (USD Million) Forecast by Sales Channel, 2021 to 2036
- Table 25: Eastern Europe Market Value (USD Million) Forecast by Country, 2021 to 2036
- Table 26: Eastern Europe Market Value (USD Million) Forecast by Acyl Triglyceride Architecture, 2021 to 2036
- Table 27: Eastern Europe Market Value (USD Million) Forecast by Physical Consistency, 2021 to 2036
- Table 28: Eastern Europe Market Value (USD Million) Forecast by Functional Performance, 2021 to 2036
- Table 29: Eastern Europe Market Value (USD Million) Forecast by Food Application, 2021 to 2036
- Table 30: Eastern Europe Market Value (USD Million) Forecast by Sales Channel, 2021 to 2036
- Table 31: East Asia Market Value (USD Million) Forecast by Country, 2021 to 2036
- Table 32: East Asia Market Value (USD Million) Forecast by Acyl Triglyceride Architecture, 2021 to 2036
- Table 33: East Asia Market Value (USD Million) Forecast by Physical Consistency, 2021 to 2036
- Table 34: East Asia Market Value (USD Million) Forecast by Functional Performance, 2021 to 2036
- Table 35: East Asia Market Value (USD Million) Forecast by Food Application, 2021 to 2036
- Table 36: East Asia Market Value (USD Million) Forecast by Sales Channel, 2021 to 2036
- Table 37: South Asia and Pacific Market Value (USD Million) Forecast by Country, 2021 to 2036
- Table 38: South Asia and Pacific Market Value (USD Million) Forecast by Acyl Triglyceride Architecture, 2021 to 2036
- Table 39: South Asia and Pacific Market Value (USD Million) Forecast by Physical Consistency, 2021 to 2036
- Table 40: South Asia and Pacific Market Value (USD Million) Forecast by Functional Performance, 2021 to 2036
- Table 41: South Asia and Pacific Market Value (USD Million) Forecast by Food Application, 2021 to 2036
- Table 42: South Asia and Pacific Market Value (USD Million) Forecast by Sales Channel, 2021 to 2036
- Table 43: Middle East and Africa Market Value (USD Million) Forecast by Country, 2021 to 2036
- Table 44: Middle East and Africa Market Value (USD Million) Forecast by Acyl Triglyceride Architecture, 2021 to 2036
- Table 45: Middle East and Africa Market Value (USD Million) Forecast by Physical Consistency, 2021 to 2036
- Table 46: Middle East and Africa Market Value (USD Million) Forecast by Functional Performance, 2021 to 2036
- Table 47: Middle East and Africa Market Value (USD Million) Forecast by Food Application, 2021 to 2036
- Table 48: Middle East and Africa Market Value (USD Million) Forecast by Sales Channel, 2021 to 2036
List of Figures
- Figure 1: Global Market Pricing Analysis
- Figure 2: Global Market Value (USD Million) Forecast 2021-2036
- Figure 3: Global Market Value Share and BPS Analysis by Acyl Triglyceride Architecture, 2026 and 2036
- Figure 4: Global Market Y-o-Y Growth Comparison by Acyl Triglyceride Architecture, 2026-2036
- Figure 5: Global Market Attractiveness Analysis by Acyl Triglyceride Architecture
- Figure 6: Global Market Value Share and BPS Analysis by Physical Consistency, 2026 and 2036
- Figure 7: Global Market Y-o-Y Growth Comparison by Physical Consistency, 2026-2036
- Figure 8: Global Market Attractiveness Analysis by Physical Consistency
- Figure 9: Global Market Value Share and BPS Analysis by Functional Performance, 2026 and 2036
- Figure 10: Global Market Y-o-Y Growth Comparison by Functional Performance, 2026-2036
- Figure 11: Global Market Attractiveness Analysis by Functional Performance
- Figure 12: Global Market Value Share and BPS Analysis by Food Application, 2026 and 2036
- Figure 13: Global Market Y-o-Y Growth Comparison by Food Application, 2026-2036
- Figure 14: Global Market Attractiveness Analysis by Food Application
- Figure 15: Global Market Value Share and BPS Analysis by Sales Channel, 2026 and 2036
- Figure 16: Global Market Y-o-Y Growth Comparison by Sales Channel, 2026-2036
- Figure 17: Global Market Attractiveness Analysis by Sales Channel
- Figure 18: Global Market Value (USD Million) Share and BPS Analysis by Region, 2026 and 2036
- Figure 19: Global Market Y-o-Y Growth Comparison by Region, 2026-2036
- Figure 20: Global Market Attractiveness Analysis by Region
- Figure 21: North America Market Incremental Dollar Opportunity, 2026-2036
- Figure 22: Latin America Market Incremental Dollar Opportunity, 2026-2036
- Figure 23: Western Europe Market Incremental Dollar Opportunity, 2026-2036
- Figure 24: Eastern Europe Market Incremental Dollar Opportunity, 2026-2036
- Figure 25: East Asia Market Incremental Dollar Opportunity, 2026-2036
- Figure 26: South Asia and Pacific Market Incremental Dollar Opportunity, 2026-2036
- Figure 27: Middle East and Africa Market Incremental Dollar Opportunity, 2026-2036
- Figure 28: North America Market Value Share and BPS Analysis by Country, 2026 and 2036
- Figure 29: North America Market Value Share and BPS Analysis by Acyl Triglyceride Architecture, 2026 and 2036
- Figure 30: North America Market Y-o-Y Growth Comparison by Acyl Triglyceride Architecture, 2026-2036
- Figure 31: North America Market Attractiveness Analysis by Acyl Triglyceride Architecture
- Figure 32: North America Market Value Share and BPS Analysis by Physical Consistency, 2026 and 2036
- Figure 33: North America Market Y-o-Y Growth Comparison by Physical Consistency, 2026-2036
- Figure 34: North America Market Attractiveness Analysis by Physical Consistency
- Figure 35: North America Market Value Share and BPS Analysis by Functional Performance, 2026 and 2036
- Figure 36: North America Market Y-o-Y Growth Comparison by Functional Performance, 2026-2036
- Figure 37: North America Market Attractiveness Analysis by Functional Performance
- Figure 38: North America Market Value Share and BPS Analysis by Food Application, 2026 and 2036
- Figure 39: North America Market Y-o-Y Growth Comparison by Food Application, 2026-2036
- Figure 40: North America Market Attractiveness Analysis by Food Application
- Figure 41: North America Market Value Share and BPS Analysis by Sales Channel, 2026 and 2036
- Figure 42: North America Market Y-o-Y Growth Comparison by Sales Channel, 2026-2036
- Figure 43: North America Market Attractiveness Analysis by Sales Channel
- Figure 44: Latin America Market Value Share and BPS Analysis by Country, 2026 and 2036
- Figure 45: Latin America Market Value Share and BPS Analysis by Acyl Triglyceride Architecture, 2026 and 2036
- Figure 46: Latin America Market Y-o-Y Growth Comparison by Acyl Triglyceride Architecture, 2026-2036
- Figure 47: Latin America Market Attractiveness Analysis by Acyl Triglyceride Architecture
- Figure 48: Latin America Market Value Share and BPS Analysis by Physical Consistency, 2026 and 2036
- Figure 49: Latin America Market Y-o-Y Growth Comparison by Physical Consistency, 2026-2036
- Figure 50: Latin America Market Attractiveness Analysis by Physical Consistency
- Figure 51: Latin America Market Value Share and BPS Analysis by Functional Performance, 2026 and 2036
- Figure 52: Latin America Market Y-o-Y Growth Comparison by Functional Performance, 2026-2036
- Figure 53: Latin America Market Attractiveness Analysis by Functional Performance
- Figure 54: Latin America Market Value Share and BPS Analysis by Food Application, 2026 and 2036
- Figure 55: Latin America Market Y-o-Y Growth Comparison by Food Application, 2026-2036
- Figure 56: Latin America Market Attractiveness Analysis by Food Application
- Figure 57: Latin America Market Value Share and BPS Analysis by Sales Channel, 2026 and 2036
- Figure 58: Latin America Market Y-o-Y Growth Comparison by Sales Channel, 2026-2036
- Figure 59: Latin America Market Attractiveness Analysis by Sales Channel
- Figure 60: Western Europe Market Value Share and BPS Analysis by Country, 2026 and 2036
- Figure 61: Western Europe Market Value Share and BPS Analysis by Acyl Triglyceride Architecture, 2026 and 2036
- Figure 62: Western Europe Market Y-o-Y Growth Comparison by Acyl Triglyceride Architecture, 2026-2036
- Figure 63: Western Europe Market Attractiveness Analysis by Acyl Triglyceride Architecture
- Figure 64: Western Europe Market Value Share and BPS Analysis by Physical Consistency, 2026 and 2036
- Figure 65: Western Europe Market Y-o-Y Growth Comparison by Physical Consistency, 2026-2036
- Figure 66: Western Europe Market Attractiveness Analysis by Physical Consistency
- Figure 67: Western Europe Market Value Share and BPS Analysis by Functional Performance, 2026 and 2036
- Figure 68: Western Europe Market Y-o-Y Growth Comparison by Functional Performance, 2026-2036
- Figure 69: Western Europe Market Attractiveness Analysis by Functional Performance
- Figure 70: Western Europe Market Value Share and BPS Analysis by Food Application, 2026 and 2036
- Figure 71: Western Europe Market Y-o-Y Growth Comparison by Food Application, 2026-2036
- Figure 72: Western Europe Market Attractiveness Analysis by Food Application
- Figure 73: Western Europe Market Value Share and BPS Analysis by Sales Channel, 2026 and 2036
- Figure 74: Western Europe Market Y-o-Y Growth Comparison by Sales Channel, 2026-2036
- Figure 75: Western Europe Market Attractiveness Analysis by Sales Channel
- Figure 76: Eastern Europe Market Value Share and BPS Analysis by Country, 2026 and 2036
- Figure 77: Eastern Europe Market Value Share and BPS Analysis by Acyl Triglyceride Architecture, 2026 and 2036
- Figure 78: Eastern Europe Market Y-o-Y Growth Comparison by Acyl Triglyceride Architecture, 2026-2036
- Figure 79: Eastern Europe Market Attractiveness Analysis by Acyl Triglyceride Architecture
- Figure 80: Eastern Europe Market Value Share and BPS Analysis by Physical Consistency, 2026 and 2036
- Figure 81: Eastern Europe Market Y-o-Y Growth Comparison by Physical Consistency, 2026-2036
- Figure 82: Eastern Europe Market Attractiveness Analysis by Physical Consistency
- Figure 83: Eastern Europe Market Value Share and BPS Analysis by Functional Performance, 2026 and 2036
- Figure 84: Eastern Europe Market Y-o-Y Growth Comparison by Functional Performance, 2026-2036
- Figure 85: Eastern Europe Market Attractiveness Analysis by Functional Performance
- Figure 86: Eastern Europe Market Value Share and BPS Analysis by Food Application, 2026 and 2036
- Figure 87: Eastern Europe Market Y-o-Y Growth Comparison by Food Application, 2026-2036
- Figure 88: Eastern Europe Market Attractiveness Analysis by Food Application
- Figure 89: Eastern Europe Market Value Share and BPS Analysis by Sales Channel, 2026 and 2036
- Figure 90: Eastern Europe Market Y-o-Y Growth Comparison by Sales Channel, 2026-2036
- Figure 91: Eastern Europe Market Attractiveness Analysis by Sales Channel
- Figure 92: East Asia Market Value Share and BPS Analysis by Country, 2026 and 2036
- Figure 93: East Asia Market Value Share and BPS Analysis by Acyl Triglyceride Architecture, 2026 and 2036
- Figure 94: East Asia Market Y-o-Y Growth Comparison by Acyl Triglyceride Architecture, 2026-2036
- Figure 95: East Asia Market Attractiveness Analysis by Acyl Triglyceride Architecture
- Figure 96: East Asia Market Value Share and BPS Analysis by Physical Consistency, 2026 and 2036
- Figure 97: East Asia Market Y-o-Y Growth Comparison by Physical Consistency, 2026-2036
- Figure 98: East Asia Market Attractiveness Analysis by Physical Consistency
- Figure 99: East Asia Market Value Share and BPS Analysis by Functional Performance, 2026 and 2036
- Figure 100: East Asia Market Y-o-Y Growth Comparison by Functional Performance, 2026-2036
- Figure 101: East Asia Market Attractiveness Analysis by Functional Performance
- Figure 102: East Asia Market Value Share and BPS Analysis by Food Application, 2026 and 2036
- Figure 103: East Asia Market Y-o-Y Growth Comparison by Food Application, 2026-2036
- Figure 104: East Asia Market Attractiveness Analysis by Food Application
- Figure 105: East Asia Market Value Share and BPS Analysis by Sales Channel, 2026 and 2036
- Figure 106: East Asia Market Y-o-Y Growth Comparison by Sales Channel, 2026-2036
- Figure 107: East Asia Market Attractiveness Analysis by Sales Channel
- Figure 108: South Asia and Pacific Market Value Share and BPS Analysis by Country, 2026 and 2036
- Figure 109: South Asia and Pacific Market Value Share and BPS Analysis by Acyl Triglyceride Architecture, 2026 and 2036
- Figure 110: South Asia and Pacific Market Y-o-Y Growth Comparison by Acyl Triglyceride Architecture, 2026-2036
- Figure 111: South Asia and Pacific Market Attractiveness Analysis by Acyl Triglyceride Architecture
- Figure 112: South Asia and Pacific Market Value Share and BPS Analysis by Physical Consistency, 2026 and 2036
- Figure 113: South Asia and Pacific Market Y-o-Y Growth Comparison by Physical Consistency, 2026-2036
- Figure 114: South Asia and Pacific Market Attractiveness Analysis by Physical Consistency
- Figure 115: South Asia and Pacific Market Value Share and BPS Analysis by Functional Performance, 2026 and 2036
- Figure 116: South Asia and Pacific Market Y-o-Y Growth Comparison by Functional Performance, 2026-2036
- Figure 117: South Asia and Pacific Market Attractiveness Analysis by Functional Performance
- Figure 118: South Asia and Pacific Market Value Share and BPS Analysis by Food Application, 2026 and 2036
- Figure 119: South Asia and Pacific Market Y-o-Y Growth Comparison by Food Application, 2026-2036
- Figure 120: South Asia and Pacific Market Attractiveness Analysis by Food Application
- Figure 121: South Asia and Pacific Market Value Share and BPS Analysis by Sales Channel, 2026 and 2036
- Figure 122: South Asia and Pacific Market Y-o-Y Growth Comparison by Sales Channel, 2026-2036
- Figure 123: South Asia and Pacific Market Attractiveness Analysis by Sales Channel
- Figure 124: Middle East and Africa Market Value Share and BPS Analysis by Country, 2026 and 2036
- Figure 125: Middle East and Africa Market Value Share and BPS Analysis by Acyl Triglyceride Architecture, 2026 and 2036
- Figure 126: Middle East and Africa Market Y-o-Y Growth Comparison by Acyl Triglyceride Architecture, 2026-2036
- Figure 127: Middle East and Africa Market Attractiveness Analysis by Acyl Triglyceride Architecture
- Figure 128: Middle East and Africa Market Value Share and BPS Analysis by Physical Consistency, 2026 and 2036
- Figure 129: Middle East and Africa Market Y-o-Y Growth Comparison by Physical Consistency, 2026-2036
- Figure 130: Middle East and Africa Market Attractiveness Analysis by Physical Consistency
- Figure 131: Middle East and Africa Market Value Share and BPS Analysis by Functional Performance, 2026 and 2036
- Figure 132: Middle East and Africa Market Y-o-Y Growth Comparison by Functional Performance, 2026-2036
- Figure 133: Middle East and Africa Market Attractiveness Analysis by Functional Performance
- Figure 134: Middle East and Africa Market Value Share and BPS Analysis by Food Application, 2026 and 2036
- Figure 135: Middle East and Africa Market Y-o-Y Growth Comparison by Food Application, 2026-2036
- Figure 136: Middle East and Africa Market Attractiveness Analysis by Food Application
- Figure 137: Middle East and Africa Market Value Share and BPS Analysis by Sales Channel, 2026 and 2036
- Figure 138: Middle East and Africa Market Y-o-Y Growth Comparison by Sales Channel, 2026-2036
- Figure 139: Middle East and Africa Market Attractiveness Analysis by Sales Channel
- Figure 140: Global Market - Tier Structure Analysis
- Figure 141: Global Market - Company Share Analysis
Frequently Asked Questions
How big is the salatrim market in 2026, and what is forecast for 2036?
FMI estimates that the global salatrim market size stood at USD 85.0 million in 2025 and reached USD 87.3 million in 2026. Overall industry valuation is projected to reach USD 115.1 million by 2036 as confectionery and bakery brands reformulate coatings under front-of-pack calorie rules.
What is the CAGR for the salatrim market from 2026 to 2036?
The salatrim market is projected to progress at a 2.8% CAGR from 2026 to 2036, generating USD 27.8 million in incremental market value across low-calorie chocolate and bakery applications.
Which acyl triglyceride architecture segment leads the salatrim market?
Short-Chain Acyl Acetate Propionate Butyrate with Long-Chain Stearate Blends hold 64.5% of acyl architecture demand in 2026 because balanced C2-C4 and C18 esterification delivers 5-kcal-per-gram caloric density with cocoa-butter-like snap.
Which physical consistency segment leads the salatrim market?
Semi-Solid Plastic Vegetable Fat represents 58.7% of physical consistency demand in 2026 as plasticized blocks integrate directly into jacketed confectionery enrobers and bakery mixers.
Which country has a notable growth outlook during the assessment period?
Brazil leads national expansion projections at a 3.5% CAGR through 2036, driven by ANVISA front-of-pack nutrition warning avoidance and domestic soybean stearin refining.
Who are the key players in the market?
dsm-firmenich AG and Archer Daniels Midland Company lead commercial supply with Cargill Incorporated and International Flavors and Fragrances Inc. Kerry Group plc and Ingredion Incorporated also compete with Tate and Lyle plc, Roquette Freres SA, Corbion N.V. and Palsgaard A/S.
Preview the report firsthand - request a free sample
Get SampleGet the brochure for pricing and purchase details.
Get PDF
