Semi-Trailer Market Size and Share Forecast Outlook 2025 to 2035

The Semi-Trailer Market is estimated to be valued at USD 38.7 billion in 2025 and is projected to reach USD 66.8 billion by 2035, registering a compound annual growth rate (CAGR) of 5.6% over the forecast period.
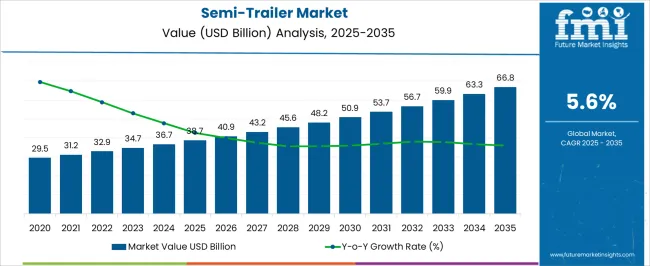
Quick Stats for Semi-Trailer Market

  • Semi-Trailer Market Value (2025): USD 38.7 billion
  • Semi-Trailer Market Forecast Value (2035): USD 66.8 billion
  • Semi-Trailer Market Forecast CAGR: 5.6%
  • Leading Segment in Semi-Trailer Market in 2025: Lowboy (38.5%)
  • Key Growth Regions in Semi-Trailer Market: North America, Asia-Pacific, Europe
  • Top Key Players in Semi-Trailer Market: Qingdao CIMC Special Vehicles Co., Ltd, Fontaine Trailer, Great Dane A Division of Great Dane LLC., Kögel, KRONE Trailer, LAMBERET SAS, Polar Tank Trailer., Schmitz Cargobull., Utility Trailer Manufacturing Company, Wabash National Corporation., HYUNDAI TRANSLEAD
Semi Trailer Market Market Value Analysis

Semi-Trailer Market Key Takeaways

Metric Value
Semi-Trailer Market Estimated Value in (2025 E) USD 38.7 billion
Semi-Trailer Market Forecast Value in (2035 F) USD 66.8 billion
Forecast CAGR (2025 to 2035) 5.6%

Why is the Semi-Trailer Market Growing?

The Semi-Trailer market is expanding steadily, supported by rising global demand for efficient freight transportation across industries such as construction, mining, agriculture, and logistics. Increasing movement of heavy machinery, raw materials, and bulk goods is fueling the adoption of semi-trailers due to their higher payload capacity and cost efficiency compared to other transport modes. Regulatory focus on vehicle safety and road efficiency is also prompting fleet operators to invest in modern trailers with advanced braking, telematics, and load optimization technologies.

Moreover, infrastructure expansion projects and growing international trade are accelerating the need for durable and high-capacity transport equipment. The integration of lightweight materials and aerodynamic designs is improving fuel efficiency, reducing operating costs, and supporting sustainability goals, which is a key priority for logistics providers.

Additionally, digital fleet monitoring and predictive maintenance solutions are enhancing operational reliability and uptime With a strong focus on optimizing transportation efficiency, reducing carbon emissions, and improving asset utilization, the Semi-Trailer market is projected to witness consistent growth, driven by the need for safe, cost-effective, and technologically advanced heavy transport solutions worldwide.

Segmental Analysis

The semi-trailer market is segmented by type, tonnage, number of axles, end-use, and geographic regions. By type, semi-trailer market is divided into Lowboy, Flatbed, Refrigerated, Dry Van, and Others. In terms of tonnage, semi-trailer market is classified into 25 To 50 Tons, <25 Tons, 50 To 100 Tons, and >100 Tons. Based on number of axles, semi-trailer market is segmented into 3 To 4 Axles, <3 Axles, and >4 Axles. By end-use, semi-trailer market is segmented into Heavy Industry, FMCG, Automotive, Logistic, and Healthcare. Regionally, the semi-trailer industry is classified into North America, Latin America, Western Europe, Eastern Europe, Balkan & Baltic Countries, Russia & Belarus, Central Asia, East Asia, South Asia & Pacific, and the Middle East & Africa.
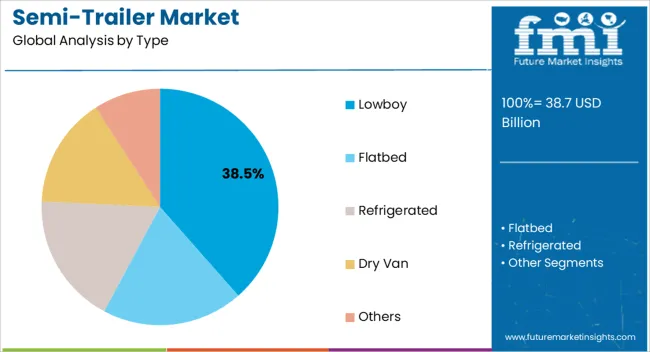
Insights into the Lowboy Type Segment

Semi Trailer Market Analysis By Type

The lowboy type segment is projected to account for 38.5% of the Semi-Trailer market revenue share in 2025, positioning it as the leading trailer type. Growth is being supported by its widespread use in transporting heavy construction machinery, mining equipment, and oversized loads that cannot be carried by standard trailers. The low deck height provides stability and allows for easier loading of tall or bulky equipment while complying with clearance restrictions on highways.

This makes it particularly valuable for industries engaged in infrastructure development, energy projects, and industrial transport. The adaptability of lowboy trailers in carrying loads with varying dimensions adds to their popularity among logistics operators. Strong demand from the construction and heavy equipment industries across emerging markets is also reinforcing segment leadership.

Technological advancements in axle configuration, load distribution systems, and material strength are further improving performance and safety As global infrastructure projects continue to expand, the lowboy segment is expected to maintain its dominant position, supported by its reliability, flexibility, and cost efficiency.
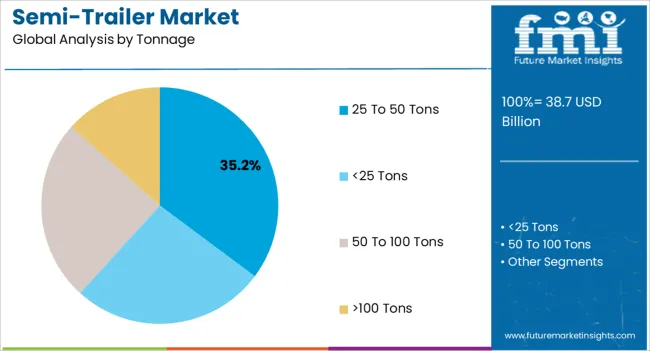
Insights into the 25 to 50 Tons Tonnage Segment

Semi Trailer Market Analysis By Tonnage

The 25 to 50 tons tonnage segment is anticipated to capture 35.2% of the Semi-Trailer market share in 2025, establishing it as the dominant capacity category. This segment’s leadership is being driven by its versatility in transporting medium to heavy cargo across industries such as construction, agriculture, and logistics. Fleet operators prefer this range as it offers an optimal balance between payload capacity and cost efficiency, ensuring profitable operations while maintaining regulatory compliance.

The ability to handle diverse types of loads without requiring specialized permits enhances its appeal, especially for cross-border and regional transport. Increasing industrial output, infrastructure expansion, and growing demand for agricultural products are fueling the need for mid-range tonnage trailers. Moreover, trailers in this capacity segment are benefiting from advancements in lightweight materials and braking technologies, which improve efficiency and safety.

Their adaptability in multiple sectors and cost-effectiveness compared to higher tonnage vehicles make them highly sought after With consistent demand across global industries, the 25 to 50 tons tonnage segment is expected to remain the key contributor to market revenue growth.
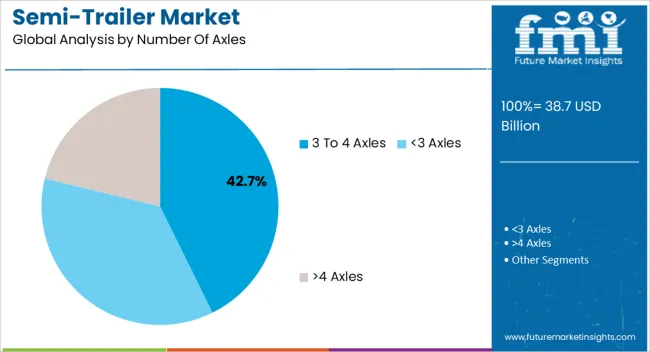
Insights into the 3 to 4 Axles Segment

Semi Trailer Market Analysis By Number Of Axles

The 3 to 4 axles segment is forecasted to hold 42.7% of the Semi-Trailer market revenue share in 2025, positioning it as the leading axle configuration. Growth is being driven by the ability of these trailers to provide an optimal balance between load distribution, maneuverability, and durability. The increased load-bearing capacity compared to lower axle configurations makes them highly suitable for medium to heavy-duty transport requirements across industries.

Operators benefit from reduced wear and tear on individual axles and improved stability, which enhances safety during long-distance transport of heavy goods. Additionally, regulatory frameworks in many regions favor the use of 3 to 4 axle configurations to ensure road safety and compliance with load restrictions. Their versatility in serving diverse applications, from construction and mining to logistics and agriculture, is also a key growth driver.

Advancements in suspension systems, braking technology, and telematics integration are further enhancing performance With rising demand for durable and efficient transport solutions, the 3 to 4 axles segment is expected to continue leading the market, supported by its proven reliability and operational efficiency.

Market Overview

Semi-Trailer Market Snapshot

The surge in demand from numerous industrial sectors such as logistics, construction, retail, automotive, and food and beverages, etc. across the globe is driving the demand for Semi-Trailer.

According to FMI, the Global Semi-Trailer Market is estimated to be valued at US$ 34,738.7 Million in 2025 and is projected to increase at a CAGR of 5.6% in the forecast period from 2025 to 2035.

The semi-trailer is a freight vehicle without a front axle, with most of its weight supported by a tractor unit or a removable front axle and some of its weight partially supported by the semi-trailer itself. Semi-trailers can be relocated to the desired location. Rather than using full trailers, semi-trailers are more frequently used for cargo transportation. Detachable semi-trailers provide more flexibility than entire trailers. Most of owners use semi-trailers to transport both finished goods and raw materials. The semi-trailer incorporates the key trends, including logistics, electrification of vehicles, and autonomous trucks.

Rapid growth is being seen in the utilization of trucks and trailers for cargo transportation. People are more likely to demand the delivery of goods and products as a result of changing lifestyles and urbanization. Delivery to consumers is handled by suppliers, fast-moving consumer goods (FMCG) companies, e-commerce retailers, and suppliers. This has led to a rise in the demand for semi-trailers in the global market.
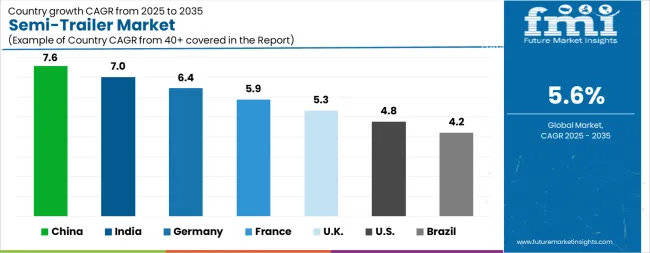
Analysis of Semi-Trailer Market By Key Countries

Semi Trailer Market Cagr Analysis By Country
Country CAGR
China 7.6%
India 7.0%
Germany 6.4%
France 5.9%
UK 5.3%
USA 4.8%
Brazil 4.2%

Country-wise Analysis

The Semi-Trailer Market is expected to register a CAGR of 5.6% during the forecast period, exhibiting varied country level momentum. China leads with the highest CAGR of 7.6%, followed by India at 7.0%. Developed markets such as Germany, France, and the UK continue to expand steadily, while the USA is likely to grow at consistent rates. Brazil posts the lowest CAGR at 4.2%, yet still underscores a broadly positive trajectory for the global Semi-Trailer Market. In 2024, Germany held a dominant revenue in the Western Europe market and is expected to grow with a CAGR of 6.4%. The USA Semi-Trailer Market is estimated to be valued at USD 14.6 billion in 2025 and is anticipated to reach a valuation of USD 23.2 billion by 2035. Sales are projected to rise at a CAGR of 4.8% over the forecast period between 2025 and 2035. While Japan and South Korea markets are estimated to be valued at USD 1.8 billion and USD 995.2 million respectively in 2025.
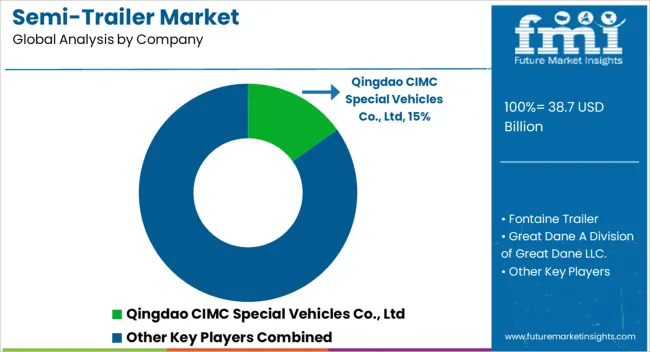
Key Players in the Semi-Trailer Market

Semi Trailer Market Analysis By Company

  • Qingdao CIMC Special Vehicles Co., Ltd
  • Fontaine Trailer
  • Great Dane A Division of Great Dane LLC.
  • Kögel
  • KRONE Trailer
  • LAMBERET SAS
  • Polar Tank Trailer.
  • Schmitz Cargobull.
  • Utility Trailer Manufacturing Company
  • Wabash National Corporation.
  • HYUNDAI TRANSLEAD

Scope of the Report

Item Value
Quantitative Units USD 38.7 Billion
Type Lowboy, Flatbed, Refrigerated, Dry Van, and Others
Tonnage 25 To 50 Tons, <25 Tons, 50 To 100 Tons, and >100 Tons
Number Of Axles 3 To 4 Axles, <3 Axles, and >4 Axles
End-Use Heavy Industry, FMCG, Automotive, Logistic, and Healthcare
Regions Covered North America, Europe, Asia-Pacific, Latin America, Middle East & Africa
Country Covered United States, Canada, Germany, France, United Kingdom, China, Japan, India, Brazil, South Africa
Key Companies Profiled Qingdao CIMC Special Vehicles Co., Ltd, Fontaine Trailer, Great Dane A Division of Great Dane LLC., Kögel, KRONE Trailer, LAMBERET SAS, Polar Tank Trailer., Schmitz Cargobull., Utility Trailer Manufacturing Company, Wabash National Corporation., and HYUNDAI TRANSLEAD

Semi-Trailer Market by Segments

Type:

  • Lowboy
  • Flatbed
  • Refrigerated
  • Dry Van
  • Others

Tonnage:

  • 25 To 50 Tons
  • <25 Tons
  • 50 To 100 Tons
  • >100 Tons

Number Of Axles:

  • 3 To 4 Axles
  • <3 Axles
  • >4 Axles

End-Use:

  • Heavy Industry
  • FMCG
  • Automotive
  • Logistic
  • Healthcare

Region:

  • North America
    • USA
    • Canada
    • Mexico
  • Latin America
    • Brazil
    • Chile
    • Rest of Latin America
  • Western Europe
    • Germany
    • UK
    • Italy
    • Spain
    • France
    • Nordic
    • BENELUX
    • Rest of Western Europe
  • Eastern Europe
    • Russia
    • Poland
    • Hungary
    • Balkan & Baltic
    • Rest of Eastern Europe
  • East Asia
    • China
    • Japan
    • South Korea
  • South Asia and Pacific
    • India
    • ASEAN
    • Australia & New Zealand
    • Rest of South Asia and Pacific
  • Middle East & Africa
    • Kingdom of Saudi Arabia
    • Other GCC Countries
    • Turkiye
    • South Africa
    • Other African Union
    • Rest of Middle East & Africa

Frequently Asked Questions

How big is the semi-trailer market in 2025?

The global semi-trailer market is estimated to be valued at USD 38.7 billion in 2025.

What will be the size of semi-trailer market in 2035?

The market size for the semi-trailer market is projected to reach USD 66.8 billion by 2035.

How much will be the semi-trailer market growth between 2025 and 2035?

The semi-trailer market is expected to grow at a 5.6% CAGR between 2025 and 2035.

What are the key product types in the semi-trailer market?

The key product types in semi-trailer market are lowboy, flatbed, refrigerated, dry van and others.

Which tonnage segment to contribute significant share in the semi-trailer market in 2025?

In terms of tonnage, 25 to 50 tons segment to command 35.2% share in the semi-trailer market in 2025.

Table of Content

  1. Executive Summary
    • Global Market Outlook
    • Demand-side Trends
    • Supply-side Trends
    • Technology Roadmap Analysis
    • Analysis and Recommendations
  2. Market Overview
    • Market Coverage / Taxonomy
    • Market Definition / Scope / Limitations
  3. Market Background
    • Market Dynamics
      • Drivers
      • Restraints
      • Opportunity
      • Trends
    • Scenario Forecast
      • Demand in Optimistic Scenario
      • Demand in Likely Scenario
      • Demand in Conservative Scenario
    • Opportunity Map Analysis
    • Product Life Cycle Analysis
    • Supply Chain Analysis
    • Investment Feasibility Matrix
    • Value Chain Analysis
    • PESTLE and Porter’s Analysis
    • Regulatory Landscape
    • Regional Parent Market Outlook
    • Production and Consumption Statistics
    • Import and Export Statistics
  4. Global Market Analysis 2020 to 2024 and Forecast, 2025 to 2035
    • Historical Market Size Value (USD Million) Analysis, 2020 to 2024
    • Current and Future Market Size Value (USD Million) Projections, 2025 to 2035
      • Y-o-Y Growth Trend Analysis
      • Absolute $ Opportunity Analysis
  5. Global Market Pricing Analysis 2020 to 2024 and Forecast 2025 to 2035
  6. Global Market Analysis 2020 to 2024 and Forecast 2025 to 2035, By Type
    • Introduction / Key Findings
    • Historical Market Size Value (USD Million) Analysis By Type , 2020 to 2024
    • Current and Future Market Size Value (USD Million) Analysis and Forecast By Type , 2025 to 2035
      • Lowboy
      • Flatbed
      • Refrigerated
      • Dry Van
      • Others
    • Y-o-Y Growth Trend Analysis By Type , 2020 to 2024
    • Absolute $ Opportunity Analysis By Type , 2025 to 2035
  7. Global Market Analysis 2020 to 2024 and Forecast 2025 to 2035, By Tonnage
    • Introduction / Key Findings
    • Historical Market Size Value (USD Million) Analysis By Tonnage, 2020 to 2024
    • Current and Future Market Size Value (USD Million) Analysis and Forecast By Tonnage, 2025 to 2035
      • 25 To 50 Tons
      • <25 Tons
      • 50 To 100 Tons
      • >100 Tons
    • Y-o-Y Growth Trend Analysis By Tonnage, 2020 to 2024
    • Absolute $ Opportunity Analysis By Tonnage, 2025 to 2035
  8. Global Market Analysis 2020 to 2024 and Forecast 2025 to 2035, By Number Of Axles
    • Introduction / Key Findings
    • Historical Market Size Value (USD Million) Analysis By Number Of Axles, 2020 to 2024
    • Current and Future Market Size Value (USD Million) Analysis and Forecast By Number Of Axles, 2025 to 2035
      • 3 To 4 Axles
      • <3 Axles
      • >4 Axles
    • Y-o-Y Growth Trend Analysis By Number Of Axles, 2020 to 2024
    • Absolute $ Opportunity Analysis By Number Of Axles, 2025 to 2035
  9. Global Market Analysis 2020 to 2024 and Forecast 2025 to 2035, By End-Use
    • Introduction / Key Findings
    • Historical Market Size Value (USD Million) Analysis By End-Use, 2020 to 2024
    • Current and Future Market Size Value (USD Million) Analysis and Forecast By End-Use, 2025 to 2035
      • Heavy Industry
      • FMCG
      • Automotive
      • Logistic
      • Healthcare
    • Y-o-Y Growth Trend Analysis By End-Use, 2020 to 2024
    • Absolute $ Opportunity Analysis By End-Use, 2025 to 2035
  10. Global Market Analysis 2020 to 2024 and Forecast 2025 to 2035, By Region
    • Introduction
    • Historical Market Size Value (USD Million) Analysis By Region, 2020 to 2024
    • Current Market Size Value (USD Million) Analysis and Forecast By Region, 2025 to 2035
      • North America
      • Latin America
      • Western Europe
      • Eastern Europe
      • East Asia
      • South Asia and Pacific
      • Middle East & Africa
    • Market Attractiveness Analysis By Region
  11. North America Market Analysis 2020 to 2024 and Forecast 2025 to 2035, By Country
    • Historical Market Size Value (USD Million) Trend Analysis By Market Taxonomy, 2020 to 2024
    • Market Size Value (USD Million) Forecast By Market Taxonomy, 2025 to 2035
      • By Country
        • USA
        • Canada
        • Mexico
      • By Type
      • By Tonnage
      • By Number Of Axles
      • By End-Use
    • Market Attractiveness Analysis
      • By Country
      • By Type
      • By Tonnage
      • By Number Of Axles
      • By End-Use
    • Key Takeaways
  12. Latin America Market Analysis 2020 to 2024 and Forecast 2025 to 2035, By Country
    • Historical Market Size Value (USD Million) Trend Analysis By Market Taxonomy, 2020 to 2024
    • Market Size Value (USD Million) Forecast By Market Taxonomy, 2025 to 2035
      • By Country
        • Brazil
        • Chile
        • Rest of Latin America
      • By Type
      • By Tonnage
      • By Number Of Axles
      • By End-Use
    • Market Attractiveness Analysis
      • By Country
      • By Type
      • By Tonnage
      • By Number Of Axles
      • By End-Use
    • Key Takeaways
  13. Western Europe Market Analysis 2020 to 2024 and Forecast 2025 to 2035, By Country
    • Historical Market Size Value (USD Million) Trend Analysis By Market Taxonomy, 2020 to 2024
    • Market Size Value (USD Million) Forecast By Market Taxonomy, 2025 to 2035
      • By Country
        • Germany
        • UK
        • Italy
        • Spain
        • France
        • Nordic
        • BENELUX
        • Rest of Western Europe
      • By Type
      • By Tonnage
      • By Number Of Axles
      • By End-Use
    • Market Attractiveness Analysis
      • By Country
      • By Type
      • By Tonnage
      • By Number Of Axles
      • By End-Use
    • Key Takeaways
  14. Eastern Europe Market Analysis 2020 to 2024 and Forecast 2025 to 2035, By Country
    • Historical Market Size Value (USD Million) Trend Analysis By Market Taxonomy, 2020 to 2024
    • Market Size Value (USD Million) Forecast By Market Taxonomy, 2025 to 2035
      • By Country
        • Russia
        • Poland
        • Hungary
        • Balkan & Baltic
        • Rest of Eastern Europe
      • By Type
      • By Tonnage
      • By Number Of Axles
      • By End-Use
    • Market Attractiveness Analysis
      • By Country
      • By Type
      • By Tonnage
      • By Number Of Axles
      • By End-Use
    • Key Takeaways
  15. East Asia Market Analysis 2020 to 2024 and Forecast 2025 to 2035, By Country
    • Historical Market Size Value (USD Million) Trend Analysis By Market Taxonomy, 2020 to 2024
    • Market Size Value (USD Million) Forecast By Market Taxonomy, 2025 to 2035
      • By Country
        • China
        • Japan
        • South Korea
      • By Type
      • By Tonnage
      • By Number Of Axles
      • By End-Use
    • Market Attractiveness Analysis
      • By Country
      • By Type
      • By Tonnage
      • By Number Of Axles
      • By End-Use
    • Key Takeaways
  16. South Asia and Pacific Market Analysis 2020 to 2024 and Forecast 2025 to 2035, By Country
    • Historical Market Size Value (USD Million) Trend Analysis By Market Taxonomy, 2020 to 2024
    • Market Size Value (USD Million) Forecast By Market Taxonomy, 2025 to 2035
      • By Country
        • India
        • ASEAN
        • Australia & New Zealand
        • Rest of South Asia and Pacific
      • By Type
      • By Tonnage
      • By Number Of Axles
      • By End-Use
    • Market Attractiveness Analysis
      • By Country
      • By Type
      • By Tonnage
      • By Number Of Axles
      • By End-Use
    • Key Takeaways
  17. Middle East & Africa Market Analysis 2020 to 2024 and Forecast 2025 to 2035, By Country
    • Historical Market Size Value (USD Million) Trend Analysis By Market Taxonomy, 2020 to 2024
    • Market Size Value (USD Million) Forecast By Market Taxonomy, 2025 to 2035
      • By Country
        • Kingdom of Saudi Arabia
        • Other GCC Countries
        • Turkiye
        • South Africa
        • Other African Union
        • Rest of Middle East & Africa
      • By Type
      • By Tonnage
      • By Number Of Axles
      • By End-Use
    • Market Attractiveness Analysis
      • By Country
      • By Type
      • By Tonnage
      • By Number Of Axles
      • By End-Use
    • Key Takeaways
  18. Key Countries Market Analysis
    • USA
      • Pricing Analysis
      • Market Share Analysis, 2024
        • By Type
        • By Tonnage
        • By Number Of Axles
        • By End-Use
    • Canada
      • Pricing Analysis
      • Market Share Analysis, 2024
        • By Type
        • By Tonnage
        • By Number Of Axles
        • By End-Use
    • Mexico
      • Pricing Analysis
      • Market Share Analysis, 2024
        • By Type
        • By Tonnage
        • By Number Of Axles
        • By End-Use
    • Brazil
      • Pricing Analysis
      • Market Share Analysis, 2024
        • By Type
        • By Tonnage
        • By Number Of Axles
        • By End-Use
    • Chile
      • Pricing Analysis
      • Market Share Analysis, 2024
        • By Type
        • By Tonnage
        • By Number Of Axles
        • By End-Use
    • Germany
      • Pricing Analysis
      • Market Share Analysis, 2024
        • By Type
        • By Tonnage
        • By Number Of Axles
        • By End-Use
    • UK
      • Pricing Analysis
      • Market Share Analysis, 2024
        • By Type
        • By Tonnage
        • By Number Of Axles
        • By End-Use
    • Italy
      • Pricing Analysis
      • Market Share Analysis, 2024
        • By Type
        • By Tonnage
        • By Number Of Axles
        • By End-Use
    • Spain
      • Pricing Analysis
      • Market Share Analysis, 2024
        • By Type
        • By Tonnage
        • By Number Of Axles
        • By End-Use
    • France
      • Pricing Analysis
      • Market Share Analysis, 2024
        • By Type
        • By Tonnage
        • By Number Of Axles
        • By End-Use
    • India
      • Pricing Analysis
      • Market Share Analysis, 2024
        • By Type
        • By Tonnage
        • By Number Of Axles
        • By End-Use
    • ASEAN
      • Pricing Analysis
      • Market Share Analysis, 2024
        • By Type
        • By Tonnage
        • By Number Of Axles
        • By End-Use
    • Australia & New Zealand
      • Pricing Analysis
      • Market Share Analysis, 2024
        • By Type
        • By Tonnage
        • By Number Of Axles
        • By End-Use
    • China
      • Pricing Analysis
      • Market Share Analysis, 2024
        • By Type
        • By Tonnage
        • By Number Of Axles
        • By End-Use
    • Japan
      • Pricing Analysis
      • Market Share Analysis, 2024
        • By Type
        • By Tonnage
        • By Number Of Axles
        • By End-Use
    • South Korea
      • Pricing Analysis
      • Market Share Analysis, 2024
        • By Type
        • By Tonnage
        • By Number Of Axles
        • By End-Use
    • Russia
      • Pricing Analysis
      • Market Share Analysis, 2024
        • By Type
        • By Tonnage
        • By Number Of Axles
        • By End-Use
    • Poland
      • Pricing Analysis
      • Market Share Analysis, 2024
        • By Type
        • By Tonnage
        • By Number Of Axles
        • By End-Use
    • Hungary
      • Pricing Analysis
      • Market Share Analysis, 2024
        • By Type
        • By Tonnage
        • By Number Of Axles
        • By End-Use
    • Kingdom of Saudi Arabia
      • Pricing Analysis
      • Market Share Analysis, 2024
        • By Type
        • By Tonnage
        • By Number Of Axles
        • By End-Use
    • Turkiye
      • Pricing Analysis
      • Market Share Analysis, 2024
        • By Type
        • By Tonnage
        • By Number Of Axles
        • By End-Use
    • South Africa
      • Pricing Analysis
      • Market Share Analysis, 2024
        • By Type
        • By Tonnage
        • By Number Of Axles
        • By End-Use
  19. Market Structure Analysis
    • Competition Dashboard
    • Competition Benchmarking
    • Market Share Analysis of Top Players
      • By Regional
      • By Type
      • By Tonnage
      • By Number Of Axles
      • By End-Use
  20. Competition Analysis
    • Competition Deep Dive
      • Qingdao CIMC Special Vehicles Co., Ltd
        • Overview
        • Product Portfolio
        • Profitability by Market Segments (Product/Age /Sales Channel/Region)
        • Sales Footprint
        • Strategy Overview
          • Marketing Strategy
          • Product Strategy
          • Channel Strategy
      • Fontaine Trailer
      • Great Dane A Division of Great Dane LLC.
      • Kögel
      • KRONE Trailer
      • LAMBERET SAS
      • Polar Tank Trailer.
      • Schmitz Cargobull.
      • Utility Trailer Manufacturing Company
      • Wabash National Corporation.
      • HYUNDAI TRANSLEAD
  21. Assumptions & Acronyms Used
  22. Research Methodology

List of Tables

  • Table 1: Global Market Value (USD Million) Forecast by Region, 2020-2035
  • Table 2: Global Market Value (USD Million) Forecast by Type , 2020-2035
  • Table 3: Global Market Value (USD Million) Forecast by Tonnage, 2020-2035
  • Table 4: Global Market Value (USD Million) Forecast by Number Of Axles, 2020-2035
  • Table 5: Global Market Value (USD Million) Forecast by End-Use, 2020-2035
  • Table 6: North America Market Value (USD Million) Forecast by Country, 2020-2035
  • Table 7: North America Market Value (USD Million) Forecast by Type , 2020-2035
  • Table 8: North America Market Value (USD Million) Forecast by Tonnage, 2020-2035
  • Table 9: North America Market Value (USD Million) Forecast by Number Of Axles, 2020-2035
  • Table 10: North America Market Value (USD Million) Forecast by End-Use, 2020-2035
  • Table 11: Latin America Market Value (USD Million) Forecast by Country, 2020-2035
  • Table 12: Latin America Market Value (USD Million) Forecast by Type , 2020-2035
  • Table 13: Latin America Market Value (USD Million) Forecast by Tonnage, 2020-2035
  • Table 14: Latin America Market Value (USD Million) Forecast by Number Of Axles, 2020-2035
  • Table 15: Latin America Market Value (USD Million) Forecast by End-Use, 2020-2035
  • Table 16: Western Europe Market Value (USD Million) Forecast by Country, 2020-2035
  • Table 17: Western Europe Market Value (USD Million) Forecast by Type , 2020-2035
  • Table 18: Western Europe Market Value (USD Million) Forecast by Tonnage, 2020-2035
  • Table 19: Western Europe Market Value (USD Million) Forecast by Number Of Axles, 2020-2035
  • Table 20: Western Europe Market Value (USD Million) Forecast by End-Use, 2020-2035
  • Table 21: Eastern Europe Market Value (USD Million) Forecast by Country, 2020-2035
  • Table 22: Eastern Europe Market Value (USD Million) Forecast by Type , 2020-2035
  • Table 23: Eastern Europe Market Value (USD Million) Forecast by Tonnage, 2020-2035
  • Table 24: Eastern Europe Market Value (USD Million) Forecast by Number Of Axles, 2020-2035
  • Table 25: Eastern Europe Market Value (USD Million) Forecast by End-Use, 2020-2035
  • Table 26: East Asia Market Value (USD Million) Forecast by Country, 2020-2035
  • Table 27: East Asia Market Value (USD Million) Forecast by Type , 2020-2035
  • Table 28: East Asia Market Value (USD Million) Forecast by Tonnage, 2020-2035
  • Table 29: East Asia Market Value (USD Million) Forecast by Number Of Axles, 2020-2035
  • Table 30: East Asia Market Value (USD Million) Forecast by End-Use, 2020-2035
  • Table 31: South Asia and Pacific Market Value (USD Million) Forecast by Country, 2020-2035
  • Table 32: South Asia and Pacific Market Value (USD Million) Forecast by Type , 2020-2035
  • Table 33: South Asia and Pacific Market Value (USD Million) Forecast by Tonnage, 2020-2035
  • Table 34: South Asia and Pacific Market Value (USD Million) Forecast by Number Of Axles, 2020-2035
  • Table 35: South Asia and Pacific Market Value (USD Million) Forecast by End-Use, 2020-2035
  • Table 36: Middle East & Africa Market Value (USD Million) Forecast by Country, 2020-2035
  • Table 37: Middle East & Africa Market Value (USD Million) Forecast by Type , 2020-2035
  • Table 38: Middle East & Africa Market Value (USD Million) Forecast by Tonnage, 2020-2035
  • Table 39: Middle East & Africa Market Value (USD Million) Forecast by Number Of Axles, 2020-2035
  • Table 40: Middle East & Africa Market Value (USD Million) Forecast by End-Use, 2020-2035

List of Figures

  • Figure 1: Global Market Pricing Analysis
  • Figure 2: Global Market Value (USD Million) Forecast 2020-2035
  • Figure 3: Global Market Value Share and BPS Analysis by Type , 2025 and 2035
  • Figure 4: Global Market Y-o-Y Growth Comparison by Type , 2025-2035
  • Figure 5: Global Market Attractiveness Analysis by Type
  • Figure 6: Global Market Value Share and BPS Analysis by Tonnage, 2025 and 2035
  • Figure 7: Global Market Y-o-Y Growth Comparison by Tonnage, 2025-2035
  • Figure 8: Global Market Attractiveness Analysis by Tonnage
  • Figure 9: Global Market Value Share and BPS Analysis by Number Of Axles, 2025 and 2035
  • Figure 10: Global Market Y-o-Y Growth Comparison by Number Of Axles, 2025-2035
  • Figure 11: Global Market Attractiveness Analysis by Number Of Axles
  • Figure 12: Global Market Value Share and BPS Analysis by End-Use, 2025 and 2035
  • Figure 13: Global Market Y-o-Y Growth Comparison by End-Use, 2025-2035
  • Figure 14: Global Market Attractiveness Analysis by End-Use
  • Figure 15: Global Market Value (USD Million) Share and BPS Analysis by Region, 2025 and 2035
  • Figure 16: Global Market Y-o-Y Growth Comparison by Region, 2025-2035
  • Figure 17: Global Market Attractiveness Analysis by Region
  • Figure 18: North America Market Incremental Dollar Opportunity, 2025-2035
  • Figure 19: Latin America Market Incremental Dollar Opportunity, 2025-2035
  • Figure 20: Western Europe Market Incremental Dollar Opportunity, 2025-2035
  • Figure 21: Eastern Europe Market Incremental Dollar Opportunity, 2025-2035
  • Figure 22: East Asia Market Incremental Dollar Opportunity, 2025-2035
  • Figure 23: South Asia and Pacific Market Incremental Dollar Opportunity, 2025-2035
  • Figure 24: Middle East & Africa Market Incremental Dollar Opportunity, 2025-2035
  • Figure 25: North America Market Value Share and BPS Analysis by Country, 2025 and 2035
  • Figure 26: North America Market Value Share and BPS Analysis by Type , 2025 and 2035
  • Figure 27: North America Market Y-o-Y Growth Comparison by Type , 2025-2035
  • Figure 28: North America Market Attractiveness Analysis by Type
  • Figure 29: North America Market Value Share and BPS Analysis by Tonnage, 2025 and 2035
  • Figure 30: North America Market Y-o-Y Growth Comparison by Tonnage, 2025-2035
  • Figure 31: North America Market Attractiveness Analysis by Tonnage
  • Figure 32: North America Market Value Share and BPS Analysis by Number Of Axles, 2025 and 2035
  • Figure 33: North America Market Y-o-Y Growth Comparison by Number Of Axles, 2025-2035
  • Figure 34: North America Market Attractiveness Analysis by Number Of Axles
  • Figure 35: North America Market Value Share and BPS Analysis by End-Use, 2025 and 2035
  • Figure 36: North America Market Y-o-Y Growth Comparison by End-Use, 2025-2035
  • Figure 37: North America Market Attractiveness Analysis by End-Use
  • Figure 38: Latin America Market Value Share and BPS Analysis by Country, 2025 and 2035
  • Figure 39: Latin America Market Value Share and BPS Analysis by Type , 2025 and 2035
  • Figure 40: Latin America Market Y-o-Y Growth Comparison by Type , 2025-2035
  • Figure 41: Latin America Market Attractiveness Analysis by Type
  • Figure 42: Latin America Market Value Share and BPS Analysis by Tonnage, 2025 and 2035
  • Figure 43: Latin America Market Y-o-Y Growth Comparison by Tonnage, 2025-2035
  • Figure 44: Latin America Market Attractiveness Analysis by Tonnage
  • Figure 45: Latin America Market Value Share and BPS Analysis by Number Of Axles, 2025 and 2035
  • Figure 46: Latin America Market Y-o-Y Growth Comparison by Number Of Axles, 2025-2035
  • Figure 47: Latin America Market Attractiveness Analysis by Number Of Axles
  • Figure 48: Latin America Market Value Share and BPS Analysis by End-Use, 2025 and 2035
  • Figure 49: Latin America Market Y-o-Y Growth Comparison by End-Use, 2025-2035
  • Figure 50: Latin America Market Attractiveness Analysis by End-Use
  • Figure 51: Western Europe Market Value Share and BPS Analysis by Country, 2025 and 2035
  • Figure 52: Western Europe Market Value Share and BPS Analysis by Type , 2025 and 2035
  • Figure 53: Western Europe Market Y-o-Y Growth Comparison by Type , 2025-2035
  • Figure 54: Western Europe Market Attractiveness Analysis by Type
  • Figure 55: Western Europe Market Value Share and BPS Analysis by Tonnage, 2025 and 2035
  • Figure 56: Western Europe Market Y-o-Y Growth Comparison by Tonnage, 2025-2035
  • Figure 57: Western Europe Market Attractiveness Analysis by Tonnage
  • Figure 58: Western Europe Market Value Share and BPS Analysis by Number Of Axles, 2025 and 2035
  • Figure 59: Western Europe Market Y-o-Y Growth Comparison by Number Of Axles, 2025-2035
  • Figure 60: Western Europe Market Attractiveness Analysis by Number Of Axles
  • Figure 61: Western Europe Market Value Share and BPS Analysis by End-Use, 2025 and 2035
  • Figure 62: Western Europe Market Y-o-Y Growth Comparison by End-Use, 2025-2035
  • Figure 63: Western Europe Market Attractiveness Analysis by End-Use
  • Figure 64: Eastern Europe Market Value Share and BPS Analysis by Country, 2025 and 2035
  • Figure 65: Eastern Europe Market Value Share and BPS Analysis by Type , 2025 and 2035
  • Figure 66: Eastern Europe Market Y-o-Y Growth Comparison by Type , 2025-2035
  • Figure 67: Eastern Europe Market Attractiveness Analysis by Type
  • Figure 68: Eastern Europe Market Value Share and BPS Analysis by Tonnage, 2025 and 2035
  • Figure 69: Eastern Europe Market Y-o-Y Growth Comparison by Tonnage, 2025-2035
  • Figure 70: Eastern Europe Market Attractiveness Analysis by Tonnage
  • Figure 71: Eastern Europe Market Value Share and BPS Analysis by Number Of Axles, 2025 and 2035
  • Figure 72: Eastern Europe Market Y-o-Y Growth Comparison by Number Of Axles, 2025-2035
  • Figure 73: Eastern Europe Market Attractiveness Analysis by Number Of Axles
  • Figure 74: Eastern Europe Market Value Share and BPS Analysis by End-Use, 2025 and 2035
  • Figure 75: Eastern Europe Market Y-o-Y Growth Comparison by End-Use, 2025-2035
  • Figure 76: Eastern Europe Market Attractiveness Analysis by End-Use
  • Figure 77: East Asia Market Value Share and BPS Analysis by Country, 2025 and 2035
  • Figure 78: East Asia Market Value Share and BPS Analysis by Type , 2025 and 2035
  • Figure 79: East Asia Market Y-o-Y Growth Comparison by Type , 2025-2035
  • Figure 80: East Asia Market Attractiveness Analysis by Type
  • Figure 81: East Asia Market Value Share and BPS Analysis by Tonnage, 2025 and 2035
  • Figure 82: East Asia Market Y-o-Y Growth Comparison by Tonnage, 2025-2035
  • Figure 83: East Asia Market Attractiveness Analysis by Tonnage
  • Figure 84: East Asia Market Value Share and BPS Analysis by Number Of Axles, 2025 and 2035
  • Figure 85: East Asia Market Y-o-Y Growth Comparison by Number Of Axles, 2025-2035
  • Figure 86: East Asia Market Attractiveness Analysis by Number Of Axles
  • Figure 87: East Asia Market Value Share and BPS Analysis by End-Use, 2025 and 2035
  • Figure 88: East Asia Market Y-o-Y Growth Comparison by End-Use, 2025-2035
  • Figure 89: East Asia Market Attractiveness Analysis by End-Use
  • Figure 90: South Asia and Pacific Market Value Share and BPS Analysis by Country, 2025 and 2035
  • Figure 91: South Asia and Pacific Market Value Share and BPS Analysis by Type , 2025 and 2035
  • Figure 92: South Asia and Pacific Market Y-o-Y Growth Comparison by Type , 2025-2035
  • Figure 93: South Asia and Pacific Market Attractiveness Analysis by Type
  • Figure 94: South Asia and Pacific Market Value Share and BPS Analysis by Tonnage, 2025 and 2035
  • Figure 95: South Asia and Pacific Market Y-o-Y Growth Comparison by Tonnage, 2025-2035
  • Figure 96: South Asia and Pacific Market Attractiveness Analysis by Tonnage
  • Figure 97: South Asia and Pacific Market Value Share and BPS Analysis by Number Of Axles, 2025 and 2035
  • Figure 98: South Asia and Pacific Market Y-o-Y Growth Comparison by Number Of Axles, 2025-2035
  • Figure 99: South Asia and Pacific Market Attractiveness Analysis by Number Of Axles
  • Figure 100: South Asia and Pacific Market Value Share and BPS Analysis by End-Use, 2025 and 2035
  • Figure 101: South Asia and Pacific Market Y-o-Y Growth Comparison by End-Use, 2025-2035
  • Figure 102: South Asia and Pacific Market Attractiveness Analysis by End-Use
  • Figure 103: Middle East & Africa Market Value Share and BPS Analysis by Country, 2025 and 2035
  • Figure 104: Middle East & Africa Market Value Share and BPS Analysis by Type , 2025 and 2035
  • Figure 105: Middle East & Africa Market Y-o-Y Growth Comparison by Type , 2025-2035
  • Figure 106: Middle East & Africa Market Attractiveness Analysis by Type
  • Figure 107: Middle East & Africa Market Value Share and BPS Analysis by Tonnage, 2025 and 2035
  • Figure 108: Middle East & Africa Market Y-o-Y Growth Comparison by Tonnage, 2025-2035
  • Figure 109: Middle East & Africa Market Attractiveness Analysis by Tonnage
  • Figure 110: Middle East & Africa Market Value Share and BPS Analysis by Number Of Axles, 2025 and 2035
  • Figure 111: Middle East & Africa Market Y-o-Y Growth Comparison by Number Of Axles, 2025-2035
  • Figure 112: Middle East & Africa Market Attractiveness Analysis by Number Of Axles
  • Figure 113: Middle East & Africa Market Value Share and BPS Analysis by End-Use, 2025 and 2035
  • Figure 114: Middle East & Africa Market Y-o-Y Growth Comparison by End-Use, 2025-2035
  • Figure 115: Middle East & Africa Market Attractiveness Analysis by End-Use
  • Figure 116: Global Market - Tier Structure Analysis
  • Figure 117: Global Market - Company Share Analysis
Dashboard
Dashboard
Dashboard
Dashboard
Dashboard
Dashboard

Full Research Suite comprises of:

Market outlook & trends analysis

Market outlook & trends analysis

Interviews & case studies

Interviews & case studies

Strategic recommendations

Strategic recommendations

Vendor profiles & capabilities analysis

Vendor profiles & capabilities analysis

5-year forecasts

5-year forecasts

8 regions and 60+ country-level data splits

8 regions and 60+ country-level data splits

Market segment data splits

Market segment data splits

12 months of continuous data updates

12 months of continuous data updates

DELIVERED AS:

PDF EXCEL ONLINE

Full Research Suite


$5000

$7500

$10000

Buy Report Now
Future Market Insights

Semi-Trailer Market

Chat With MaRIA

Chat With

MaRIA

Hi There, I am MaRIA, Your Market Research Intelligence Assistant. How may I help you?