Sialendoscopes Market
Market Insights on Sialendoscopes covering sales outlook, demand forecast & up-to-date key trends
Sialendoscopes Market by Type, End User & Region - Forecast 2022 – 2032
Sialendoscopes Market Outlook (2022-2032)
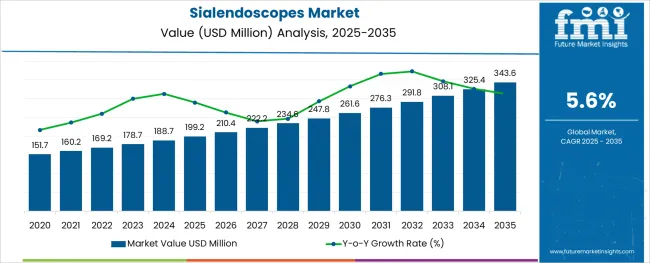
[333 Pages Report] The Sialendoscopes market is expected to improve with a CAGR of 5.6% during 2022-2032. The overall market demand is generating total revenue of US$ 169.2 Million in 2022 is predicted to reach US$ 307.9 Million by the end of year 2032.
Sialendoscopes are used in a wide range of endoscopic, minimally invasive operations. Growing cases of digestive system ailments owing to unhealthy lifestyle and eating habits, have boosted the demand for sialendoscopes in a number of countries.
The demand Sialendoscopes in the market has surged in recent years as it offers an exciting minimally invasive alternative to a standard open surgical procedure to treat salivary duct disorders. It also offers a variety of advantages to the patient, including minimal recovery time, no incision or subsequent scarring, minimized potential for nerve damage, preservation of the salivary gland and initial arrival to a normal diet resulting in good sialendoscope market opportunities in private healthcare network as well.
Attributes |
Details |
Market Value in 2022 |
US$ 169.2 Million |
Market Value in 2032 |
US$ 307.9 Million |
Market CAGR (2022-2032) |
5.6% |
Let us know your requirement to get
100% FREE customization
What is the Future of the Sialendoscopes Market?
What are the Key Drivers Propelling Growth of the Sialendoscopes Market?
Flexible sigmoidoscopy procedures allows the doctors to check for salivary gland diseases, infection, swelling and others more easily than other traditional devices. Moreover, the sialendoscopes market share is strengthening as this wire direct enables the doctor to pick up and keep up ductal access all through the procedure and augments proficiency.
Sialendoscopy is a minimally invasive procedure that allows establishment of a solid diagnosis of most pathologies like sialolithiasis with stone baskets, micro burrs. Endoscopic treatment by sialendoscopes offer a minimally invasive alternative to open salivary gland surgery with integrated injection and working channels. There are other a few reasons that might be suggested for the strengthening of sialendoscopes market future trends, with a standout amongst the most widely recognized reasons being the need to screen for sialolithiasis and salivary duct diseases.
The procedures related to Sialendoscopy can be without surgery or anaesthesia, even in children. It also helps in treating salivary gland tumours without disfiguring and nerve injury that are anticipated to drive the sialendoscopes market share in the coming days.
Notwithstanding, the cost of the endoscopy procedure and lack of medical healthcare professionals or experts in the developing nations is expected to hamper the sialendoscope market growth over the conjecture time frame. Uncertainty by the government regulations, reimbursement coverage and accuracy or technology infancy is also a concern for adoption of sialendoscopes to a certain extent.
Is the Sialendoscopes Market Returning to Normalcy in Current Times?
While the global sialendoscopes market was doing fairly with a growth rate of 4.9% during the period coverings the years 2016 to 2020, the outbreak of Covid-19 pandemic briefly halted the development. The sialendoscopes market survey report offers three market recovery scenarios as businesses reorganise their resources to sustain after the pandemic's constraints. Disruptions to the supply chain, customer confidence, economic effect, and general industry recovery considerations are taken into account for this new market research report on sialendoscopes adoption trends.
However, significant growth can be expected during the forecast period, which is likely to put the market on tracks with advancements.
Which is the Best Performing Segment for the Sialendoscopes Market?
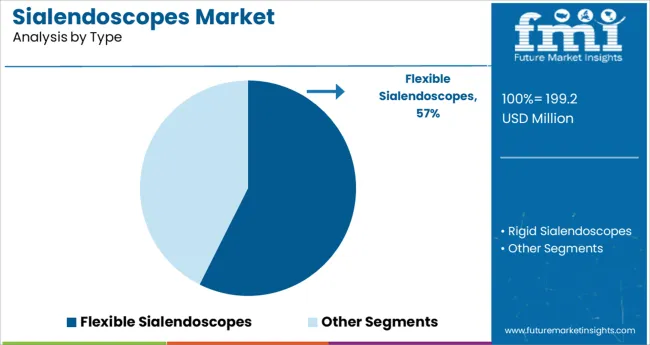
Flexible sialendoscopes are the best performing market segment and dominate the global sialendoscope market size. Though rigid sialendoscopes have found some new applications with the discovery of new diagnostic methods, its contribution for the sialendoscopes market growth has remained minimal over the years.
How different Geographical Regions are performing in the Sialendoscopes Market?
What is the Performance of Sialendoscopes Market in the North America Region?
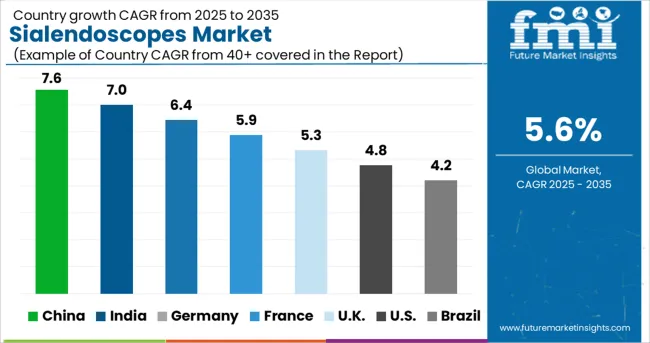
The FMI sialendoscopes market analysis report suggests the US and Canada together contribute for nearly 37.4% to the overall market.
North America is the largest shareholder for the global sialendoscopes market in terms of revenue generated every year. By virtue of its robust healthcare infrastructure in the region the sales of sialendoscopes have remained very high in comparison to other geographical regions.
What is the Performance of Sialendoscopes Market in the Asia Pacific Region?
As evident from the sialendoscope market statistics, the Asia Pacific economies together contribute for almost 29.2% of the global market.
Asian countries (mainly China and India) are having more growth opportunities for market players in the forecast period. In Asia pacific regions medical device industries are starting to make partnerships, now improving the efficiency of the healthcare delivery system as well as workforce in other sectors too.
Western Europe region has a huge market owing to large number of manufacturers, technological advancements with increasing ageing population and growing brand awareness about the upcoming devices and technology.
How is the Start-up Ecosystem in the Sialendoscopes Market?
The healthcare devices market is heightening 15-20% per year. The global market for sialendoscopes is expanding as a result of ongoing invention. Start-ups are launching new revolutionary medical devices designed to improve patient outcomes and shorten hospital stays.
Newly launched sialendoscopes are now forming a demanding market by minimizing future expenses and by neglecting unnecessary hospitalizations. Most Sialendoscopes firms those come up in the post-pandemic environment are operating with a haste and consumer focus. They are also attempting to reduce costs along different links in the value chain so that items can be sold for a profit.
Find your sweet spots for generating winning opportunities in this market.
Talk to AnalystCompetitive Landscape for the Sialendoscopes Market
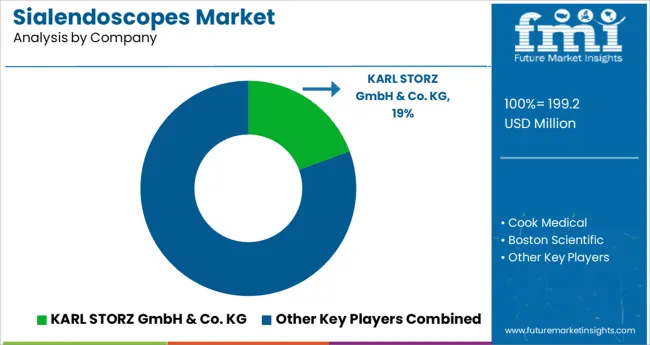
Globally, the manufacturers of sialendoscopes have implemented the strategies such as merger and acquisition, and technology advancements such as use of latest design and technology. Additionally, in the long run, production modernization and expansion together with ongoing innovation and customer-focused initiatives will continue to be crucial success drivers for the sialendoscopes market key players.
Key Players of the Sialendoscopes Market
- KARL STORZ GmbH & Co. KG
- Cook Medical
- Others

An unified Market Research Subscription Platform, built for today’s disparate research needs.
Scope of Report
Attributes |
Details |
Growth Rate |
CAGR of 5.6% from 2022 to 2032. |
Base year for Estimation |
2022 |
Historical Data Available for |
2016-2021 |
Forecast Period |
2022-2032 |
Quantitative Units |
Revenue in US$ Million and CAGR from 2022-2032 |
Report Coverage |
Revenue Forecast, Volume Forecast, Company Ranking, Competitive Landscape, Growth Factors, Trends and Pricing Analysis. |
Segments Covered |
|
Regions Covered |
|
Key Countries Profiled |
|
Key Companies Profiled |
|
Customization |
Available upon Request |
Key Segments in the Sialendoscopes Market
By Type:
- Flexible Sialendoscopes
- Rigid Sialendoscopes
By End User:
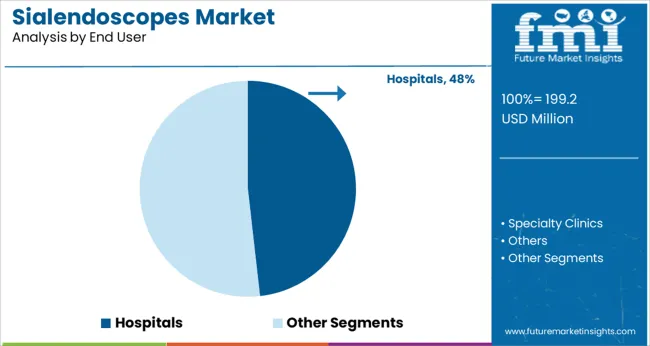
- Hospitals
- Specialty Clinics
- Others
- Others
By Region:
- North America
- Latin America
- Asia Pacific
- MEA
- Europe
Frequently Asked Questions
The Sialendoscopes market is anticipated to register a CAGR of 5.6% through 2032.
The Sialendoscopes market is estimated around US$ 169.2 Billion in 2022.
The Sialendoscopes market is poised to be valued at US$ 307.9 Billion by 2032.
The North America region captures a share of 37.4% of the Sialendoscopes market.
Table of Content
1. Executive Summary
1.1. Global Market Outlook
1.2. Demand-side Trends
1.3. Supply-side Trends
1.4. Technology Roadmap Analysis
1.5. Analysis and Recommendations
2. Market Overview
2.1. Market Coverage / Taxonomy
2.2. Market Definition / Scope / Limitations
3. Market Background
3.1. Market Dynamics
3.1.1. Drivers
3.1.2. Restraints
3.1.3. Opportunity
3.1.4. Trends
3.2. Scenario Forecast
3.2.1. Demand in Optimistic Scenario
3.2.2. Demand in Likely Scenario
3.2.3. Demand in Conservative Scenario
3.3. Opportunity Map Analysis
3.4. Investment Feasibility Matrix
3.5. PESTLE and Porter’s Analysis
3.6. Regulatory Landscape
3.6.1. By Key Regions
3.6.2. By Key Countries
3.7. Regional Parent Market Outlook
4. Global Sialendoscopes Market Analysis 2017-2021 and Forecast, 2022-2032
4.1. Historical Market Size Value (US$ Mn) Analysis, 2017-2021
4.2. Current and Future Market Size Value (US$ Mn) Projections, 2022-2032
4.2.1. Y-o-Y Growth Trend Analysis
4.2.2. Absolute $ Opportunity Analysis
5. Global Sialendoscopes Market Analysis 2017-2021 and Forecast 2022-2032, By Product
5.1. Introduction / Key Findings
5.2. Historical Market Size Value (US$ Mn) Analysis By Product, 2017-2021
5.3. Current and Future Market Size Value (US$ Mn) Analysis and Forecast By Product, 2022-2032
5.3.1. Flexible Sialendoscopes
5.3.2. Rigid Sialendoscopes
5.4. Y-o-Y Growth Trend Analysis By Product, 2017-2021
5.5. Absolute $ Opportunity Analysis By Product, 2022-2032
6. Global Sialendoscopes Market Analysis 2017-2021 and Forecast 2022-2032, By End User
6.1. Introduction / Key Findings
6.2. Historical Market Size Value (US$ Mn) Analysis By End User, 2017-2021
6.3. Current and Future Market Size Value (US$ Mn) Analysis and Forecast By End User, 2022-2032
6.3.1. Hospitals
6.3.2. Specialty Clinics
6.3.3. Others
6.4. Y-o-Y Growth Trend Analysis By End User, 2017-2021
6.5. Absolute $ Opportunity Analysis By End User, 2022-2032
7. Global Sialendoscopes Market Analysis 2017-2021 and Forecast 2022-2032, By Region
7.1. Introduction
7.2. Historical Market Size Value (US$ Mn) Analysis By Region, 2017-2021
7.3. Current Market Size Value (US$ Mn) Analysis and Forecast By Region, 2022-2032
7.3.1. North America
7.3.2. Latin America
7.3.3. Europe
7.3.4. Asia Pacific
7.3.5. MEA
7.4. Market Attractiveness Analysis By Region
8. North America Sialendoscopes Market Analysis 2017-2021 and Forecast 2022-2032, By Country
8.1. Historical Market Size Value (US$ Mn) Trend Analysis By Market Taxonomy, 2017-2021
8.2. Market Size Value (US$ Mn) Forecast By Market Taxonomy, 2022-2032
8.2.1. By Country
8.2.1.1. U.S.
8.2.1.2. Canada
8.2.2. By Product
8.2.3. By End User
8.3. Market Attractiveness Analysis
8.3.1. By Country
8.3.2. By Product
8.3.3. By End User
8.4. Key Takeaways
9. Latin America Sialendoscopes Market Analysis 2017-2021 and Forecast 2022-2032, By Country
9.1. Historical Market Size Value (US$ Mn) Trend Analysis By Market Taxonomy, 2017-2021
9.2. Market Size Value (US$ Mn) Forecast By Market Taxonomy, 2022-2032
9.2.1. By Country
9.2.1.1. Brazil
9.2.1.2. Mexico
9.2.1.3. Rest of Latin America
9.2.2. By Product
9.2.3. By End User
9.3. Market Attractiveness Analysis
9.3.1. By Country
9.3.2. By Product
9.3.3. By End User
9.4. Key Takeaways
10. Europe Sialendoscopes Market Analysis 2017-2021 and Forecast 2022-2032, By Country
10.1. Historical Market Size Value (US$ Mn) Trend Analysis By Market Taxonomy, 2017-2021
10.2. Market Size Value (US$ Mn) Forecast By Market Taxonomy, 2022-2032
10.2.1. By Country
10.2.1.1. Germany
10.2.1.2. U.K.
10.2.1.3. France
10.2.1.4. Spain
10.2.1.5. Italy
10.2.1.6. Rest of Europe
10.2.2. By Product
10.2.3. By End User
10.3. Market Attractiveness Analysis
10.3.1. By Country
10.3.2. By Product
10.3.3. By End User
10.4. Key Takeaways
11. Asia Pacific Sialendoscopes Market Analysis 2017-2021 and Forecast 2022-2032, By Country
11.1. Historical Market Size Value (US$ Mn) Trend Analysis By Market Taxonomy, 2017-2021
11.2. Market Size Value (US$ Mn) Forecast By Market Taxonomy, 2022-2032
11.2.1. By Country
11.2.1.1. China
11.2.1.2. Japan
11.2.1.3. South Korea
11.2.1.4. Malaysia
11.2.1.5. Singapore
11.2.1.6. Australia
11.2.1.7. Rest of Asia Pacific
11.2.2. By Product
11.2.3. By End User
11.3. Market Attractiveness Analysis
11.3.1. By Country
11.3.2. By Product
11.3.3. By End User
11.4. Key Takeaways
12. MEA Sialendoscopes Market Analysis 2017-2021 and Forecast 2022-2032, By Country
12.1. Historical Market Size Value (US$ Mn) Trend Analysis By Market Taxonomy, 2017-2021
12.2. Market Size Value (US$ Mn) Forecast By Market Taxonomy, 2022-2032
12.2.1. By Country
12.2.1.1. GCC Countries
12.2.1.2. South Africa
12.2.1.3. Israel
12.2.1.4. Rest of MEA
12.2.2. By Product
12.2.3. By End User
12.3. Market Attractiveness Analysis
12.3.1. By Country
12.3.2. By Product
12.3.3. By End User
12.4. Key Takeaways
13. Key Countries Sialendoscopes Market Analysis
13.1. U.K.
13.1.1. Pricing Analysis
13.1.2. Market Share Analysis, 2021
13.1.2.1. By Product
13.1.2.2. By End User
13.2. Canada
13.2.1. Pricing Analysis
13.2.2. Market Share Analysis, 2021
13.2.2.1. By Product
13.2.2.2. By End User
13.3. Brazil
13.3.1. Pricing Analysis
13.3.2. Market Share Analysis, 2021
13.3.2.1. By Product
13.3.2.2. By End User
13.4. Mexico
13.4.1. Pricing Analysis
13.4.2. Market Share Analysis, 2021
13.4.2.1. By Product
13.4.2.2. By End User
13.5. Rest of Latin America
13.5.1. Pricing Analysis
13.5.2. Market Share Analysis, 2021
13.5.2.1. By Product
13.5.2.2. By End User
13.6. Germany
13.6.1. Pricing Analysis
13.6.2. Market Share Analysis, 2021
13.6.2.1. By Product
13.6.2.2. By End User
13.7. U.K.
13.7.1. Pricing Analysis
13.7.2. Market Share Analysis, 2021
13.7.2.1. By Product
13.7.2.2. By End User
13.8. France
13.8.1. Pricing Analysis
13.8.2. Market Share Analysis, 2021
13.8.2.1. By Product
13.8.2.2. By End User
13.9. Spain
13.9.1. Pricing Analysis
13.9.2. Market Share Analysis, 2021
13.9.2.1. By Product
13.9.2.2. By End User
13.10. Italy
13.10.1. Pricing Analysis
13.10.2. Market Share Analysis, 2021
13.10.2.1. By Product
13.10.2.2. By End User
13.11. Rest of Europe
13.11.1. Pricing Analysis
13.11.2. Market Share Analysis, 2021
13.11.2.1. By Product
13.11.2.2. By End User
13.12. China
13.12.1. Pricing Analysis
13.12.2. Market Share Analysis, 2021
13.12.2.1. By Product
13.12.2.2. By End User
13.13. Japan
13.13.1. Pricing Analysis
13.13.2. Market Share Analysis, 2021
13.13.2.1. By Product
13.13.2.2. By End User
13.14. South Korea
13.14.1. Pricing Analysis
13.14.2. Market Share Analysis, 2021
13.14.2.1. By Product
13.14.2.2. By End User
13.15. Malaysia
13.15.1. Pricing Analysis
13.15.2. Market Share Analysis, 2021
13.15.2.1. By Product
13.15.2.2. By End User
13.16. Singapore
13.16.1. Pricing Analysis
13.16.2. Market Share Analysis, 2021
13.16.2.1. By Product
13.16.2.2. By End User
13.17. Australia
13.17.1. Pricing Analysis
13.17.2. Market Share Analysis, 2021
13.17.2.1. By Product
13.17.2.2. By End User
13.18. Rest of Asia Pacific
13.18.1. Pricing Analysis
13.18.2. Market Share Analysis, 2021
13.18.2.1. By Product
13.18.2.2. By End User
13.19. GCC Countries
13.19.1. Pricing Analysis
13.19.2. Market Share Analysis, 2021
13.19.2.1. By Product
13.19.2.2. By End User
13.20. South Africa
13.20.1. Pricing Analysis
13.20.2. Market Share Analysis, 2021
13.20.2.1. By Product
13.20.2.2. By End User
13.21. Israel
13.21.1. Pricing Analysis
13.21.2. Market Share Analysis, 2021
13.21.2.1. By Product
13.21.2.2. By End User
13.22. Rest of MEA
13.22.1. Pricing Analysis
13.22.2. Market Share Analysis, 2021
13.22.2.1. By Product
13.22.2.2. By End User
14. Market Structure Analysis
14.1. Competition Dashboard
14.2. Competition Benchmarking
14.3. Market Share Analysis of Top Players
14.3.1. By Regional
14.3.2. By Product
14.3.3. By End User
15. Competition Analysis
15.1. Competition Deep Dive
15.1.1. KARL STORZ GmbH & Co. KG
15.1.1.1. Overview
15.1.1.2. Product Portfolio
15.1.1.3. Profitability by Market Segments
15.1.1.4. Sales Footprint
15.1.1.5. Strategy Overview
15.1.1.5.1. Marketing Strategy
15.1.2. Cook Medical
15.1.2.1. Overview
15.1.2.2. Product Portfolio
15.1.2.3. Profitability by Market Segments
15.1.2.4. Sales Footprint
15.1.2.5. Strategy Overview
15.1.2.5.1. Marketing Strategy
15.1.3. ANAVARA
15.1.3.1. Overview
15.1.3.2. Product Portfolio
15.1.3.3. Profitability by Market Segments
15.1.3.4. Sales Footprint
15.1.3.5. Strategy Overview
15.1.3.5.1. Marketing Strategy
15.1.4. Avante
15.1.4.1. Overview
15.1.4.2. Product Portfolio
15.1.4.3. Profitability by Market Segments
15.1.4.4. Sales Footprint
15.1.4.5. Strategy Overview
15.1.4.5.1. Marketing Strategy
15.1.5. SAMCO Medical
15.1.5.1. Overview
15.1.5.2. Product Portfolio
15.1.5.3. Profitability by Market Segments
15.1.5.4. Sales Footprint
15.1.5.5. Strategy Overview
15.1.5.5.1. Marketing Strategy
15.1.6. JOHNS HOPKINS
15.1.6.1. Overview
15.1.6.2. Product Portfolio
15.1.6.3. Profitability by Market Segments
15.1.6.4. Sales Footprint
15.1.6.5. Strategy Overview
15.1.6.5.1. Marketing Strategy
15.1.7. Richard Wolf
15.1.7.1. Overview
15.1.7.2. Product Portfolio
15.1.7.3. Profitability by Market Segments
15.1.7.4. Sales Footprint
15.1.7.5. Strategy Overview
15.1.7.5.1. Marketing Strategy
15.1.8. PolyDiagnost
15.1.8.1. Overview
15.1.8.2. Product Portfolio
15.1.8.3. Profitability by Market Segments
15.1.8.4. Sales Footprint
15.1.8.5. Strategy Overview
15.1.8.5.1. Marketing Strategy
15.1.9. Spiggle & Theis
15.1.9.1. Overview
15.1.9.2. Product Portfolio
15.1.9.3. Profitability by Market Segments
15.1.9.4. Sales Footprint
15.1.9.5. Strategy Overview
15.1.9.5.1. Marketing Strategy
15.1.10. Boston scientific
15.1.10.1. Overview
15.1.10.2. Product Portfolio
15.1.10.3. Profitability by Market Segments
15.1.10.4. Sales Footprint
15.1.10.5. Strategy Overview
15.1.10.5.1. Marketing Strategy
16. Assumptions & Acronyms Used
17. Research Methodology
Let us know your requirement to get
100% FREE customization
List of Tables
Table 1: Global Sialendoscopes Market Value (US$ Mn) Forecast by Region, 2017-2032
Table 2: Global Sialendoscopes Market Value (US$ Mn) Forecast by Product, 2017-2032
Table 3: Global Sialendoscopes Market Value (US$ Mn) Forecast by End User, 2017-2032
Table 4: North America Sialendoscopes Market Value (US$ Mn) Forecast by Country, 2017-2032
Table 5: North America Sialendoscopes Market Value (US$ Mn) Forecast by Product, 2017-2032
Table 6: North America Sialendoscopes Market Value (US$ Mn) Forecast by End User, 2017-2032
Table 7: Latin America Sialendoscopes Market Value (US$ Mn) Forecast by Country, 2017-2032
Table 8: Latin America Sialendoscopes Market Value (US$ Mn) Forecast by Product, 2017-2032
Table 9: Latin America Sialendoscopes Market Value (US$ Mn) Forecast by End User, 2017-2032
Table 10: Europe Sialendoscopes Market Value (US$ Mn) Forecast by Country, 2017-2032
Table 11: Europe Sialendoscopes Market Value (US$ Mn) Forecast by Product, 2017-2032
Table 12: Europe Sialendoscopes Market Value (US$ Mn) Forecast by End User, 2017-2032
Table 13: Asia Pacific Sialendoscopes Market Value (US$ Mn) Forecast by Country, 2017-2032
Table 14: Asia Pacific Sialendoscopes Market Value (US$ Mn) Forecast by Product, 2017-2032
Table 15: Asia Pacific Sialendoscopes Market Value (US$ Mn) Forecast by End User, 2017-2032
Table 16: MEA Sialendoscopes Market Value (US$ Mn) Forecast by Country, 2017-2032
Table 17: MEA Sialendoscopes Market Value (US$ Mn) Forecast by Product, 2017-2032
Table 18: MEA Sialendoscopes Market Value (US$ Mn) Forecast by End User, 2017-2032
Find your sweet spots for generating winning opportunities in this market.
Talk to AnalystList of Charts
Figure 1: Global Sialendoscopes Market Value (US$ Mn) by Product, 2022-2032
Figure 2: Global Sialendoscopes Market Value (US$ Mn) by End User, 2022-2032
Figure 3: Global Sialendoscopes Market Value (US$ Mn) by Region, 2022-2032
Figure 4: Global Sialendoscopes Market Value (US$ Mn) Analysis by Region, 2017-2032
Figure 5: Global Sialendoscopes Market Value Share (%) and BPS Analysis by Region, 2022-2032
Figure 6: Global Sialendoscopes Market Y-o-Y Growth (%) Projections by Region, 2022-2032
Figure 7: Global Sialendoscopes Market Value (US$ Mn) Analysis by Product, 2017-2032
Figure 8: Global Sialendoscopes Market Value Share (%) and BPS Analysis by Product, 2022-2032
Figure 9: Global Sialendoscopes Market Y-o-Y Growth (%) Projections by Product, 2022-2032
Figure 10: Global Sialendoscopes Market Value (US$ Mn) Analysis by End User, 2017-2032
Figure 11: Global Sialendoscopes Market Value Share (%) and BPS Analysis by End User, 2022-2032
Figure 12: Global Sialendoscopes Market Y-o-Y Growth (%) Projections by End User, 2022-2032
Figure 13: Global Sialendoscopes Market Attractiveness by Product, 2022-2032
Figure 14: Global Sialendoscopes Market Attractiveness by End User, 2022-2032
Figure 15: Global Sialendoscopes Market Attractiveness by Region, 2022-2032
Figure 16: North America Sialendoscopes Market Value (US$ Mn) by Product, 2022-2032
Figure 17: North America Sialendoscopes Market Value (US$ Mn) by End User, 2022-2032
Figure 18: North America Sialendoscopes Market Value (US$ Mn) by Country, 2022-2032
Figure 19: North America Sialendoscopes Market Value (US$ Mn) Analysis by Country, 2017-2032
Figure 20: North America Sialendoscopes Market Value Share (%) and BPS Analysis by Country, 2022-2032
Figure 21: North America Sialendoscopes Market Y-o-Y Growth (%) Projections by Country, 2022-2032
Figure 22: North America Sialendoscopes Market Value (US$ Mn) Analysis by Product, 2017-2032
Figure 23: North America Sialendoscopes Market Value Share (%) and BPS Analysis by Product, 2022-2032
Figure 24: North America Sialendoscopes Market Y-o-Y Growth (%) Projections by Product, 2022-2032
Figure 25: North America Sialendoscopes Market Value (US$ Mn) Analysis by End User, 2017-2032
Figure 26: North America Sialendoscopes Market Value Share (%) and BPS Analysis by End User, 2022-2032
Figure 27: North America Sialendoscopes Market Y-o-Y Growth (%) Projections by End User, 2022-2032
Figure 28: North America Sialendoscopes Market Attractiveness by Product, 2022-2032
Figure 29: North America Sialendoscopes Market Attractiveness by End User, 2022-2032
Figure 30: North America Sialendoscopes Market Attractiveness by Country, 2022-2032
Figure 31: Latin America Sialendoscopes Market Value (US$ Mn) by Product, 2022-2032
Figure 32: Latin America Sialendoscopes Market Value (US$ Mn) by End User, 2022-2032
Figure 33: Latin America Sialendoscopes Market Value (US$ Mn) by Country, 2022-2032
Figure 34: Latin America Sialendoscopes Market Value (US$ Mn) Analysis by Country, 2017-2032
Figure 35: Latin America Sialendoscopes Market Value Share (%) and BPS Analysis by Country, 2022-2032
Figure 36: Latin America Sialendoscopes Market Y-o-Y Growth (%) Projections by Country, 2022-2032
Figure 37: Latin America Sialendoscopes Market Value (US$ Mn) Analysis by Product, 2017-2032
Figure 38: Latin America Sialendoscopes Market Value Share (%) and BPS Analysis by Product, 2022-2032
Figure 39: Latin America Sialendoscopes Market Y-o-Y Growth (%) Projections by Product, 2022-2032
Figure 40: Latin America Sialendoscopes Market Value (US$ Mn) Analysis by End User, 2017-2032
Figure 41: Latin America Sialendoscopes Market Value Share (%) and BPS Analysis by End User, 2022-2032
Figure 42: Latin America Sialendoscopes Market Y-o-Y Growth (%) Projections by End User, 2022-2032
Figure 43: Latin America Sialendoscopes Market Attractiveness by Product, 2022-2032
Figure 44: Latin America Sialendoscopes Market Attractiveness by End User, 2022-2032
Figure 45: Latin America Sialendoscopes Market Attractiveness by Country, 2022-2032
Figure 46: Europe Sialendoscopes Market Value (US$ Mn) by Product, 2022-2032
Figure 47: Europe Sialendoscopes Market Value (US$ Mn) by End User, 2022-2032
Figure 48: Europe Sialendoscopes Market Value (US$ Mn) by Country, 2022-2032
Figure 49: Europe Sialendoscopes Market Value (US$ Mn) Analysis by Country, 2017-2032
Figure 50: Europe Sialendoscopes Market Value Share (%) and BPS Analysis by Country, 2022-2032
Figure 51: Europe Sialendoscopes Market Y-o-Y Growth (%) Projections by Country, 2022-2032
Figure 52: Europe Sialendoscopes Market Value (US$ Mn) Analysis by Product, 2017-2032
Figure 53: Europe Sialendoscopes Market Value Share (%) and BPS Analysis by Product, 2022-2032
Figure 54: Europe Sialendoscopes Market Y-o-Y Growth (%) Projections by Product, 2022-2032
Figure 55: Europe Sialendoscopes Market Value (US$ Mn) Analysis by End User, 2017-2032
Figure 56: Europe Sialendoscopes Market Value Share (%) and BPS Analysis by End User, 2022-2032
Figure 57: Europe Sialendoscopes Market Y-o-Y Growth (%) Projections by End User, 2022-2032
Figure 58: Europe Sialendoscopes Market Attractiveness by Product, 2022-2032
Figure 59: Europe Sialendoscopes Market Attractiveness by End User, 2022-2032
Figure 60: Europe Sialendoscopes Market Attractiveness by Country, 2022-2032
Figure 61: Asia Pacific Sialendoscopes Market Value (US$ Mn) by Product, 2022-2032
Figure 62: Asia Pacific Sialendoscopes Market Value (US$ Mn) by End User, 2022-2032
Figure 63: Asia Pacific Sialendoscopes Market Value (US$ Mn) by Country, 2022-2032
Figure 64: Asia Pacific Sialendoscopes Market Value (US$ Mn) Analysis by Country, 2017-2032
Figure 65: Asia Pacific Sialendoscopes Market Value Share (%) and BPS Analysis by Country, 2022-2032
Figure 66: Asia Pacific Sialendoscopes Market Y-o-Y Growth (%) Projections by Country, 2022-2032
Figure 67: Asia Pacific Sialendoscopes Market Value (US$ Mn) Analysis by Product, 2017-2032
Figure 68: Asia Pacific Sialendoscopes Market Value Share (%) and BPS Analysis by Product, 2022-2032
Figure 69: Asia Pacific Sialendoscopes Market Y-o-Y Growth (%) Projections by Product, 2022-2032
Figure 70: Asia Pacific Sialendoscopes Market Value (US$ Mn) Analysis by End User, 2017-2032
Figure 71: Asia Pacific Sialendoscopes Market Value Share (%) and BPS Analysis by End User, 2022-2032
Figure 72: Asia Pacific Sialendoscopes Market Y-o-Y Growth (%) Projections by End User, 2022-2032
Figure 73: Asia Pacific Sialendoscopes Market Attractiveness by Product, 2022-2032
Figure 74: Asia Pacific Sialendoscopes Market Attractiveness by End User, 2022-2032
Figure 75: Asia Pacific Sialendoscopes Market Attractiveness by Country, 2022-2032
Figure 76: MEA Sialendoscopes Market Value (US$ Mn) by Product, 2022-2032
Figure 77: MEA Sialendoscopes Market Value (US$ Mn) by End User, 2022-2032
Figure 78: MEA Sialendoscopes Market Value (US$ Mn) by Country, 2022-2032
Figure 79: MEA Sialendoscopes Market Value (US$ Mn) Analysis by Country, 2017-2032
Figure 80: MEA Sialendoscopes Market Value Share (%) and BPS Analysis by Country, 2022-2032
Figure 81: MEA Sialendoscopes Market Y-o-Y Growth (%) Projections by Country, 2022-2032
Figure 82: MEA Sialendoscopes Market Value (US$ Mn) Analysis by Product, 2017-2032
Figure 83: MEA Sialendoscopes Market Value Share (%) and BPS Analysis by Product, 2022-2032
Figure 84: MEA Sialendoscopes Market Y-o-Y Growth (%) Projections by Product, 2022-2032
Figure 85: MEA Sialendoscopes Market Value (US$ Mn) Analysis by End User, 2017-2032
Figure 86: MEA Sialendoscopes Market Value Share (%) and BPS Analysis by End User, 2022-2032
Figure 87: MEA Sialendoscopes Market Y-o-Y Growth (%) Projections by End User, 2022-2032
Figure 88: MEA Sialendoscopes Market Attractiveness by Product, 2022-2032
Figure 89: MEA Sialendoscopes Market Attractiveness by End User, 2022-2032
Figure 90: MEA Sialendoscopes Market Attractiveness by Country, 2022-2032
Need specific information?
Request CustomizationExplore Healthcare Insights
View Reports