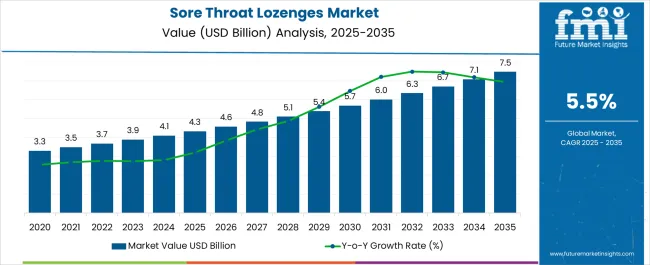
The global sore throat lozenges market is estimated to be valued at USD 4.4 billion in 2024. The market is expected to expand at a CAGR rate of 5.6% and reach a valuation of ~USD 7.5 billion by 2034.
Data Points | Market Insights |
---|---|
Sore Throat Lozenges Market Value, 2023 | USD 4.1 billion |
Estimated Market Value 2024 | USD 4.4 billion |
Projected Market Value 2034 | USD 7.5 billion |
Valued-based CAGR (2024 to 2034) | 5.6% |
Market Share of Top 5 Countries | 57.1% |
Around the world, the common cold and cough are very frequent. Consequently, there is a constant need for therapies and medications to treat it. This fuels the demand for throat lozenges often referred to as cough sweets, cough drops, cachous, or troches, which are small, medicinal pills that are frequently used as the first line of treatment against the common cold and flu.
The thin, moist mucosa that lines the throat is susceptible to invasion by bacteria and viruses. This causes inflammation, which manifests as redness, swelling, and increased secretions. The demand for lozenges is increasing for treatment of infection as they contain active components, such as antiseptics, painkillers, menthol, eucalyptus oil, cough suppressants like dextromethorphan, and calming substances.
The sale of sore throat lozenges market expanded at a CAGR of 4.9% during the historical period, owing to a rise in over-the-counter (OTC) medications, especially for common cold and flu remedies.
Attribute | Details |
---|---|
HCAGR (2019 to 2023) | 4.9% |
The market for sore throat lozenges is expected to rise over the forecast period. This is because of the increase in demand for these decongestants due to increasing cases of nasal and throat infections, especially during seasonal changes. Children are at higher risk of acquiring infections, and they prefer these lozenges over any other second line of treatments available.
Additionally, throat lozenges are used as the initial course of treatment for sore throats, colds, and flu. Moreover, among all flu strains, the common cold is the one that individuals tend to cure at home rather than constantly seeking medical attention. This is one of the reasons for the growth of the market for sore throat lozenges. The global market for sore throat lozenges is anticipated to exhibit a CAGR of 5.6% during the forecast period.
The aging population's decreased immunity can increase the frequency of catching colds and other diseases with sore throats as a symptom. This is expected to generate opportunities in the market. More throat decongestants in the form of lozenges, which quickly relieve symptoms, are highly recommended.
Since ancient times, lozenges have been used to treat throat infections. To improve the effectiveness of the throat lozenge's activities, a small amount of heroin and morphine are also added. The newest addition to the decongestant medications for sore throat is zinc lozenges. In underdeveloped nations, zinc deficiency is common. Within 48 hours of the onset of symptoms, zinc lozenges are commonly given every 2 to 3 hours to treat the common cold.
Sore throat lozenges provide momentary or symptomatic relief to patients suffering from extreme pain caused by severe infection. Moreover, continuous advancements and new product announcements enriched with natural herbs and components are projected to support growth in the market. Accessibility is a significant aspect that can propel the market's expansion. Almost all neighborhood pharmacies and local drug stores sell these throat decongestants over the counter. Due to this, the industry is expected to grow at a profit in the upcoming years.
The sore throat lozenges market is expected to show attractive growth over the coming years. The global throat lozenges industry is quite saturated due to the presence of several local and international businesses offering wide varieties of cough and cold relief products in the market. While some organizations have implemented strategic approaches like acquisition and strategic alliance for market expansion, the majority of businesses are concentrating on affordable treatment. These throat lozenges must be taken several times during the day to provide temporary comfort.
Menthol-containing lozenges may make the situation worse rather than better, depending on how they are made. Additionally, it may occasionally trigger hypersensitivity reactions in those who are allergic to the content. It may also lead to irritable larynx syndrome. Some studies indicate that these OTC first-line drugs, which just provide symptomatic relief, may even make the situation worse; as a result, they should only be taken cautiously and when necessary.
Country/Region | CAGR (2024 to 2034) |
---|---|
United Kingdom | 5.4% |
Germany | 5.2% |
Japan | 4.6% |
China | 6.6% |
Due to the numerous awareness campaigns aimed at reducing infectious diseases in the area as well as the existence of several big throat lozenge manufacturers, the market is expected to grow at a CAGR of 5.4% over the forecast period. The country’s cold climate promotes the growth of bacteria that cause throat infections and also boosts the market there.
The region’s high proportion of elderly people and the effects of the cold climate drive the expansion of the market in Japan. The market in Japan is expected to grow at a CAGR of 4.6% during the forecast period.
Germany accounted for around 27.4% of Europe’s market in 2023. The market is Germany in expected to grow at a CAGR of 5.2% through 2034. Factors such increased number of top pharmaceutical manufacturers in Germany account for this high market demand in the sore throat lozenges market.
The market in China is expected to register a CAGR of 6.6% over the forecast period. The increase in the number of children and the elderly population susceptible to developing a throat infection is surging the demand for throat lozenges, propelling the market growth.
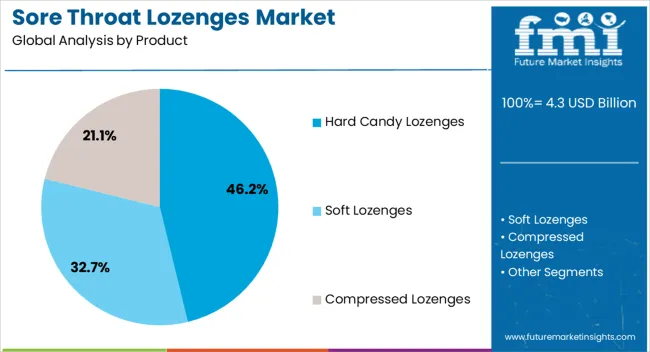
Top Product Type | Hard Candy Lozenges |
---|---|
Market Share in 2024 | 46.5% |
The demand for hard candy lozenges is projected to showcase significant growth during the specified period. This segment holds a substantial share of 46.5% of the market by product. These hard candy lozenges are more common and contribute more to the market, owing to their popularity and easy availability.
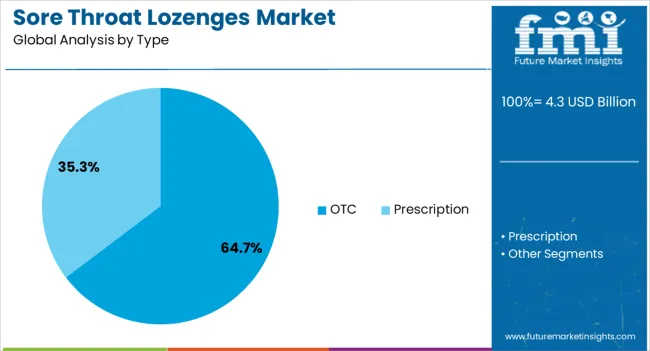
Top Type | OTC Medication |
---|---|
Market Share in 2024 | 85.3% |
OTC type of medication for common flu and pharyngitis is highly preferred for sore throat lozenges type and it holds a maximum share of 85.3% of the market by type. Due to their availability in the market and in all medicine stores, over-the-counter medications are highly preferred by consumers.
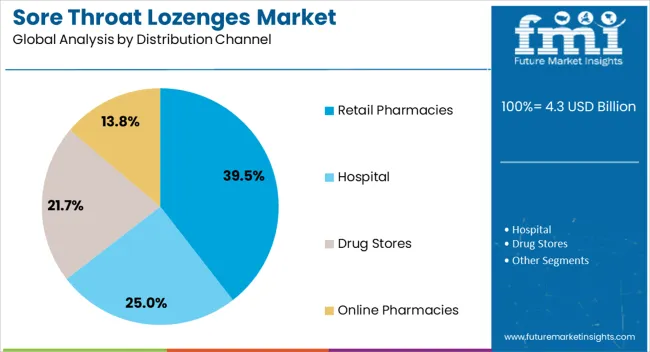
Top Distribution Channel | Retail Pharmacies |
---|---|
Market Share in 2024 | 36.7% |
Retail Pharmacies facilitate sales of the product worth USD 1.5 billion and hold a share of 36.7% of the market by distribution channel. The easy availability of throat lozenges in the local drug stores and their OTC prescriptions drive the demand for lozenges.
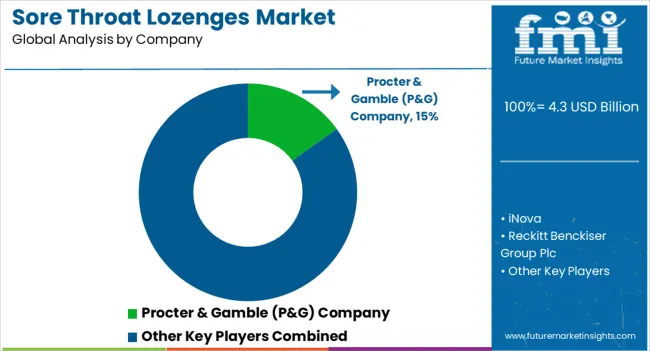
The market for sore throat lozenges is characterized by the presence of experienced competitors. These companies are focused on making decongestants easily accessible to the general public in large quantities. Key strategies employed by companies in the sore throat lozenges industry include new product innovation, launches, obtaining regulatory approvals, and expanding their operations. These strategies enable them to stay competitive and meet the evolving needs of consumers.
Recent Developments
Attribute | Details |
---|---|
Forecast Period | 2024 to 2034 |
Historical Data Available for | 2019 to 2023 |
Market Analysis | USD billion for Value |
Key Regions Covered | North America; Latin America; Europe; South Asia; East Asia; Oceania; and Middle East & Africa |
Key Countries Covered | USA, Canada, Brazil, Mexico, Argentina, UK, Germany, Italy, Russia, Spain, France, Russia, BENELUX, India, Thailand, Indonesia, Malaysia, Japan, China, South Korea, Australia, New Zealand, Turkey, GCC, Israel, North Africa, and South Africa |
Key Market Segments Covered | Product, Type, Distribution Channel, and Region |
Key Companies Profiled | iNova Pharmaceuticals; Procter & Gamble (P&G) Company; Reckitt Benckiser Group Plc; Ricola AG; Mondelez International.; Thornton & Ross Ltd.; Traditional Medicinals, Inc.; Bliss GVS Pharma Ltd.; GlaxoSmithKline Plc; Honibe; SSL International; Cipla Ltd; Novartis; Johnson & Johnson |
Pricing | Available upon Request |
Table 01: Global Market Analysis 2018 to 2023 and Forecast 2024 to 2034, By Product
Table 02: Global Market Analysis 2018 to 2023 and Forecast 2024 to 2034 By Type
Table 03: Global Market Analysis 2018 to 2023 and Forecast 2024 to 2034, By Distribution Channel
Table 04: Global Market Analysis 2018 to 2023 and Forecast 2024 to 2034, By Region
Table 05: North America Market Value (US$ Million) Analysis 2018 to 2023 and Forecast 2024 to 2034, By Country
Table 06: North America Market Value (US$ Million) Analysis 2018 to 2023 and Forecast 2024 to 2034, By Product
Table 07: North America Market Analysis 2018 to 2023 and Forecast 2024 to 2034 By Type
Table 08: North America Market Value (US$ Million) Analysis 2018 to 2023 and Forecast 2024 to 2034, By Distribution Channel
Table 09: Latin America Market Value (US$ Million) Analysis 2018 to 2023 and Forecast 2024 to 2034, By Country
Table 10: Latin America Market Value (US$ Million) Analysis 2018 to 2023 and Forecast 2024 to 2034, By Product
Table 11: Latin America Market Analysis 2018 to 2023 and Forecast 2024 to 2034 By Type
Table 12: Latin America Market Value (US$ Million) Analysis 2018 to 2023 and Forecast 2024 to 2034, By Distribution Channel
Table 13: Europe Market Value (US$ Million) Analysis 2018 to 2023 and Forecast 2024 to 2034, By Country
Table 14: Europe Market Value (US$ Million) Analysis 2018 to 2023 and Forecast 2024 to 2034, By Product
Table 15: Europe Market Analysis 2018 to 2023 and Forecast 2024 to 2034 By Type
Table 16: Europe Market Value (US$ Million) Analysis 2018 to 2023 and Forecast 2024 to 2034, By Distribution Channel
Table 17: East Asia Market Value (US$ Million) Analysis 2018 to 2023 and Forecast 2024 to 2034, By Country
Table 18: East Asia Market Value (US$ Million) Analysis 2018 to 2023 and Forecast 2024 to 2034, By Product
Table 19: East Asia Market Analysis 2018 to 2023 and Forecast 2024 to 2034 By Type
Table 20: East Asia Market Value (US$ Million) Analysis 2018 to 2023 and Forecast 2024 to 2034, By Distribution Channel
Table 21: South Asia Market Value (US$ Million) Analysis 2018 to 2023 and Forecast 2024 to 2034, By Country
Table 22: South Asia Market Value (US$ Million) Analysis 2018 to 2023 and Forecast 2024 to 2034, By Product
Table 23: South Asia Market Analysis 2018 to 2023 and Forecast 2024 to 2034 By Type
Table 24: South Asia Market Value (US$ Million) Analysis 2018 to 2023 and Forecast 2024 to 2034, By Distribution Channel
Table 25: Oceania Market Value (US$ Million) Analysis 2018 to 2023 and Forecast 2024 to 2034, By Country
Table 26: Oceania Market Value (US$ Million) Analysis 2018 to 2023 and Forecast 2024 to 2034, By Product
Table 27: Oceania Market Analysis 2018 to 2023 and Forecast 2024 to 2034 By Type
Table 28: Oceania Market Value (US$ Million) Analysis 2018 to 2023 and Forecast 2024 to 2034, By Distribution Channel
Table 29: Middle East & Africa Market Value (US$ Million) Analysis 2018 to 2023 and Forecast 2024 to 2034, By Country
Table 30: Middle East & Africa Market Value (US$ Million) Analysis 2018 to 2023 and Forecast 2024 to 2034, By Product
Table 31: Middle East & Africa Market Analysis 2018 to 2023 and Forecast 2024 to 2034 By Type
Table 32: Middle East & Africa Market Value (US$ Million) Analysis 2018 to 2023 and Forecast 2024 to 2034, By Distribution Channel
Figure 01: Global Market Value Analysis, 2018 to 2023
Figure 02: Global Market Forecast & Y-o-Y Growth, 2024 to 2034
Figure 03: Global Market Absolute $ Opportunity (US$ Million) Analysis, 2024 to 2034
Figure 04: Global Market Value Share (%) Analysis 2024 to 2034, By Product
Figure 05: Global Market Y-o-Y Growth (%) Analysis 2024 to 2034, By Product
Figure 06: Global Market Attractiveness Analysis 2024 to 2034, By Product
Figure 07: Global Market Value Share (%) Analysis 2024 to 2034, By Type
Figure 08: Global Market Y-o-Y Growth (%) Analysis 2024 to 2034, By Type
Figure 09: Global Market Attractiveness Analysis 2024 to 2034, By Type
Figure 10: Global Market Value Share (%) Analysis 2024 to 2034, By Distribution Channel
Figure 11: Global Market Y-o-Y Growth (%) Analysis 2024 to 2034, By Distribution Channel
Figure 12: Global Market Attractiveness Analysis 2024 to 2034, By Distribution Channel
Figure 13: Global Market Value Share (%) Analysis 2024 to 2034, By Region
Figure 14: Global Market Y-o-Y Growth (%) Analysis 2024 to 2034, By Region
Figure 15: Global Market Attractiveness Analysis 2024 to 2034, By Region
Figure 16: North America Market Size (US$ Million) Analysis, 2022E to 2032F
Figure 17: North America Market Y-o-Y Analysis, 2024 to 2034
Figure 18: North America Market Value Analysis, 2018 to 2023
Figure 19: North America Market Forecast & Y-o-Y growth, 2024 to 2034
Figure 20: North America Market Value Share, By Product 2023 (E)
Figure 21: North America Market Value Share, By Type 2023 (E)
Figure 22: North America Market Value Share, By Distribution Channel 2023 (E)
Figure 23: North America Market Value Share, By Country 2023 (E)
Figure 24: North America Market Attractiveness Analysis By Product, 2024 to 2034
Figure 25: North America Market Attractiveness Analysis By Type, 2024 to 2034
Figure 26: North America Market Attractiveness Analysis By Distribution Channel, 2024 to 2034
Figure 27: North America Market Attractiveness Analysis by Country, 2024 to 2034
Figure 28: USA Market Value Proportion Analysis, 2022
Figure 29: USA Market Share Analysis (%) By Product, 2024 to 2034
Figure 30: USA Market Share Analysis (%) By Type, 2024 to 2034
Figure 31: USA Market Share Analysis (%) By Distribution Channel, 2024 to 2034
Figure 32: Global Vs. USA Growth Comparison
Figure 33: Canada Market Value Proportion Analysis, 2022
Figure 34: Canada Market Share Analysis (%) By Product, 2024 to 2034
Figure 35: Canada Market Share Analysis (%) By Type, 2024 to 2034
Figure 36: Canada Market Share Analysis (%) By Distribution Channel, 2024 to 2034
Figure 37: Global Vs. Canada. Growth Comparison
Figure 38: Latin America Market Size (US$ Million) Analysis, 2022E to 2032F
Figure 39: Latin America Market Y-o-Y Analysis, 2024 to 2034
Figure 40: Latin America Market Value Analysis, 2018 to 2023
Figure 41: Latin America Market Forecast & Y-o-Y growth, 2024 to 2034
Figure 42: Latin America Market Value Share, By Product 2023 (E)
Figure 43: Latin America Market Value Share, By Type 2023 (E)
Figure 44: Latin America Market Value Share, By Distribution Channel 2023 (E)
Figure 45: Latin America Market Value Share, By Country 2023 (E)
Figure 46: Latin America Market Attractiveness Analysis By Product, 2024 to 2034
Figure 47: Latin America Market Attractiveness Analysis By Type, 2024 to 2034
Figure 48: Latin America Market Attractiveness Analysis By Distribution Channel, 2024 to 2034
Figure 49: Latin America Market Attractiveness Analysis by Country, 2024 to 2034
Figure 50: Mexico Market Value Proportion Analysis, 2022
Figure 51: Mexico Market Share Analysis (%) By Product, 2024 to 2034
Figure 52: Mexico Market Share Analysis (%) By Type, 2024 to 2034
Figure 53: Mexico Market Share Analysis (%) By Distribution Channel, 2024 to 2034
Figure 54: Global Vs Mexico Growth Comparison
Figure 55: Brazil Market Value Proportion Analysis, 2022
Figure 56: Brazil Market Share Analysis (%) By Product, 2024 to 2034
Figure 57: Brazil Market Share Analysis (%) By Type, 2024 to 2034
Figure 58: Brazil Market Share Analysis (%) By Distribution Channel, 2024 to 2034
Figure 59: Global Vs. Brazil. Growth Comparison
Figure 60: Argentina Market Value Proportion Analysis, 2022
Figure 61: Argentina Market Share Analysis (%) By Product, 2024 to 2034
Figure 62: Argentina Market Share Analysis (%) By Type, 2024 to 2034
Figure 63: Argentina Market Share Analysis (%) By Distribution Channel, 2024 to 2034
Figure 64: Global Vs Argentina Growth Comparison
Figure 65: Europe Market Size (US$ Million) Analysis, 2022E to 2032F
Figure 66: Europe Market Y-o-Y Analysis, 2024 to 2034
Figure 67: Europe Market Value Analysis, 2018 to 2023
Figure 68: Europe Market Forecast & Y-o-Y growth, 2024 to 2034
Figure 69: Europe Market Value Share, By Product2023 (E)
Figure 70: Europe Market Value Share, By Type2023 (E)
Figure 71: Europe Market Value Share, By Distribution Channel 2023 (E)
Figure 72: Europe Market Value Share, By Country 2023 (E)
Figure 73: Europe Market Attractiveness Analysis By Product, 2024 to 2034
Figure 74: Europe Market Attractiveness Analysis By Type, 2024 to 2034
Figure 75: Europe Market Attractiveness Analysis By Distribution Channel, 2024 to 2034
Figure 76: Europe Market Attractiveness Analysis by Country, 2024 to 2034
Figure 77: UK Market Value Proportion Analysis, 2022
Figure 78: UK Market Share Analysis (%) By Product, 2024 to 2034
Figure 79: UK Market Share Analysis (%) By Type, 2024 to 2034
Figure 80: UK Market Share Analysis (%) By Distribution Channel, 2024 to 2034
Figure 81: Global Vs. UK Growth Comparison
Figure 82: Germany Market Value Proportion Analysis, 2022
Figure 83: Germany Market Share Analysis (%) By Product, 2024 to 2034
Figure 84: Germany Market Share Analysis (%) By Type, 2024 to 2034
Figure 85: Germany Market Share Analysis (%) By Distribution Channel, 2024 to 2034
Figure 86: Global Vs. Germany Growth Comparison
Figure 87: Italy Market Value Proportion Analysis, 2022
Figure 88: Italy Market Share Analysis (%) By Product, 2024 to 2034
Figure 89: Italy Market Share Analysis (%) By Type, 2024 to 2034
Figure 90: Italy Market Share Analysis (%) By Distribution Channel, 2024 to 2034
Figure 91: Global Vs. Italy Growth Comparison
Figure 92: France Market Value Proportion Analysis, 2022
Figure 93: France Market Share Analysis (%) By Product, 2024 to 2034
Figure 94: France Market Share Analysis (%) By Type, 2024 to 2034
Figure 95: France Market Share Analysis (%) By Distribution Channel, 2024 to 2034
Figure 96: Global Vs France Growth Comparison
Figure 97: Spain Market Value Proportion Analysis, 2022
Figure 98: Spain Market Share Analysis (%) By Product, 2024 to 2034
Figure 99: Spain Market Share Analysis (%) By Type, 2024 to 2034
Figure 100: Spain Market Share Analysis (%) By Distribution Channel, 2024 to 2034
Figure 101: Global Vs Spain Growth Comparison
Figure 102: Russia Market Value Proportion Analysis, 2022
Figure 103: Russia Market Share Analysis (%) By Product, 2024 to 2034
Figure 104: Russia Market Share Analysis (%) By Type, 2024 to 2034
Figure 105: Russia Market Share Analysis (%) By Distribution Channel, 2024 to 2034
Figure 106: Global Vs Russia Growth Comparison
Figure 107: BENELUX Market Value Proportion Analysis, 2022
Figure 108: BENELUX Market Share Analysis (%) By Product, 2024 to 2034
Figure 109: BENELUX Market Share Analysis (%) By Type, 2024 to 2034
Figure 110: BENELUX Market Share Analysis (%) By Distribution Channel, 2024 to 2034
Figure 111: Global Vs BENELUX Growth Comparison
Figure 112: East Asia Market Size (US$ Million) Analysis, 2022E to 2032F
Figure 113: East Asia Market Y-o-Y Analysis, 2024 to 2034
Figure 114: East Asia Market Value Analysis, 2018 to 2023
Figure 115: East Asia Market Forecast & Y-o-Y growth, 2024 to 2034
Figure 116: East Asia Market Value Share, By Product 2023 (E)
Figure 117: East Asia Market Value Share, By Type 2023 (E)
Figure 118: East Asia Market Value Share, By Distribution Channel 2023 (E)
Figure 119: East Asia Market Value Share, By Country 2023 (E)
Figure 120: East Asia Market Attractiveness Analysis By Product, 2024 to 2034
Figure 121: East Asia Market Attractiveness Analysis By Type, 2024 to 2034
Figure 122: East Asia Market Attractiveness Analysis By Distribution Channel, 2024 to 2034
Figure 123: East Asia Market Attractiveness Analysis by Country, 2024 to 2034
Figure 124: China Market Value Proportion Analysis, 2022
Figure 125: China Market Share Analysis (%) By Product, 2024 to 2034
Figure 126: China Market Share Analysis (%) By Type, 2024 to 2034
Figure 127: China Market Share Analysis (%) By Distribution Channel, 2024 to 2034
Figure 128: Global Vs. China Growth Comparison
Figure 129: Japan Market Value Proportion Analysis, 2022
Figure 130: Japan Market Share Analysis (%) By Product, 2024 to 2034
Figure 131: Japan Market Share Analysis (%) By Type, 2024 to 2034
Figure 132: Japan Market Share Analysis (%) By Distribution Channel, 2024 to 2034
Figure 133: Global Vs. Japan Growth Comparison
Figure 134: South Korea Market Value Proportion Analysis, 2022
Figure 135: South Korea Market Share Analysis (%) By Product, 2024 to 2034
Figure 136: South Korea Market Share Analysis (%) By Type, 2024 to 2034
Figure 137: South Korea Market Share Analysis (%) By Distribution Channel, 2024 to 2034
Figure 138: Global Vs South Korea Growth Comparison
Figure 139: South Asia Market Size (US$ Million) Analysis, 2022E to 2032F
Figure 140: South Asia Market Y-o-Y Analysis, 2024 to 2034
Figure 141: South Asia Market Value Analysis, 2018 to 2023
Figure 142: South Asia Market Forecast & Y-o-Y growth, 2024 to 2034
Figure 143: South Asia Market Value Share, By Product 2023 (E)
Figure 144: South Asia Market Value Share, By Type 2023 (E)
Figure 145: South Asia Market Value Share, By Distribution Channel 2023 (E)
Figure 146: South Asia Market Value Share, By Country 2023 (E)
Figure 147: South Asia Market Attractiveness Analysis By Product, 2024 to 2034
Figure 148: South Asia Market Attractiveness Analysis By Type, 2024 to 2034
Figure 149: South Asia Market Attractiveness Analysis By Distribution Channel, 2024 to 2034
Figure 150: South Asia Market Attractiveness Analysis by Country, 2024 to 2034
Figure 151: India Market Value Proportion Analysis, 2022
Figure 152: India Market Share Analysis (%) By Product, 2024 to 2034
Figure 153: India Market Share Analysis (%) By Type, 2024 to 2034
Figure 154: India Market Share Analysis (%) By Distribution Channel, 2024 to 2034
Figure 155: Global Vs. India Growth Comparison
Figure 156: Indonesia Market Value Proportion Analysis, 2022
Figure 157: Indonesia Market Share Analysis (%) By Product, 2024 to 2034
Figure 158: Indonesia Market Share Analysis (%) By Type, 2024 to 2034
Figure 159: Indonesia Market Share Analysis (%) By Distribution Channel, 2024 to 2034
Figure 160: Global Vs. Indonesia Growth Comparison
Figure 161: Malaysia Market Value Proportion Analysis, 2022
Figure 162: Malaysia Market Share Analysis (%) By Product, 2024 to 2034
Figure 163: Malaysia Market Share Analysis (%) By Type, 2024 to 2034
Figure 164: Malaysia Market Share Analysis (%) By Distribution Channel, 2024 to 2034
Figure 165: Global Vs. Malaysia Growth Comparison
Figure 166: Thailand Market Value Proportion Analysis, 2022
Figure 167: Thailand Market Share Analysis (%) By Product, 2024 to 2034
Figure 168: Thailand Market Share Analysis (%) By Type, 2024 to 2034
Figure 169: Thailand Market Share Analysis (%) By Distribution Channel, 2024 to 2034
Figure 170: Global Vs. Thailand Growth Comparison
Figure 171: Oceania Market Size (US$ Million) Analysis, 2022E to 2032F
Figure 172: Oceania Market Y-o-Y Analysis, 2024 to 2034
Figure 173: Oceania Market Value Analysis, 2018 to 2023
Figure 174: Oceania Market Forecast & Y-o-Y growth, 2024 to 2034
Figure 175: Oceania Market Value Share, By Product 2023 (E)
Figure 176: Oceania Market Value Share, By Type 2023 (E)
Figure 177: Oceania Market Value Share, By Distribution Channel 2023 (E)
Figure 178: Oceania Market Value Share, By Country 2023 (E)
Figure 179: Oceania Market Attractiveness Analysis By Product, 2024 to 2034
Figure 180: Oceania Market Attractiveness Analysis By Type, 2024 to 2034
Figure 181: Oceania Market Attractiveness Analysis By Distribution Channel, 2024 to 2034
Figure 182: Oceania Market Attractiveness Analysis by Country, 2024 to 2034
Figure 183: Australia Market Value Proportion Analysis, 2022
Figure 184: Australia Market Share Analysis (%) By Product, 2024 to 2034
Figure 185: Australia Market Share Analysis (%) By Type, 2024 to 2034
Figure 186: Australia Market Share Analysis (%) By Distribution Channel, 2024 to 2034
Figure 187: Global Vs. Australia Growth Comparison
Figure 188: New Zealand Market Value Proportion Analysis, 2022
Figure 189: New Zealand Market Share Analysis (%) By Product, 2024 to 2034
Figure 190: New Zealand Market Share Analysis (%) By Type, 2024 to 2034
Figure 191: New Zealand Market Share Analysis (%) By Distribution Channel, 2024 to 2034
Figure 192: Global Vs New Zealand Growth Comparison
Figure 193: Middle East & Africa Market Size (US$ Million) Analysis, 2022E to 2032F
Figure 194: Middle East & Africa Market Y-o-Y Analysis, 2024 to 2034
Figure 195: Middle East & Africa Market Value Analysis, 2018 to 2023
Figure 196: Middle East & Africa Market Forecast & Y-o-Y growth, 2024 to 2034
Figure 197: Middle East & Africa Market Value Share, By Product 2023 (E)
Figure 198: Middle East & Africa Market Value Share, By Type 2023 (E)
Figure 199: Middle East & Africa Market Value Share, By Distribution Channel 2023 (E)
Figure 200: Middle East & Africa Market Value Share, By Country 2023 (E)
Figure 201: Middle East & Africa Market Attractiveness Analysis By Product, 2024 to 2034
Figure 202: Middle East & Africa Market Attractiveness Analysis By Type, 2024 to 2034
Figure 203: Middle East & Africa Market Attractiveness Analysis By Distribution Channel, 2024 to 2034
Figure 204: Middle East & Africa Market Attractiveness Analysis by Country, 2024 to 2034
Figure 205: GCC Countries Market Value Proportion Analysis, 2022
Figure 206: GCC Countries Market Share Analysis (%) By Product, 2024 to 2034
Figure 207: GCC Countries Market Share Analysis (%) By Type, 2024 to 2034
Figure 208: GCC Countries Market Share Analysis (%) By Distribution Channel, 2024 to 2034
Figure 209: Global Vs GCC Countries Growth Comparison
Figure 210: Türkiye Market Value Proportion Analysis, 2022
Figure 211: Türkiye Market Share Analysis (%) By Product, 2024 to 2034
Figure 212: Türkiye Market Share Analysis (%) By Type, 2024 to 2034
Figure 213: Türkiye Market Share Analysis (%) By Distribution Channel, 2024 to 2034
Figure 214: Global Vs. Türkiye Growth Comparison
Figure 215: South Africa Market Value Proportion Analysis, 2022
Figure 216: South Africa Market Share Analysis (%) By Product, 2024 to 2034
Figure 217: South Africa Market Share Analysis (%) By Type, 2024 to 2034
Figure 218: South Africa Market Share Analysis (%) By Distribution Channel, 2024 to 2034
Figure 219: Global Vs. South Africa Growth Comparison
Figure 220: North Africa Market Value Proportion Analysis, 2022
Figure 221: North Africa Market Share Analysis (%) By Product, 2024 to 2034
Figure 222: North Africa Market Share Analysis (%) By Type, 2024 to 2034
Figure 223: North Africa Market Share Analysis (%) By Distribution Channel, 2024 to 2034
Figure 224: Global Vs North Africa Growth Comparison
The sore throat lozenges market is worth USD 4.4 billion in 2024 and is set to expand 1.7X over the next ten years.
The sore throat lozenges market is expected to reach USD 7.5 billion by the end of 2034.
The global market is expected to expand at a CAGR of 5.6% through 2034 due to the rising geriatric population and increased cases of common cold and throat infections.
The United States, China, Japan, Germany, and India are the top 5 countries that are driving the demand for sore throat lozenges.
North America is one of the key markets for sore throat lozenges, with the USA accounting for about 92.7% of the North American sore throat lozenges market.
Demand for sore throat lozenges in Europe is expected to register a growth of 5.1% over the next ten years.
South Asia’s market in sore throat lozenges is offering lucrative growth opportunities and is expected to exhibit healthy growth of 6.7% CAGR during the forecast period.
iNova Pharmaceuticals, Procter & Gamble (P&G) Company, Reckitt Benckiser Group Plc, Ricola AG, and Mondelēz International., are some of the key players in the sore throat lozenges industry.
Explore Similar Insights
Thank you!
You will receive an email from our Business Development Manager. Please be sure to check your SPAM/JUNK folder too.