Sphingolipids Market Size and Share Forecast Outlook 2025 to 2035

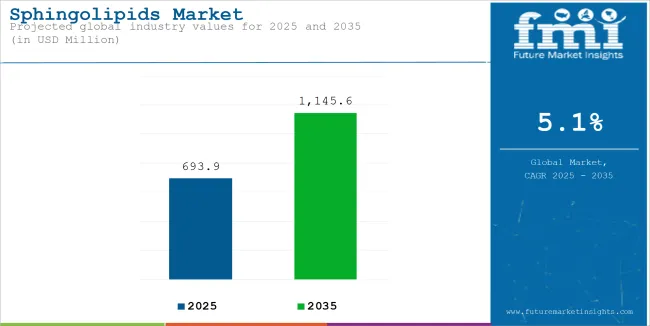
The global sphingolipids market is projected to be valued at USD 693.9 million in 2025 and is expected to reach USD 1,145.6 million by 2035, registering a CAGR of 5.1% during the forecast period. This growth is driven by expanding applications in pharmaceuticals, nutraceuticals, and cosmetics.

In the pharmaceutical sector, sphingolipids are gaining attention for their roles in cell signalling and apoptosis, making them valuable in developing treatments for cancer, neurodegenerative diseases, and metabolic disorders. Advancements in lipidomics and personalized medicine are further enhancing their therapeutic potential.

In cosmetics, the demand for bio-based and sustainable products has led to increased use of sphingolipids, particularly ceramides, for skin hydration and anti-aging benefits. The nutraceutical industry is also incorporating sphingolipids for their functional health benefits, including support for cellular health and metabolic balance. Overall, the market's growth is underpinned by technological advancements, strategic collaborations, and increasing R&D investments across these industries.

Prominent players in the sphingolipids market include Evonik Industries AG, CLR Berlin, and CD Bioparticles. These companies are actively expanding their product portfolios and investing in research to enhance sphingolipid applications. Croda International introduced SphingoCare™, a range of sphingolipids and ceramide-based skin conditioning agents designed for cosmetic applications.
Sphingolipids Market

Global Sphingolipids Industry Assessment

Attributes Key Insights
Estimated Size, 2025 USD 693.9 million
Projected Size, 2035 USD 1,145.6 million
CAGR (2025 to 2035) 5.1%

These ingredients are primarily biotechnology and plant-derived, available in high-purity levels, pre-dispersions, or biomimetic blends. SphingoCare™ products offer benefits such as skin hydration, scalp well-being, soothing effects, environmental protection, lip care, microbiome balance, and hair cuticle smoothing.

Technological advancements, such as the development of sphingolipid-based nanocarriers for targeted drug delivery, are also influencing market growth. These innovations enhance the bioavailability and efficacy of therapeutic agents, opening new avenues in pharmaceutical applications. As research progresses, such technologies are anticipated to play a pivotal role in expanding the utility of sphingolipids across various sectors.

The sphingolipids market in North America and Europe is being significantly driven by advancements in pharmaceutical and cosmetic industries. In North America, particularly the USA, the adoption of sphingolipids in drug formulations for cancer and neurodegenerative diseases has been accelerated by a strong focus on personalized medicine and clinical research.

Concurrently, the demand for natural cosmetic ingredients, such as ceramides, has been elevated by consumer preference for bio-based skincare products. In Europe, market growth is being supported by stringent regulatory frameworks and high product quality standards. Increased utilization in pharmaceuticals and cosmetics has been further reinforced through EU-funded research on metabolic and neurological disorders. Additionally, the use of sphingolipids in functional foods and supplements is being expanded in alignment with holistic wellness trends across both regions.

Semi-Annual Market Update for the Sphingolipids Industry

The global sphingolipids market's compound annual growth rate (CAGR) for the first half of 2024 and 2025 is compared in the table below. This analysis provides important insights into the performance of the industry by highlighting significant shifts and trends in revenue generation.

The first half (H1) is the period from January to June, and the second half (H2) is July to December. In the first half (H1) of the decade from 2024 to 2034, the business is predicted to surge at a CAGR of 5.8%, followed by a slightly lower growth rate of 5.5% in the second half (H2) of the same decade.

Particular Value CAGR
H1 (2024 to 2034) 5.8%
H2 (2024 to 2034) 5.5%
H1 (2025 to 2035) 5.1%
H2 (2025 to 2035) 4.6%

Moving into the subsequent period, from H1 2025 to H2 2035, the CAGR is projected to decrease slightly to 5.1% in the first half and remain relatively moderate at 4.6% in the second half. In the first half (H1) the industry witnessed a decrease of 70 BPS while in the second half (H2), the industry witnessed a decrease of 90 BPS.

Analyzing Sphingolipids Market by Top Investment Segments

Sphingomyelin Leads the Market Due to Increasing Demand for Neuroprotective Therapeutics and Cell Function Enhancement

The sphingomyelin segment has been estimated to account for 37.0% of the total market revenue in 2025, making it the leading product category within the sphingolipids market. This dominance is being attributed to sphingomyelin's essential role in maintaining cellular membrane integrity and signal transduction pathways, particularly in neural tissues.

It has been widely recognized for its involvement in myelin sheath formation, which is critical for proper nerve function. As research continues to focus on neurodegenerative disorders such as Alzheimer’s and Parkinson’s diseases, sphingomyelin’s therapeutic potential is being explored extensively.
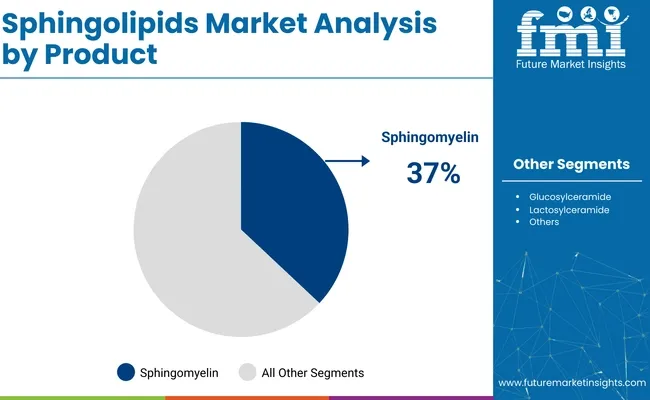
Sphingolipids Market Analysis By Product

Moreover, increased demand for functional lipids in infant nutrition, especially in infant formula compositions, has further accelerated its adoption. Its bio-functional properties are being leveraged to replicate the benefits of human breast milk fat composition.

Rising healthcare awareness and growing investments in clinical research have also strengthened the segment. Additionally, its utilization in cosmeceuticals for improving skin barrier function has expanded its industrial footprint. These combined factors have reinforced sphingomyelin's market leadership and long-term growth trajectory.

Liposome Drug Delivery Systems Dominate the Market Owing to Advancements in Targeted Cancer Therapies and Controlled Drug Release

The Liposome Drug Delivery Systems (LDDS) segment has emerged as the leading application segment, holding 42.8% of the total market revenue share in 2025. This leadership is being driven by the surging demand for targeted and controlled-release drug delivery platforms, particularly in oncology. Liposomes, due to their biocompatible and biodegradable nature, have been increasingly used to encapsulate chemotherapeutic agents, thereby improving efficacy while minimizing systemic toxicity.
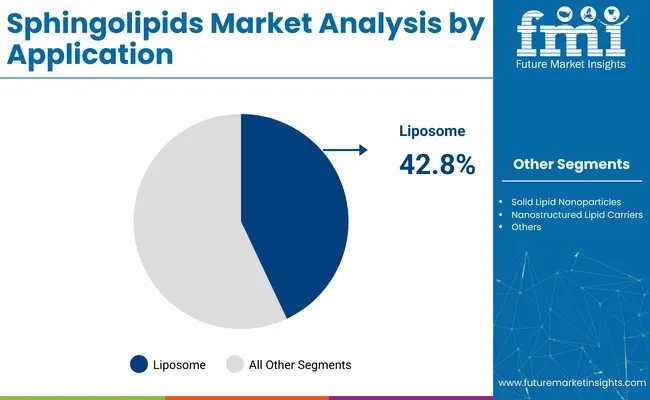
Sphingolipids Market Analysis By Application

This technology has been extensively validated in both clinical and commercial pharmaceutical landscapes, supported by a growing body of evidence on its pharmacokinetic and pharmacodynamic benefits. Regulatory approvals for liposomal formulations in cancer therapies and vaccines have further contributed to its adoption. In addition, advances in nanotechnology and lipidomics have enabled the design of liposomes with improved stability, precision, and drug loading capacity.

The ability of LDDS to cross biological barriers and deliver active agents at target sites with minimal immunogenic response has been recognized as a significant advancement in modern drug delivery science. The market has also been influenced by ongoing investments in biopharmaceutical R&D, which are accelerating pipeline developments and further cementing the segment’s dominance in the sphingolipids application landscape.

Key Sphingolipids Market Trends

Rising Demand in the Cosmetic and Nutraceutical Industries is driving growth

There has been a significant use of sphingolipids in the Cosmetic and nutraceutical industry. Cosmetic usage of sphingolipids have risen with high adoption in ceramides for the restoration and maintenance of skin barrier. This in turn enhances the hydration and anti-aging properties and thus creating demand for these products.

The manufacturers of Anti-aging and moisturizing products are considering sphingolipids to an large extent in each of the skin care their portfoliosproducts. Bio-based and sustainable products have led to the inclusion of naturally derived sphingolipids in premium skincare solutions.

The nutraceutical industry is taking advantage of the benefits of sphingolipids for developing functional foods and dietary supplements. Emerging research is underpinning their potential role in brain health supplements which enhancing cognitive functions and metabolic wellness. For instance, sphingomyelin contributes to the formation of the myelin sheath, which is very important for neurological health. Thus, there has been interest in adding sphingolipids to functional foods focused on cognitive enhancement and elderly populations.

With consumer trends shifting toward wellness, the scientific innovations in bioactive lipid formulations lead to a rich demand landscape. The dual attractiveness in both the cosmetic and nutraceutical streams establishes sphingolipids as versatile, essential ingredients to sustain growth within the market

Advancements in Lipidomics Research and Precision Medicine is driving the industry growth

The sphingolipid market has continued to be characterized by a host of positive contributions provided by rapidly evolving researches related to lipidomics and increased precision medicines. Lipidomics is considered to be the sub process of metabolomics. The different structural types and functionality associated with sphingolipids or any lipids get successfully demarcated due to these practices.

These highly sophisticated methods like mass spectrometry, HPLC, and nuclear magnetic resonance techniques revolutionized this subject field. This has provided deep insight into their role in critical cellular processes such as membrane dynamics, signal transduction, and apoptosis.

In parallel, precision medicine has come out further to boost the interest in sphingolipids during the course of drug development and management of diseases. Their bioactive properties make them ideal candidates for targeted therapies against chronic diseases such as cancer, diabetes, and cardiovascular and neurodegenerative diseases.

For example, ceramides are under evaluation as biomarkers of metabolic syndrome and targets of anti-cancer therapies, whereas gangliosides have neuroprotective applications. However, this demand is further bolstered by the high possibility of improving therapeutic efficacy, as well as decreasing adverse effects of sphingolipid-based solutions for personalized health.

These developments underline their crucial role in the advancement of modern healthcare and keep this market very lively and fast-changing.

Expanding Applications in Neurodegenerative Disease Therapy is Creating Opportunities in the market

Among the various applications that sphingolipids to offer, few of the more promising opportunities would pertain to neurological disorders treatments. Neurological diseases such as Alzheimer's, Parkinson's among others pose great health hazards for mankind, mainly during the aging process and as this population increases.

Recent studies have reported on changes in sphingolipid metabolism contributing to the pathophysiology of neurodegenerative diseases. For example, accumulation of ceramide has been implicated in neuronal apoptosis of Alzheimer's disease (AD), and gangliosides are promising in their prospects for nerve regeneration and reduction of inflammation.

Pharmaceutical companies are investing in research and development, so as to tap into therapeutics forms of sphingolipids that can be used in neurodegenerative diseases. Partnerships between academic researchers and industry have accelerated innovative formulation and delivery systems that increase bioavailability and efficacy.

On top of these, recent advances in lipidomics and precision medicine allow for more personalized neurodegenerative disease management and open newer avenues for sphingolipid-based treatments.

High Production Costs and Complex Extraction Processes Restricting Market Growth

The high cost of production and challenges in the modes of extraction continue to hamper the market, limiting promising applications for sphingolipids. The sphingolipids are obtained from natural tissues of animals or by chemical synthesis, involving resource-intensive processes. Due to structural diversity, precise methods of isolation and purification in advanced equipment and expertise are required from sphingolipids. This does not only increase the cost of production but also complicates the scaling up, especially during mass production.

Besides, the yield of sphingolipids from natural sources is normally low, requiring large amounts of raw material, which also increases the production cost. Synthetic production pathways, though promising a higher yield, involve sophisticated and time-consuming chemical processes that make them costly as well. Together, these contribute to high market prices for sphingolipid-based products, limiting their use in price-sensitive markets.

Other issues also include the ecological footprint of extraction, especially from animal tissues, raising questions of sustainability. Increasing interest by consumers and industry in more ecologically friendly and ethical products further puts pressure on the manufacturers to invest in greener and cheaper routes of production. Such challenges have to be responded to with innovatory biosynthetic pathways and sourcing methods that bring down the production cost and widen the circle of accessibility.

Concentration of Key Sphingolipids Market

Tier 1 companies are the industry leaders with 64.2% of the global industry. These companies stand out for having a large product portfolio and a high production capacity. These industry leaders also stand out for having a wide geographic reach, a strong customer base, and substantial experience in manufacturing and having enough financial resources, which enables them to enhance their research and development efforts and expand into new industries.

The companies within tier 1 have a good reputation and high brand value. Prominent companies within tier 1 include Merck KGaA, CordenPharma International and Lipoid GmbH

Tier 2 companies are relatively smaller as compared with tier 1 players. The tier 2 companies hold a market share of 19.1% worldwide. These firms may not have cutting-edge technology or a broad global reach, but they do ensure regulatory compliance and have good technology. The players are more competitive when it comes to pricing and target niche markets. Key Companies under this category include Croda International Plc, Biosynth, LARODAN AB and Santa Cruz Biotechnology, Inc.

Compared to Tiers 1 and 2, Tier 3 companies offer Sphingolipids, but with smaller revenue spouts and less influence. These companies mostly operate in one or two countries and have limited customer base. The companies such as Intas Pharmaceuticals Ltd, Macleods Pharmaceuticals Ltd., and others falls under tier 3 category. They specialize in specific products and cater to niche markets, adding diversity to the industry.

Analysis of Top Countries Producing and Utilizing Sphingolipids

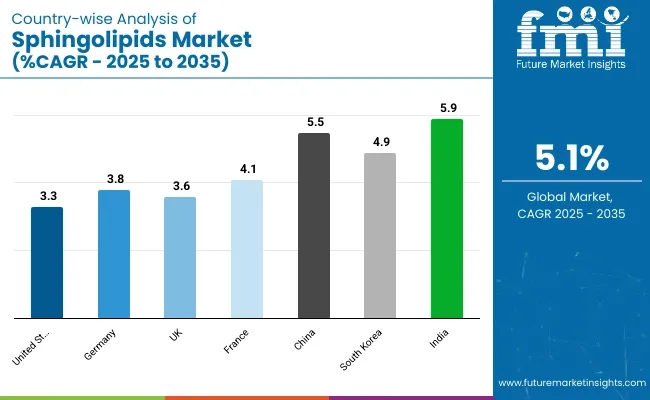
The market analysis for sphingolipids in various nations is covered in the section below. An analysis of important nations in North America, Latin America, Western Europe, Eastern Europe, East Asia, South Asia & Pacific, and Middle East & Africa of the world has been mentioned below. It is projected that the United States will maintain its leading position in North America through 2035, holding a value share of 89.7%. By 2035, China is expected to experience a CAGR of 5.5% in the Asia-Pacific region.

Countries Value CAGR (2025 to 2035)
United States 3.3%
Germany 3.8%
UK 3.6%
France 4.1%
China 5.5%
South Korea 4.9%
India 5.9%

Sphingolipids Market Country Wise Analysis

Increasing Applications in Biotechnology, Pharmaceutical Innovation, and Precision Medicine Fueling Growth is driving growth on Germany

The market for sphingolipids in Germany is poised to exhibit a CAGR of 3.8% between 2025 and 2035. The Germany holds highest market share in European market.

In Germany, the growing demand for sphingolipids is mostly driven by the adoption of biotechnology across pharmaceutical industries known for quality research development and innovation. Today Germany has become a hotspot in lipidomics research: much investment is being made in the studies of prized bioactive lipids like sphingolipids for their applications in curing chronic diseases like cancer, neurodegenerative diseases, and cardiovascular disorders.

The strong research infrastructure, supported by academic institutions and well-established biopharmaceutical manufacturers in Germany provides an enormous growth opportunity for the market of sphingolipids. Besides it, the growing precision medicine focused in Germany supports the demand for sphingolipid-based formulation and therapeutic development.

Germany has been leading in offering personalized treatments, especially in oncology, and this has further developed the need for sphingolipid-based solutions. Moreover, with the increased dedication by Germany for sustainable development and plant-derived goods, its needs for sphingolipids are being amplified by nutraceuticals and cosmetics.

Increasing Focus on Government Initiatives and Attention to Chronic Disease Management is a growth factor in the United States

United States is anticipated to show a CAGR of 3.3% between 2025 and 2035.

Sphingolipid-based solutions are also being increasingly demanded as a result of the focus by the National Institutes of Health and other federal agencies on precision medicine. A second aspect is the increased attention paid to chronic disease management and the United States elderly population, driving demand for sphingolipid-based targeted therapeutics and diagnostics.

The United States also has a very developed nutraceutical and cosmetic industry, with increasing interest in anti-aging and skin-care products, which continues to increase demand for sphingolipids in these applications.

The United States is the market leader in the sphingolipids market due to its high-quality research and development skills in pharmaceuticals and biotechnology. Among these countries, the United States hosts several of the leading pharmaceutical companies, which are very much active in sphingolipids in search of therapeutic uses in the treatment of cancer.

Increasing Demand For Advanced Therapeutic Solutions drives the Market in India

India is anticipated to show a CAGR of 5.9% between 2025 and 2035.

The major driving force for the sphingolipids market in India is the growing healthcare infrastructure and increasing demand for advanced therapeutic solutions. There is a significant increase in the prevalence of chronic diseases, including cancer among other disorders that create an urgent need for targeted therapies and precision medicine, wherein sphingolipids are playing an important role.

The Indian pharmaceutical sector, one of the largest in the world, is rapidly adopting sphingolipids in drug formulations for better efficacy in treating these diseases.

India's increasing biotech ecosystem and its position as a global hub for clinical trials have increased research and development on bioactive lipids-the driving force behind innovation in the sphingolipids market. Additionally, awareness of health care treatment and availability are making a pathway for sphingolipid-based nutraceuticals and cosmetic products that have further increased the market than pharmaceutical.

In India, because of the population and efforts made by the government to improve access to healthcare to remote regions, there is higher demand for inexpensive and effective treatments, pushing sphingolipid applications deeper into the mainstream.

Competitive Outlook

In terms of this market, the companies involved are resorting to multiple strategies to retain a competitive position. These involve product innovation to create advanced therapies like combination treatments, biologics, and new drug delivery systems to ensure greater efficacy and compliance from the patient.

Strategic partnerships and collaborations with research institutions and healthcare providers are being utilized to broaden their product portfolio. Geographical expansion into the emerging markets, particularly China and India, has been another strategic priority for these companies, where growth in the healthcare infrastructure and awareness is strong.

Recent Industry Developments in Sphingolipids Industry Outlook

  • Merck KGaA is a prominent player in the sphingolipids market, leveraging its expertise in life sciences, pharmaceuticals, and advanced materials. The company is highly regarded for its innovative solutions in lipidomics research and bioactive lipids, including sphingolipids. Merck’s extensive portfolio includes high-purity sphingolipids that are widely used in pharmaceutical formulations, biochemical research, and drug development.
  • CordenPharma International specializes in contract development and manufacturing services (CDMO) for lipid-based drug delivery systems, making it a vital contributor to the sphingolipids market. With expertise in the production of lipid excipients and active pharmaceutical ingredients (APIs), CordenPharma supports the development of sphingolipid-based formulations, particularly in advanced therapies targeting chronic diseases like cancer and cardiovascular conditions.

Leading Suppliers of Sphingolipids

  • Merck KGaA
  • CordenPharma International
  • Lipoid GmbH
  • Croda International Plc
  • Biosynth
  • LARODAN AB
  • Santa Cruz Biotechnology, Inc.
  • Creative Enzymes
  • Others

Top Segments Studied in the Sphingolipids Market Research Report

By Product:

In terms of product, the industry is divided into Ceramide, Sphingomyelin, Glucosylceramide (GlcCer), Lactosylceramide (LacCer), Ganglioside GM3 among Other.

By Source:

In terms of source, the industry is segregated into synthetic, semi-synthetic and natural

By Application:

In terms of application, the industry is divided into Conventional Lipid-based Drug Delivery Systems (LBDDS), Self-Emulsifying Drug Delivery Systems (SEDDS), and Self-Micro emulsifying Drug Delivery Systems (SMEDDS), Liposomes, Solid Lipid Nanoparticles, Nanostructured Lipid Carriers and Others.

By Form:

In form segment, the industry is segregated into Liquid, Semi-solid and Solid

By End User:

In terms of end user, the industry is divided into pharmaceutical companies, biopharmaceutical companies, academics and research institutes among others.

By Region:

Key countries of North America, Latin America, East Asia, South Asia & Pacific, Western Europe, Eastern Europe and Middle East and Africa (MEA) have been covered in the report.

Table of Content

  1. Executive Summary
  2. Industry Introduction, including Taxonomy and Market Definition
  3. Market Trends and Success Factors, including Macro-economic Factors, Market Dynamics, and Recent Industry Developments
  4. Global Market Demand Analysis 2020 to 2024 and Forecast 2025 to 2035, including Historical Analysis and Future Projections
  5. Global Market Analysis 2020 to 2024 and Forecast 2025 to 2035
    • By Product
    • By Source
    • By Application
    • By Form
    • By End User
    • By Region
  6. Global Market Analysis 2020 to 2024 and Forecast 2025 to 2035, By Product
    • Ceramide
    • Sphingomyelin
    • Glucosylceramide (GlcCer)
    • Lactosylceramide (LacCer)
    • Ganglioside GM3
    • Other
  7. Global Market Analysis 2020 to 2024 and Forecast 2025 to 2035, By Source
    • Synthetic
    • Semi-synthetic
    • Natural
  8. Global Market Analysis 2020 to 2024 and Forecast 2025 to 2035, By Application
    • Conventional Lipid-based Drug Delivery Systems (LBDDS)
    • Self-Emulsifying Drug Delivery Systems (SEDDS)
    • Self-Microemulsifying Drug Delivery Systems (SMEDDS)
    • Liposomes
    • Solid Lipid Nanoparticles
    • Nanostructured Lipid Carriers
    • Others
  9. Global Market Analysis 2020 to 2024 and Forecast 2025 to 2035, By Form
    • Liquid
    • Semi-solid
    • Solid
  10. Global Market Analysis 2020 to 2024 and Forecast 2025 to 2035, By End User
    • Pharmaceutical Companies
    • Biopharmaceutical Companies
    • Academics and Research Institutes
    • Others
  11. Global Market Analysis 2020 to 2024 and Forecast 2025 to 2035, By Region
    • North America
    • Latin America
    • East Asia
    • South Asia and Pacific
    • Western Europe
    • Eastern Europe
    • Middle East and Africa
  12. North America Sales Analysis 2020 to 2024 and Forecast 2025 to 2035, by Key Segments and Countries
  13. Latin America Sales Analysis 2020 to 2024 and Forecast 2025 to 2035, by Key Segments and Countries
  14. East Asia Sales Analysis 2020 to 2024 and Forecast 2025 to 2035, by Key Segments and Countries
  15. South Asia & Pacific Sales Analysis 2020 to 2024 and Forecast 2025 to 2035, by Key Segments and Countries
  16. Western Europe Sales Analysis 2020 to 2024 and Forecast 2025 to 2035, by Key Segments and Countries
  17. Eastern Europe Sales Analysis 2020 to 2024 and Forecast 2025 to 2035, by Key Segments and Countries
  18. Middle East and Africa Sales Analysis 2020 to 2024 and Forecast 2025 to 2035, by Key Segments and Countries
  19. Sales Forecast 2025 to 2035 by Product, Source, Application, Form, and End User for 30 Countries
  20. Competition Outlook, including Market Structure Analysis, Company Share Analysis by Key Players, and Competition Dashboard
  21. Company Profile
    • Merck KGaA
    • CordenPharma International
    • Lipoid GmbH
    • Croda International Plc
    • Biosynth
    • LARODAN AB
    • Santa Cruz Biotechnology, Inc.
    • Creative Enzymes
    • Others

List of Tables

  • Table 01: Global Market Analysis 2020 to 2024 and Forecast 2025 to 2035, by Product
  • Table 02: Global Market Analysis 2020 to 2024 and Forecast 2025 to 2035, by Source
  • Table 03: Global Market Analysis 2020 to 2024 and Forecast 2025 to 2035, by Application
  • Table 04: Global Market Analysis 2020 to 2024 and Forecast 2025 to 2035, by Form
  • Table 05: Global Market Analysis 2020 to 2024 and Forecast 2025 to 2035, by End User
  • Table 06: Global Market Analysis 2020 to 2024 and Forecast 2025 to 2035, by Region
  • Table 07: North America Market Value (USD Million) Analysis 2020 to 2024 and Forecast 2025 to 2035, by Country
  • Table 08: North America Market Value (USD Million) Analysis 2020 to 2024 and Forecast 2025 to 2035, by Product
  • Table 09: North America Market Value (USD Million) Analysis 2020 to 2024 and Forecast 2025 to 2035, by Source
  • Table 10: North America Market Value (USD Million) Analysis 2020 to 2024 and Forecast 2025 to 2035, by Application
  • Table 11: North America Market Value (USD Million) Analysis 2020 to 2024 and Forecast 2025 to 2035, by Form
  • Table 12: North America Market Value (USD Million) Analysis 2020 to 2024 and Forecast 2025 to 2035, by End User
  • Table 13: Latin America Market Value (USD Million) Analysis 2020 to 2024 and Forecast 2025 to 2035, by Country
  • Table 14: Latin America Market Value (USD Million) Analysis 2020 to 2024 and Forecast 2025 to 2035, by Product
  • Table 15: Latin America Market Value (USD Million) Analysis 2020 to 2024 and Forecast 2025 to 2035, by Source
  • Table 16: Latin America Market Value (USD Million) Analysis 2020 to 2024 and Forecast 2025 to 2035, by Application
  • Table 17: Latin America Market Value (USD Million) Analysis 2020 to 2024 and Forecast 2025 to 2035, by Form
  • Table 18: Latin America Market Value (USD Million) Analysis 2020 to 2024 and Forecast 2025 to 2035, by End User
  • Table 19: Europe Market Value (USD Million) Analysis 2020 to 2024 and Forecast 2025 to 2035, by Country
  • Table 20: Europe Market Value (USD Million) Analysis 2020 to 2024 and Forecast 2025 to 2035, by Product
  • Table 21: Europe Market Analysis 2020 to 2024 and Forecast 2025 to 2035, by Source
  • Table 22: Europe Market Analysis 2020 to 2024 and Forecast 2025 to 2035, by Application
  • Table 23: Europe Market Analysis 2020 to 2024 and Forecast 2025 to 2035, by Form
  • Table 24: Europe Market Analysis 2020 to 2024 and Forecast 2025 to 2035, by End User
  • Table 25: East Asia Market Value (USD Million) Analysis 2020 to 2024 and Forecast 2025 to 2035, by Country
  • Table 26: East Asia Market Value (USD Million) Analysis 2020 to 2024 and Forecast 2025 to 2035, by Product
  • Table 27: East Asia Market Value (USD Million) Analysis 2020 to 2024 and Forecast 2025 to 2035, by Source
  • Table 28: East Asia Market Value (USD Million) Analysis 2020 to 2024 and Forecast 2025 to 2035, by Application
  • Table 29: East Asia Market Value (USD Million) Analysis 2020 to 2024 and Forecast 2025 to 2035, by Form
  • Table 30: East Asia Market Value (USD Million) Analysis 2020 to 2024 and Forecast 2025 to 2035, by End User
  • Table 31: South Asia Market Value (USD Million) Analysis 2020 to 2024 and Forecast 2025 to 2035, by Country
  • Table 32: South Asia Market Value (USD Million) Analysis 2020 to 2024 and Forecast 2025 to 2035, by Product
  • Table 33: South Asia Market Value (USD Million) Analysis 2020 to 2024 and Forecast 2025 to 2035, by Source
  • Table 34: South Asia Market Value (USD Million) Analysis 2020 to 2024 and Forecast 2025 to 2035, by Application
  • Table 35: South Asia Market Value (USD Million) Analysis 2020 to 2024 and Forecast 2025 to 2035, by Form
  • Table 36: South Asia Market Value (USD Million) Analysis 2020 to 2024 and Forecast 2025 to 2035, by End User
  • Table 37: Oceania Market Value (USD Million) Analysis 2020 to 2024 and Forecast 2025 to 2035, by Country
  • Table 38: Oceania Market Value (USD Million) Analysis 2020 to 2024 and Forecast 2025 to 2035, by Product
  • Table 39: Oceania Market Analysis 2020 to 2024 and Forecast 2025 to 2035, by Source
  • Table 40: Oceania Market Analysis 2020 to 2024 and Forecast 2025 to 2035, by Application
  • Table 41: Oceania Market Analysis 2020 to 2024 and Forecast 2025 to 2035, by Form
  • Table 42: Oceania Market Analysis 2020 to 2024 and Forecast 2025 to 2035, by End User
  • Table 43: Middle East & Africa Market Value (USD Million) Analysis 2020 to 2024 and Forecast 2025 to 2035, by Country
  • Table 44: Middle East & Africa Market Value (USD Million) Analysis 2020 to 2024 and Forecast 2025 to 2035, by Product
  • Table 45: Middle East & Africa Market Analysis 2020 to 2024 and Forecast 2025 to 2035, by Source
  • Table 46: Middle East & Africa Market Analysis 2020 to 2024 and Forecast 2025 to 2035, by Application
  • Table 47: Middle East & Africa Market Analysis 2020 to 2024 and Forecast 2025 to 2035, by Form
  • Table 48: Middle East & Africa Market Analysis 2020 to 2024 and Forecast 2025 to 2035, by End User

List of Figures

  • Figure 01: Global Market Value (USD Million) Analysis, 2020 to 2024
  • Figure 02: Global Market Forecast & Y-o-Y Growth, 2025 to 2035
  • Figure 03: Global Market Absolute $ Opportunity (USD Million) Analysis, 2025 to 2035
  • Figure 04: Global Market Value Share (%) Analysis 2025 and 2035, by Product
  • Figure 05: Global Market Y-o-Y Growth (%) Analysis 2025 to 2035, by Product
  • Figure 06: Global Market Attractiveness Analysis 2025 to 2035, by Product
  • Figure 07: Global Market Value Share (%) Analysis 2025 and 2035, by Source
  • Figure 08: Global Market Y-o-Y Growth (%) Analysis 2025 to 2035, by Source
  • Figure 09: Global Market Attractiveness Analysis 2025 to 2035, by Source
  • Figure 10: Global Market Value Share (%) Analysis 2025 and 2035, by Application
  • Figure 11: Global Market Y-o-Y Growth (%) Analysis 2025 to 2035, by Application
  • Figure 12: Global Market Attractiveness Analysis 2025 to 2035, by Application
  • Figure 13: Global Market Value Share (%) Analysis 2025 and 2035, by Form
  • Figure 14: Global Market Y-o-Y Growth (%) Analysis 2025 to 2035, by Form
  • Figure 15: Global Market Attractiveness Analysis 2025 to 2035, by Form
  • Figure 16: Global Market Value Share (%) Analysis 2025 and 2035, by End User
  • Figure 17: Global Market Y-o-Y Growth (%) Analysis 2025 to 2035, by End User
  • Figure 18: Global Market Attractiveness Analysis 2025 to 2035, by End User
  • Figure 19: Global Market Value Share (%) Analysis 2025 and 2035, by Region
  • Figure 20: Global Market Y-o-Y Growth (%) Analysis 2025 to 2035, by Region
  • Figure 21: Global Market Attractiveness Analysis 2025 to 2035, by Region
  • Figure 22: North America Market Value (USD Million) Analysis, 2020 to 2024
  • Figure 23: North America Market Value (USD Million) Forecast, 2025 to 2035
  • Figure 24: North America Market Value Share, by Product (2025 E)
  • Figure 25: North America Market Value Share, by Source (2025 E)
  • Figure 26: North America Market Value Share, by Application (2025 E)
  • Figure 27: North America Market Value Share, by Form (2025 E)
  • Figure 28: North America Market Value Share, by End User (2025 E)
  • Figure 29: North America Market Value Share, by Country (2025 E)
  • Figure 30: North America Market Attractiveness Analysis by Product, 2025 to 2035
  • Figure 31: North America Market Attractiveness Analysis by Source, 2025 to 2035
  • Figure 32: North America Market Attractiveness Analysis by Application, 2025 to 2035
  • Figure 33: North America Market Attractiveness Analysis by Form, 2025 to 2035
  • Figure 34: North America Market Attractiveness Analysis by End User, 2025 to 2035
  • Figure 35: North America Market Attractiveness Analysis by Country, 2025 to 2035
  • Figure 36: USA Market Value Proportion Analysis, 2024
  • Figure 37: Global Vs. USA Growth Comparison
  • Figure 38: USA Market Share Analysis (%) by Product, 2025 to 2035
  • Figure 39: USA Market Share Analysis (%) by Source, 2025 to 2035
  • Figure 40: USA Market Share Analysis (%) by Application, 2025 to 2035
  • Figure 41: USA Market Share Analysis (%) by Form, 2025 to 2035
  • Figure 42: USA Market Share Analysis (%) by End User, 2025 to 2035
  • Figure 43: Canada Market Value Proportion Analysis, 2024
  • Figure 44: Global Vs. Canada. Growth Comparison
  • Figure 45: Canada Market Share Analysis (%) by Product, 2025 to 2035
  • Figure 46: Canada Market Share Analysis (%) by Source, 2025 to 2035
  • Figure 47: Canada Market Share Analysis (%) by Application, 2025 to 2035
  • Figure 48: Canada Market Share Analysis (%) by Form, 2025 to 2035
  • Figure 49: Canada Market Share Analysis (%) by End User, 2025 to 2035
  • Figure 50: Latin America Market Value (USD Million) Analysis, 2020 to 2024
  • Figure 51: Latin America Market Value (USD Million) Forecast, 2025 to 2035
  • Figure 52: Latin America Market Value Share, by Product (2025 E)
  • Figure 53: Latin America Market Value Share, by Source (2025 E)
  • Figure 54: Latin America Market Value Share, by Application (2025 E)
  • Figure 55: Latin America Market Value Share, by Form (2025 E)
  • Figure 56: Latin America Market Value Share, by End User (2025 E)
  • Figure 57: Latin America Market Value Share, by Country (2025 E)
  • Figure 58: Latin America Market Attractiveness Analysis by Product, 2025 to 2035
  • Figure 59: Latin America Market Attractiveness Analysis by Source, 2025 to 2035
  • Figure 60: Latin America Market Attractiveness Analysis by Application, 2025 to 2035
  • Figure 61: Latin America Market Attractiveness Analysis by Form, 2025 to 2035
  • Figure 62: Latin America Market Attractiveness Analysis by End User, 2025 to 2035
  • Figure 63: Latin America Market Attractiveness Analysis by Country, 2025 to 2035
  • Figure 64: Mexico Market Value Proportion Analysis, 2024
  • Figure 65: Global Vs Mexico Growth Comparison
  • Figure 66: Mexico Market Share Analysis (%) by Product, 2025 to 2035
  • Figure 67: Mexico Market Share Analysis (%) by Source, 2025 to 2035
  • Figure 68: Mexico Market Share Analysis (%) by Application, 2025 to 2035
  • Figure 69: Mexico Market Share Analysis (%) by Form, 2025 to 2035
  • Figure 70: Mexico Market Share Analysis (%) by End User, 2025 to 2035
  • Figure 71: Brazil Market Value Proportion Analysis, 2024
  • Figure 72: Global Vs. Brazil. Growth Comparison
  • Figure 73: Brazil Market Share Analysis (%) by Product, 2025 to 2035
  • Figure 74: Brazil Market Share Analysis (%) by Source, 2025 to 2035
  • Figure 75: Brazil Market Share Analysis (%) by Application, 2025 to 2035
  • Figure 76: Brazil Market Share Analysis (%) by Form, 2025 to 2035
  • Figure 77: Brazil Market Share Analysis (%) by End User, 2025 to 2035
  • Figure 78: Argentina Market Value Proportion Analysis, 2024
  • Figure 79: Global Vs Argentina Growth Comparison
  • Figure 80: Argentina Market Share Analysis (%) by Product, 2025 to 2035
  • Figure 81: Argentina Market Share Analysis (%) by Source, 2025 to 2035
  • Figure 82: Argentina Market Share Analysis (%) by Application, 2025 to 2035
  • Figure 83: Argentina Market Share Analysis (%) by Form, 2025 to 2035
  • Figure 84: Argentina Market Share Analysis (%) by End User, 2025 to 2035
  • Figure 85: Europe Market Value (USD Million) Analysis, 2020 to 2024
  • Figure 86: Europe Market Value (USD Million) Forecast, 2025 to 2035
  • Figure 87: Europe Market Value Share, by Product (2025 E)
  • Figure 88: Europe Market Value Share, by Source (2025 E)
  • Figure 89: Europe Market Value Share, by Application (2025 E)
  • Figure 90: Europe Market Value Share, by Form (2025 E)
  • Figure 91: Europe Market Value Share, by End User (2025 E)
  • Figure 92: Europe Market Value Share, by Country (2025 E)
  • Figure 93: Europe Market Attractiveness Analysis by Product, 2025 to 2035
  • Figure 94: Europe Market Attractiveness Analysis by Source, 2025 to 2035
  • Figure 95: Europe Market Attractiveness Analysis by Application, 2025 to 2035
  • Figure 96: Europe Market Attractiveness Analysis by Form, 2025 to 2035
  • Figure 97: Europe Market Attractiveness Analysis by End User, 2025 to 2035
  • Figure 98: Europe Market Attractiveness Analysis by Country, 2025 to 2035
  • Figure 99: UK Market Value Proportion Analysis, 2024
  • Figure 100: Global Vs. UK Growth Comparison
  • Figure 101: UK Market Share Analysis (%) by Product, 2025 to 2035
  • Figure 102: UK Market Share Analysis (%) by Source, 2025 to 2035
  • Figure 103: UK Market Share Analysis (%) by Application, 2025 to 2035
  • Figure 104: UK Market Share Analysis (%) by Form, 2025 to 2035
  • Figure 105: UK Market Share Analysis (%) by End User, 2025 to 2035
  • Figure 106: Germany Market Value Proportion Analysis, 2024
  • Figure 107: Global Vs. Germany Growth Comparison
  • Figure 108: Germany Market Share Analysis (%) by Product, 2025 to 2035
  • Figure 109: Germany Market Share Analysis (%) by Source, 2025 to 2035
  • Figure 110: Germany Market Share Analysis (%) by Application, 2025 to 2035
  • Figure 111: Germany Market Share Analysis (%) by Form, 2025 to 2035
  • Figure 112: Germany Market Share Analysis (%) by End User, 2025 to 2035
  • Figure 113: Italy Market Value Proportion Analysis, 2024
  • Figure 114: Global Vs. Italy Growth Comparison
  • Figure 115: Italy Market Share Analysis (%) by Product, 2025 to 2035
  • Figure 116: Italy Market Share Analysis (%) by Source, 2025 to 2035
  • Figure 117: Italy Market Share Analysis (%) by Application, 2025 to 2035
  • Figure 118: Italy Market Share Analysis (%) by Form, 2025 to 2035
  • Figure 119: Italy Market Share Analysis (%) by End User, 2025 to 2035
  • Figure 120: France Market Value Proportion Analysis, 2024
  • Figure 121: Global Vs France Growth Comparison
  • Figure 122: France Market Share Analysis (%) by Product, 2025 to 2035
  • Figure 123: France Market Share Analysis (%) by Source, 2025 to 2035
  • Figure 124: France Market Share Analysis (%) by Application, 2025 to 2035
  • Figure 125: France Market Share Analysis (%) by Form, 2025 to 2035
  • Figure 126: France Market Share Analysis (%) by End User, 2025 to 2035
  • Figure 127: Spain Market Value Proportion Analysis, 2024
  • Figure 128: Global Vs Spain Growth Comparison
  • Figure 129: Spain Market Share Analysis (%) by Product, 2025 to 2035
  • Figure 130: Spain Market Share Analysis (%) by Source, 2025 to 2035
  • Figure 131: Spain Market Share Analysis (%) by Application, 2025 to 2035
  • Figure 132: Spain Market Share Analysis (%) by Form, 2025 to 2035
  • Figure 133: Spain Market Share Analysis (%) by End User, 2025 to 2035
  • Figure 134: Russia Market Value Proportion Analysis, 2024
  • Figure 135: Global Vs Russia Growth Comparison
  • Figure 136: Russia Market Share Analysis (%) by Product, 2025 to 2035
  • Figure 137: Russia Market Share Analysis (%) by Source, 2025 to 2035
  • Figure 138: Russia Market Share Analysis (%) by Application, 2025 to 2035
  • Figure 139: Russia Market Share Analysis (%) by Form, 2025 to 2035
  • Figure 140: Russia Market Share Analysis (%) by End User, 2025 to 2035
  • Figure 141: BENELUX Market Value Proportion Analysis, 2024
  • Figure 142: Global Vs BENELUX Growth Comparison
  • Figure 143: BENELUX Market Share Analysis (%) by Product, 2025 to 2035
  • Figure 144: BENELUX Market Share Analysis (%) by Source, 2025 to 2035
  • Figure 145: BENELUX Market Share Analysis (%) by Application, 2025 to 2035
  • Figure 146: BENELUX Market Share Analysis (%) by Form, 2025 to 2035
  • Figure 147: BENELUX Market Share Analysis (%) by End User, 2025 to 2035
  • Figure 148: East Asia Market Value (USD Million) Analysis, 2020 to 2024
  • Figure 149: East Asia Market Value (USD Million) Forecast, 2025 to 2035
  • Figure 150: East Asia Market Value Share, by Product (2025 E)
  • Figure 151: East Asia Market Value Share, by Source (2025 E)
  • Figure 152: East Asia Market Value Share, by Application (2025 E)
  • Figure 153: East Asia Market Value Share, by Form (2025 E)
  • Figure 154: East Asia Market Value Share, by End User (2025 E)
  • Figure 155: East Asia Market Value Share, by Country (2025 E)
  • Figure 156: East Asia Market Attractiveness Analysis by Product, 2025 to 2035
  • Figure 157: East Asia Market Attractiveness Analysis by Source, 2025 to 2035
  • Figure 158: East Asia Market Attractiveness Analysis by Application, 2025 to 2035
  • Figure 159: East Asia Market Attractiveness Analysis by Form, 2025 to 2035
  • Figure 160: East Asia Market Attractiveness Analysis by End User, 2025 to 2035
  • Figure 161: East Asia Market Attractiveness Analysis by Country, 2025 to 2035
  • Figure 162: China Market Value Proportion Analysis, 2024
  • Figure 163: Global Vs. China Growth Comparison
  • Figure 164: China Market Share Analysis (%) by Product, 2025 to 2035
  • Figure 165: China Market Share Analysis (%) by Source, 2025 to 2035
  • Figure 166: China Market Share Analysis (%) by Application, 2025 to 2035
  • Figure 167: China Market Share Analysis (%) by Form, 2025 to 2035
  • Figure 168: China Market Share Analysis (%) by End User, 2025 to 2035
  • Figure 169: Japan Market Value Proportion Analysis, 2024
  • Figure 170: Global Vs. Japan Growth Comparison
  • Figure 171: Japan Market Share Analysis (%) by Product, 2025 to 2035
  • Figure 172: Japan Market Share Analysis (%) by Source, 2025 to 2035
  • Figure 173: Japan Market Share Analysis (%) by Application, 2025 to 2035
  • Figure 174: Japan Market Share Analysis (%) by Form, 2025 to 2035
  • Figure 175: Japan Market Share Analysis (%) by End User, 2025 to 2035
  • Figure 176: South Korea Market Value Proportion Analysis, 2024
  • Figure 177: Global Vs South Korea Growth Comparison
  • Figure 178: South Korea Market Share Analysis (%) by Product, 2025 to 2035
  • Figure 179: South Korea Market Share Analysis (%) by Source, 2025 to 2035
  • Figure 180: South Korea Market Share Analysis (%) by Application, 2025 to 2035
  • Figure 181: South Korea Market Share Analysis (%) by Form, 2025 to 2035
  • Figure 182: South Korea Market Share Analysis (%) by End User, 2025 to 2035
  • Figure 183: South Asia Market Value (USD Million) Analysis, 2020 to 2024
  • Figure 184: South Asia Market Value (USD Million) Forecast, 2025 to 2035
  • Figure 185: South Asia Market Value Share, by Product (2025 E)
  • Figure 186: South Asia Market Value Share, by Source (2025 E)
  • Figure 187: South Asia Market Value Share, by Application (2025 E)
  • Figure 188: South Asia Market Value Share, by Form (2025 E)
  • Figure 189: South Asia Market Value Share, by End User (2025 E)
  • Figure 190: South Asia Market Value Share, by Country (2025 E)
  • Figure 191: South Asia Market Attractiveness Analysis by Product, 2025 to 2035
  • Figure 192: South Asia Market Attractiveness Analysis by Source, 2025 to 2035
  • Figure 193: South Asia Market Attractiveness Analysis by Application, 2025 to 2035
  • Figure 194: South Asia Market Attractiveness Analysis by Form, 2025 to 2035
  • Figure 195: South Asia Market Attractiveness Analysis by End User, 2025 to 2035
  • Figure 196: South Asia Market Attractiveness Analysis by Country, 2025 to 2035
  • Figure 197: India Market Value Proportion Analysis, 2024
  • Figure 198: Global Vs. India Growth Comparison
  • Figure 199: India Market Share Analysis (%) by Product, 2025 to 2035
  • Figure 200: India Market Share Analysis (%) by Source, 2025 to 2035
  • Figure 201: India Market Share Analysis (%) by Application, 2025 to 2035
  • Figure 202: India Market Share Analysis (%) by Form, 2025 to 2035
  • Figure 203: India Market Share Analysis (%) by End User, 2025 to 2035
  • Figure 204: Indonesia Market Value Proportion Analysis, 2024
  • Figure 205: Global Vs. Indonesia Growth Comparison
  • Figure 206: Indonesia Market Share Analysis (%) by Product, 2025 to 2035
  • Figure 207: Indonesia Market Share Analysis (%) by Source, 2025 to 2035
  • Figure 208: Indonesia Market Share Analysis (%) by Application, 2025 to 2035
  • Figure 209: Indonesia Market Share Analysis (%) by Form, 2025 to 2035
  • Figure 210: Indonesia Market Share Analysis (%) by End User, 2025 to 2035
  • Figure 211: Malaysia Market Value Proportion Analysis, 2024
  • Figure 212: Global Vs. Malaysia Growth Comparison
  • Figure 213: Malaysia Market Share Analysis (%) by Product, 2025 to 2035
  • Figure 214: Malaysia Market Share Analysis (%) by Source, 2025 to 2035
  • Figure 215: Malaysia Market Share Analysis (%) by Application, 2025 to 2035
  • Figure 216: Malaysia Market Share Analysis (%) by Form, 2025 to 2035
  • Figure 217: Malaysia Market Share Analysis (%) by End User, 2025 to 2035
  • Figure 218: Thailand Market Value Proportion Analysis, 2024
  • Figure 219: Global Vs. Thailand Growth Comparison
  • Figure 220: Thailand Market Share Analysis (%) by Product, 2025 to 2035
  • Figure 221: Thailand Market Share Analysis (%) by Source, 2025 to 2035
  • Figure 222: Thailand Market Share Analysis (%) by Application, 2025 to 2035
  • Figure 223: Thailand Market Share Analysis (%) by Form, 2025 to 2035
  • Figure 224: Thailand Market Share Analysis (%) by End User, 2025 to 2035
  • Figure 225: Oceania Market Value (USD Million) Analysis, 2020 to 2024
  • Figure 226: Oceania Market Value (USD Million) Forecast, 2025 to 2035
  • Figure 227: Oceania Market Value Share, by Product (2025 E)
  • Figure 228: Oceania Market Value Share, by Source (2025 E)
  • Figure 229: Oceania Market Value Share, by Application (2025 E)
  • Figure 230: Oceania Market Value Share, by Form (2025 E)
  • Figure 231: Oceania Market Value Share, by End User (2025 E)
  • Figure 232: Oceania Market Value Share, by Country (2025 E)
  • Figure 233: Oceania Market Attractiveness Analysis by Product, 2025 to 2035
  • Figure 234: Oceania Market Attractiveness Analysis by Source, 2025 to 2035
  • Figure 235: Oceania Market Attractiveness Analysis by Application, 2025 to 2035
  • Figure 236: Oceania Market Attractiveness Analysis by Form, 2025 to 2035
  • Figure 237: Oceania Market Attractiveness Analysis by End User, 2025 to 2035
  • Figure 238: Oceania Market Attractiveness Analysis by Country, 2025 to 2035
  • Figure 239: Australia Market Value Proportion Analysis, 2024
  • Figure 240: Global Vs. Australia Growth Comparison
  • Figure 241: Australia Market Share Analysis (%) by Product, 2025 to 2035
  • Figure 242: Australia Market Share Analysis (%) by Source, 2025 to 2035
  • Figure 243: Australia Market Share Analysis (%) by Application, 2025 to 2035
  • Figure 244: Australia Market Share Analysis (%) by Form, 2025 to 2035
  • Figure 245: Australia Market Share Analysis (%) by End User, 2025 to 2035
  • Figure 246: New Zealand Market Value Proportion Analysis, 2024
  • Figure 247: Global Vs New Zealand Growth Comparison
  • Figure 248: New Zealand Market Share Analysis (%) by Product, 2025 to 2035
  • Figure 249: New Zealand Market Share Analysis (%) by Source, 2025 to 2035
  • Figure 250: New Zealand Market Share Analysis (%) by Application, 2025 to 2035
  • Figure 251: New Zealand Market Share Analysis (%) by Form, 2025 to 2035
  • Figure 252: New Zealand Market Share Analysis (%) by End User, 2025 to 2035
  • Figure 253: Middle East & Africa Market Value (USD Million) Analysis, 2020 to 2024
  • Figure 254: Middle East & Africa Market Value (USD Million) Forecast, 2025 to 2035
  • Figure 255: Middle East & Africa Market Value Share, by Product (2025 E)
  • Figure 256: Middle East & Africa Market Value Share, by Source (2025 E)
  • Figure 257: Middle East & Africa Market Value Share, by Application (2025 E)
  • Figure 258: Middle East & Africa Market Value Share, by Form (2025 E)
  • Figure 259: Middle East & Africa Market Value Share, by End User (2025 E)
  • Figure 260: Middle East & Africa Market Value Share, by Country (2025 E)
  • Figure 261: Middle East & Africa Market Attractiveness Analysis by Product, 2025 to 2035
  • Figure 262: Middle East & Africa Market Attractiveness Analysis by Source, 2025 to 2035
  • Figure 263: Middle East & Africa Market Attractiveness Analysis by Application, 2025 to 2035
  • Figure 264: Middle East & Africa Market Attractiveness Analysis by Form, 2025 to 2035
  • Figure 265: Middle East & Africa Market Attractiveness Analysis by End User, 2025 to 2035
  • Figure 266: Middle East & Africa Market Attractiveness Analysis by Country, 2025 to 2035
  • Figure 267: GCC Countries Market Value Proportion Analysis, 2024
  • Figure 268: Global Vs GCC Countries Growth Comparison
  • Figure 269: GCC Countries Market Share Analysis (%) by Product, 2025 to 2035
  • Figure 270: GCC Countries Market Share Analysis (%) by Source, 2025 to 2035
  • Figure 271: GCC Countries Market Share Analysis (%) by Application, 2025 to 2035
  • Figure 272: GCC Countries Market Share Analysis (%) by Form, 2025 to 2035
  • Figure 273: GCC Countries Market Share Analysis (%) by End User, 2025 to 2035
  • Figure 274: Turkey Market Value Proportion Analysis, 2024
  • Figure 275: Global Vs. Turkey Growth Comparison
  • Figure 276: Turkey Market Share Analysis (%) by Product, 2025 to 2035
  • Figure 277: Turkey Market Share Analysis (%) by Source, 2025 to 2035
  • Figure 278: Turkey Market Share Analysis (%) by Application, 2025 to 2035
  • Figure 279: Turkey Market Share Analysis (%) by Form, 2025 to 2035
  • Figure 280: Turkey Market Share Analysis (%) by End User, 2025 to 2035
  • Figure 281: South Africa Market Value Proportion Analysis, 2024
  • Figure 282: Global Vs. South Africa Growth Comparison
  • Figure 283: South Africa Market Share Analysis (%) by Product, 2025 to 2035
  • Figure 284: South Africa Market Share Analysis (%) by Source, 2025 to 2035
  • Figure 285: South Africa Market Share Analysis (%) by Application, 2025 to 2035
  • Figure 286: South Africa Market Share Analysis (%) by Form, 2025 to 2035
  • Figure 287: South Africa Market Share Analysis (%) by End User, 2025 to 2035
  • Figure 288: North Africa Market Value Proportion Analysis, 2024
  • Figure 289: Global Vs North Africa Growth Comparison
  • Figure 290: North Africa Market Share Analysis (%) by Product, 2025 to 2035
  • Figure 291: North Africa Market Share Analysis (%) by Source, 2025 to 2035
  • Figure 292: North Africa Market Share Analysis (%) by Application, 2025 to 2035
  • Figure 293: North Africa Market Share Analysis (%) by Form, 2025 to 2035
  • Figure 294: North Africa Market Share Analysis (%) by End User, 2025 to 2035

Frequently Asked Questions

What is the future of global Sphingolipids industry?

The global sphingolipids industry is projected to witness CAGR of 5.1% between 2025 and 2035.

What was the worth of the global Sphingolipids industry in 2024?

The global sphingolipids industry stood at USD 664.2 million in 2024.

What will the worth of global Sphingolipids industry by 2035 end?

The global sphingolipids industry is anticipated to reach USD 1,145.6 million by 2035 end.

What is the expected CAGR for China during forecast period?

China is expected to show a CAGR of 5.5% in the assessment period.

Who are the key manufacturer of global Sphingolipids industry?

The key players operating in the global sphingolipids industry are Merck KGaA, CordenPharma International, Lipoid GmbH, Croda International Plc, Biosynth, LARODAN AB, Santa Cruz Biotechnology, Inc. and Creative Enzymes among others

Future Market Insights

Sphingolipids Market