Substations Market Size and Share Forecast Outlook 2025 to 2035

The substations market, valued at USD 132.6 billion in 2025 and projected to reach USD 181.7 billion by 2035 at a CAGR of 3.2%, demonstrates the characteristics of a mature infrastructure-driven sector. The relatively modest growth trajectory indicates that adoption is progressing steadily but without disruptive acceleration, as demand is tied to grid modernization, renewable energy integration, and replacement of aging assets rather than new large-scale deployment. The market is entering a late growth to early maturity phase within the adoption lifecycle, where incremental upgrades and digitalization are prioritized over rapid expansion.

The maturity curve highlights a progression where early adoption occurred during industrial and urban electrification, while current adoption is driven by advanced technologies such as digital substations, automation, and condition monitoring systems. With growth slowing compared to emerging energy technologies, the market shows signs of saturation in developed economies, where most substations are already deployed. In contrast, incremental adoption continues in developing regions, but the pace reflects capital-intensive nature and long lifespans of these assets.

From USD 132.6 billion in 2025 to USD 181.7 billion in 2035, the market demonstrates stable yet limited growth. The adoption lifecycle suggests that substations will remain indispensable, but future expansion will be driven primarily by modernization, efficiency upgrades, and integration of renewable generation rather than fresh deployment.
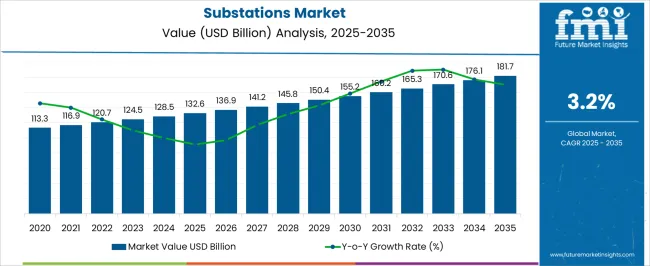
Quick Stats for Substations Market

  • Substations Market Value (2025): USD 132.6 billion
  • Substations Market Forecast Value (2035): USD 181.7 billion
  • Substations Market Forecast CAGR: 3.2%
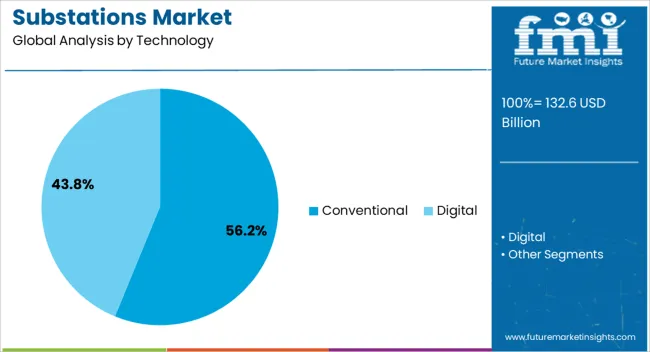
  • Leading Segment in Substations Market in 2025: Conventional (56.2%)
  • Key Growth Regions in Substations Market: North America, Asia-Pacific, Europe
  • Top Key Players in Substations Market: GE (USA), Siemens (Germany), Hitachi ABB Power Grids (Switzerland), Schneider Electric (France), NR Electric Co., Ltd. (China), Eaton (Ireland), Rockwell Automation (USA), L&T Electrical & Automation (India), Efacec (Portugal), Emerson (USA), Belden (USA), Texas Instruments Incorporated (USA)

Substations Market Market Value Analysis

Substations Market Key Takeaways

Metric Value
Substations Market Estimated Value in (2025 E) USD 132.6 billion
Substations Market Forecast Value in (2035 F) USD 181.7 billion
Forecast CAGR (2025 to 2035) 3.2%

The substations market forms a critical part of the global power infrastructure industry, reflecting its essential role in electricity transmission and distribution networks. Within the broader power equipment and grid solutions sector, substations account for nearly 8.5%, highlighting their importance in maintaining grid stability and energy reliability. In the electrical utility infrastructure domain, their share is around 7.3%, supported by ongoing grid modernization and expansion projects. Across the renewable energy integration and smart grid ecosystem, the market holds about 6.2%, underlining its role in managing variable generation. Within the high voltage equipment and power system automation space, substations represent approximately 5.5%, demonstrating their link to digital control technologies. In the overall electrical infrastructure investment segment, substations secure about 4.9%, indicating their contribution to capital-intensive power system development. Recent developments in the market emphasize automation, digitalization, and sustainable design.

Gas-insulated substations are gaining wider adoption due to space-saving layouts and enhanced safety in urban and industrial areas. Hybrid substations that integrate digital monitoring, communication protocols, and predictive maintenance tools are emerging as a standard. The deployment of digital substations with IoT-enabled sensors and cloud-based supervisory systems is transforming operational efficiency. Manufacturers are focusing on alternatives to SF6 gas to reduce environmental impact, aligning with global emission reduction initiatives. Investment in renewable-focused substations is rising, with advanced configurations designed for solar and wind integration. The modular and prefabricated substations are being introduced to accelerate deployment timelines. 

Why is the Substations Market Growing?

The substations market is experiencing steady expansion due to the growing global emphasis on upgrading aging electrical infrastructure and integrating decentralized power sources. Increasing demand for uninterrupted electricity supply, coupled with rising investments in renewable energy integration, is stimulating the deployment of modern substations across transmission and distribution networks. Governments and utilities are prioritizing infrastructure that enables real-time monitoring, grid flexibility, and energy efficiency, which is contributing to the adoption of advanced substation technologies.

The transition toward smart grid frameworks is further boosting demand for substations capable of handling complex data, variable loads, and distributed generation. Strong policy support for reducing transmission losses and improving grid stability is leading to substantial investment in both new substation construction and the digitalization of existing ones.

Furthermore, rising urbanization and industrial expansion across emerging markets are accelerating the need for reliable electricity delivery systems As energy demand grows and power systems become more dynamic, the substations market is positioned for long-term growth driven by modernization, automation, and digital connectivity.

Segmental Analysis

The substations market is segmented by technology, component, application, connectivity, voltage level, end use, category, and geographic regions. By technology, substations market is divided into Conventional and Digital. In terms of component, substations market is classified into Electrical System, Substation Automation System, Communication Network, Monitoring & Control System, and Others. Based on application, substations market is segmented into Transmission and Distribution. By connectivity, substations market is segmented into > 110 kV to ≤ 220 kV, ≤ 33 kV, > 33 kV to ≤ 110 kV, > 220 kV to ≤ 550 kV, and > 550 kV. By voltage level, substations market is segmented into High, Medium, and Low. By end use, substations market is segmented into Utility and Industrial. By category, substations market is segmented into New and Refurbished. Regionally, the substations industry is classified into North America, Latin America, Western Europe, Eastern Europe, Balkan & Baltic Countries, Russia & Belarus, Central Asia, East Asia, South Asia & Pacific, and the Middle East & Africa.
Insights into the Conventional Technology Segment

Substations Market Analysis By Technology

The conventional technology segment is projected to hold 56.2% of the substations market revenue share in 2025, positioning it as the leading technology type. This dominance is being supported by the widespread presence of legacy infrastructure across global power grids, where upgrades and maintenance continue to rely on established conventional systems. Conventional substations are known for their reliability, cost-effectiveness, and simplicity of operation, which makes them a preferred choice in regions where smart grid implementation is still in its early stages.

The segment benefits from long-standing technical familiarity among utilities and service providers, allowing for easier deployment and maintenance in both urban and rural networks. Additionally, the continued expansion of traditional power generation assets, particularly in developing countries, reinforces the demand for conventional substations.

While digital technologies are gaining ground, the robust performance, proven standards, and compatibility of conventional systems with existing grid architecture continue to support their significant market share. As energy infrastructure expands, this segment is expected to remain relevant for foundational grid support and dependable power delivery.
Insights into the Electrical System Component Segment

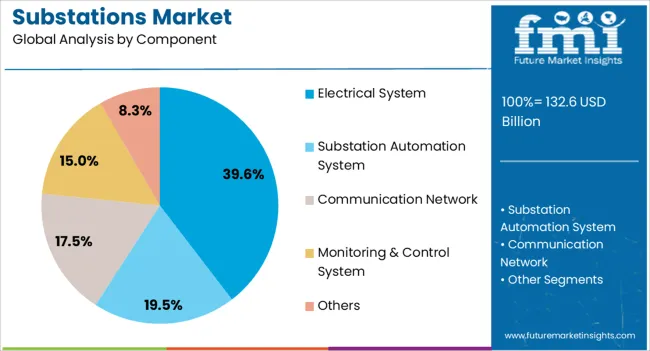
Substations Market Analysis By Component

The electrical system component segment is anticipated to account for 39.6% of the substations market revenue share in 2025, making it the leading component category. This segment’s growth is being driven by the central role of transformers, switchgear, circuit breakers, and other core electrical components in ensuring efficient and safe power flow within substations. As substations serve as critical nodes in power transmission and distribution, the demand for reliable and high-performing electrical systems is growing significantly.

Ongoing upgrades to existing infrastructure and the addition of new transmission lines are further boosting requirements for advanced electrical components that can manage higher voltages and improved load handling. The evolution of substation designs to include automation, digital monitoring, and condition-based maintenance is enhancing the complexity and importance of electrical systems. Utilities and industrial users are increasingly investing in quality components to reduce system losses, extend equipment life, and comply with performance standards.
Insights into the Transmission Application Segment

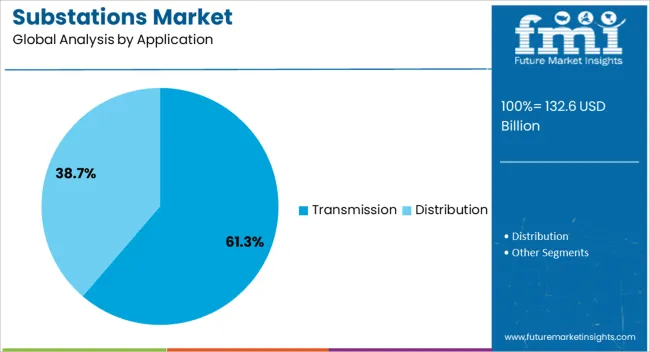
Substations Market Analysis By Application

The transmission segment is expected to contribute 61.3% of the substations market revenue share in 2025, making it the leading application area. This leadership is being driven by the global focus on expanding and modernizing transmission infrastructure to support growing energy demand and integrate large-scale renewable energy sources. Substations in transmission networks play a critical role in stepping up or stepping down voltages and ensuring stable, long-distance power delivery.

The rise of interregional transmission projects, along with the need to connect remote wind and solar farms to the main grid, is reinforcing demand for high-capacity transmission substations. Increasing adoption of ultra-high voltage and high-voltage direct current technologies is also contributing to the segment’s growth.

Governments and utilities are prioritizing investments in transmission to reduce congestion, improve reliability, and enhance cross-border electricity trade. As the backbone of the power grid, transmission substations are positioned to remain a critical area of infrastructure development, supporting energy transition and future grid resilience across global markets.

What are the Drivers, Restraints, and Key Trends of the Substations Market?

The market plays a critical role in global power transmission and distribution infrastructure, enabling electricity to be stepped up or stepped down efficiently for reliable grid operations. Substations integrate switchgear, transformers, circuit breakers, and protective relays to ensure continuous power flow while managing load variations and preventing outages. Rising electricity consumption, grid modernization initiatives, renewable energy integration, and the expansion of smart grids are driving demand.

Technological advancements such as digital substations, advanced monitoring systems, and automation are reshaping market dynamics. Investment flows from both governments and private utilities are supporting upgrades and greenfield projects.

Expansion of Transmission and Distribution Infrastructure

The market is being influenced strongly by the expansion of transmission and distribution networks worldwide. Growing electricity consumption, particularly in industrial and urban centers, has necessitated upgrades in existing substations as well as the construction of new facilities. Demand for high voltage substations has increased due to the need for efficient long-distance transmission. Distribution substations are also being widely deployed in fast-growing residential and commercial zones. Investments by utilities in strengthening grid resilience and ensuring stable supply have created opportunities for advanced equipment integration. Regional interconnection projects and cross-border electricity trade further increase the requirement for reliable substations. This expansion trend highlights the role of substations as critical nodes in ensuring uninterrupted energy delivery.

Integration of Renewable Energy Sources into Grids

With renewable energy capacity being scaled globally, substations are playing a pivotal role in grid integration. Solar and wind farms require substations equipped with modern switchgear and advanced monitoring systems to manage variable generation and ensure stable transmission. High voltage substations are increasingly being designed for renewable integration with flexible configurations and digital controls. Hybrid substations are also being deployed where renewable sources are combined with conventional power. Grid operators are investing in smart substations that provide real-time data analytics for balancing supply and demand fluctuations caused by renewables. This integration trend has not only increased demand for new substations but also accelerated modernization of aging infrastructure to meet decarbonization targets.

Adoption of Digital Substations and Automation

The shift toward digital substations have emerged as a transformative market driver. Digital substations utilize intelligent electronic devices, sensors, and communication protocols for automation and real-time monitoring. They enable predictive maintenance, enhance fault detection, and optimize grid efficiency. Utilities are replacing traditional substations with digital solutions to reduce operational costs and improve reliability. Cybersecurity solutions are also being incorporated to protect digital assets. This adoption has been accelerated by the need for smart grid development and integration of distributed energy resources. Advanced digital substations support adaptive grid operations, enabling flexible load management and demand response. This trend emphasizes technology-driven growth and a long-term transformation of the global substation landscape.

Capital Cost Challenges and Cybersecurity Risks

Despite strong growth prospects, the market faces challenges related to high capital requirements and cybersecurity concerns. The construction and upgrading of substations involve significant investment in land acquisition, equipment, and skilled labor. Smaller utilities and developing regions face difficulties in securing adequate funding, slowing adoption of advanced solutions. With increasing digitization, substations have become vulnerable to cyberattacks that threaten grid stability. Cyber intrusions can disrupt protective systems, leading to large-scale outages. Compliance with regulatory frameworks and investment in cybersecurity infrastructure are necessary to mitigate these risks. These challenges highlight the importance of financial planning, robust governance, and technological safeguards in securing long-term market growth.
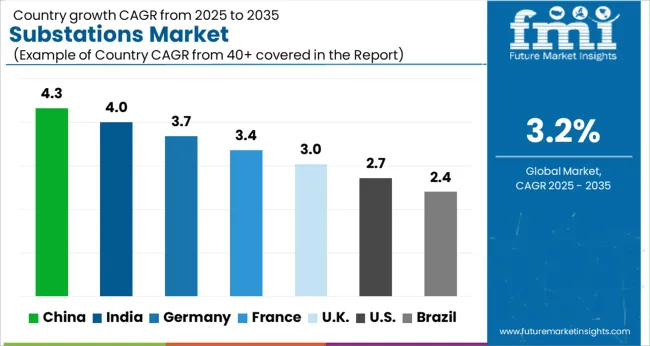
Analysis of Substations Market By Key Countries

Substations Market Cagr Analysis By Country

Country CAGR
China 4.3%
India 4.0%
Germany 3.7%
France 3.4%
UK 3.0%
USA 2.7%
Brazil 2.4%

The market is projected to grow at a CAGR of 3.2% from 2025 to 2035, influenced by rising electricity demand and grid modernization programs. India registered 4.0%, supported by investments in transmission and distribution upgrades. Germany accounted for 3.7%, with progress linked to renewable energy integration and advanced grid technologies. China led with 4.3%, highlighting its large-scale power infrastructure projects. The United Kingdom stood at 3.0%, reflecting replacement demand for aging substations. The United States followed at 2.7%, driven by modernization and resilience-focused projects. Together, these countries represent the leading centers advancing, producing, and innovating in substation development and deployment. This report includes insights on 40+ countries; the top markets are shown here for reference.

Expansion Outlook of Substations Market in China

China is projected to advance at a CAGR of 4.3%, supported by large scale grid modernization and high voltage transmission projects. Significant investments in smart grid infrastructure and rural electrification programs are reinforcing demand. Digital substations equipped with intelligent control systems and IoT sensors are increasingly adopted to enhance reliability. Domestic manufacturers are focusing on high capacity transformers and modular substations to meet rising electricity requirements from industrial and urban clusters.

  • China invested over USD 70 billion in grid infrastructure upgrades in 2023.
  • Digital substation adoption increased by nearly 20% year on year.
  • Companies like State Grid Corporation and TBEA expanded modular substation manufacturing capacity.

Market Dynamics of Substations in India

India is expected to grow at a CAGR of 4.0%, driven by expansion of renewable energy integration and demand for reliable distribution networks. Government initiatives such as Green Energy Corridors and transmission upgrades have boosted installation of new substations. Adoption of GIS technology is increasing due to land constraints and operational efficiency needs. Domestic and international players are supplying compact and automated substations that cater to both rural electrification and industrial requirements.
  • India commissioned more than 300 new substations under the Green Energy Corridor program in 2023.
  • Gas insulated substations accounted for nearly 35% of new installations.
  • Companies such as ABB India, Siemens, and BHEL strengthened product offerings for domestic projects.

Growth Analysis of Substations Market in Germany

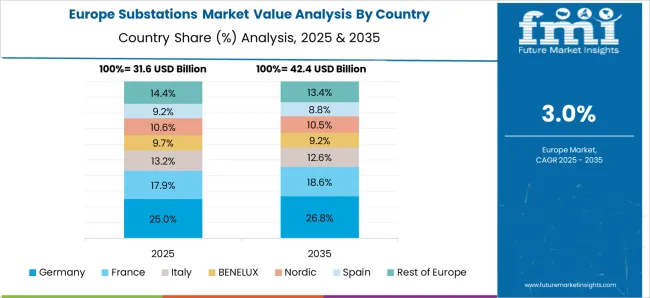
Substations Market Europe Country Market Share Analysis, 2025 & 2035

Germany is forecast to expand at a CAGR of 3.7%, reinforced by the energy transition and integration of offshore and onshore wind capacity. The focus has shifted toward digital substations with advanced monitoring and control systems to balance distributed energy resources. Investments in high voltage direct current substations have been prioritized to support cross border power flows within Europe. Domestic manufacturers emphasize efficiency and compliance with strict EU energy regulations.

  • Germany invested nearly EUR 6 billion in transmission and substation upgrades in 2023.
  • Over 40% of new substations integrated renewable energy sources directly.
  • Siemens Energy and E.ON expanded digital substation pilot projects across northern Germany.

Future Outlook of Substations Market in the United Kingdom

The United Kingdom is projected to record a CAGR of 3.0%, supported by offshore wind integration and modernization of aging distribution networks. Emphasis is placed on compact and automated GIS substations to reduce land footprint and improve operational safety. Financing support from government programs accelerates upgrades of legacy substations across the country. Utility companies are working with global technology providers to introduce predictive maintenance and digital twin solutions.
  • More than 25% of substations in the UK underwent digital upgrades in 2023.
  • Offshore wind projects contributed to over 30% of new substation capacity.
  • National Grid partnered with Hitachi Energy and GE to enhance advanced control systems.

Market Trends of Substations in the United States

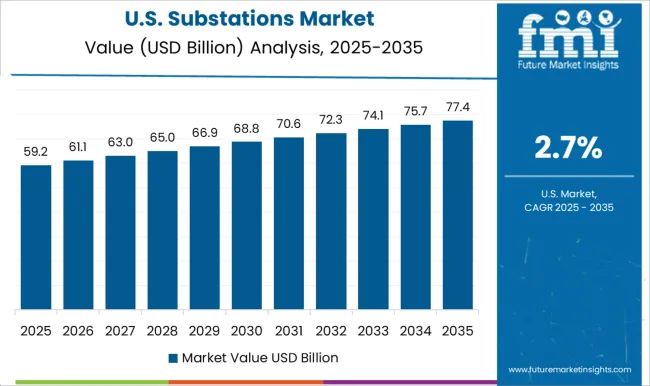
Substations Market Country Value Analysis

The United States is projected to expand at a CAGR of 2.7%, influenced by grid reliability concerns and modernization of transmission networks. Significant demand comes from replacement of aging infrastructure and integration of solar and wind generation. Utility operators are increasingly adopting smart substations with advanced communication and automation features. Federal funding initiatives and public private partnerships are stimulating regional investments in substation upgrades.
  • The U S Department of Energy allocated over USD 12 billion for grid modernization in 2023.
  • Smart substations accounted for nearly 28% of new installations.
  • Companies like General Electric, Eaton, and Schneider Electric expanded service offerings for digital substation retrofits.

Competitive Landscape of Substations Market

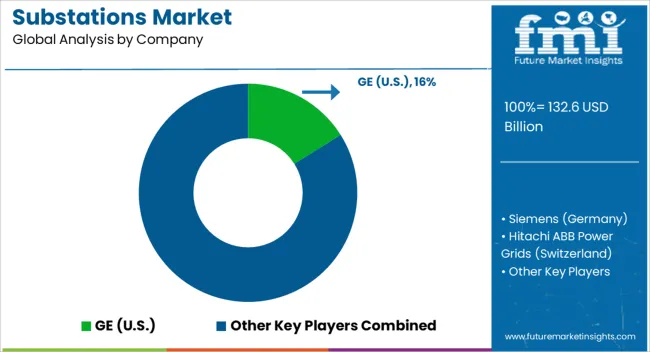
Substations Market Analysis By Company

The market is characterized by a strong presence of global electrical equipment manufacturers, automation specialists, and regional power solution providers. Multinational leaders such as GE, Siemens, Hitachi ABB Power Grids, and Schneider Electric dominate through comprehensive portfolios covering high, medium, and low-voltage substations with advanced digital monitoring and automation technologies. Eaton, Rockwell Automation, and Emerson strengthen the market with expertise in intelligent control systems, energy management, and smart grid integration.

Regional players such as L&T Electrical & Automation in India, Efacec in Portugal, and NR Electric in China focus on scalable substation projects tailored to emerging economies, supporting grid reliability and modernization efforts. Technology enablers like Belden and Texas Instruments Incorporated provide critical components such as communication infrastructure, sensors, and semiconductors that enable digital substations and predictive maintenance. Competition is increasingly defined by the transition to digital substations, integration of renewable energy, and grid automation. Companies are prioritizing cybersecurity solutions, IoT-enabled monitoring, and modular substation designs. Strategic partnerships, R&D in energy storage integration, and emphasis on decarbonization-driven grid upgrades are shaping the long-term competitive dynamics of this market.

Key Players in the Substations Market

  • GE (USA)
  • Siemens (Germany)
  • Hitachi ABB Power Grids (Switzerland)
  • Schneider Electric (France)
  • NR Electric Co., Ltd. (China)
  • Eaton (Ireland)
  • Rockwell Automation (USA)
  • L&T Electrical & Automation (India)
  • Efacec (Portugal)
  • Emerson (USA)
  • Belden (USA)
  • Texas Instruments Incorporated (USA)

Scope of the Report

Item Value
Quantitative Units USD 132.6 Billion
Technology Conventional and Digital
Component Electrical System, Substation Automation System, Communication Network, Monitoring & Control System, and Others
Application Transmission and Distribution
Connectivity > 110 kV to ≤ 220 kV, ≤ 33 kV, > 33 kV to ≤ 110 kV, > 220 kV to ≤ 550 kV, and > 550 kV
Voltage Level High, Medium, and Low
End Use Utility and Industrial
Category New and Refurbished
Regions Covered North America, Europe, Asia-Pacific, Latin America, Middle East & Africa
Country Covered United States, Canada, Germany, France, United Kingdom, China, Japan, India, Brazil, South Africa
Key Companies Profiled GE (USA), Siemens (Germany), Hitachi ABB Power Grids (Switzerland), Schneider Electric (France), NR Electric Co., Ltd. (China), Eaton (Ireland), Rockwell Automation (USA), L&T Electrical & Automation (India), Efacec (Portugal), Emerson (USA), Belden (USA), and Texas Instruments Incorporated (USA)
Additional Attributes Dollar sales by substation type and application, demand dynamics across power transmission, distribution, and industrial sectors, regional trends in grid modernization and electrification, innovation in digital monitoring, automation, and modular design, environmental impact of land use, equipment disposal, and energy efficiency, and emerging use cases in renewable integration, smart grids, and microgrid deployment.

Substations Market by Segments

Technology:

  • Conventional
  • Digital

Component:

  • Electrical System
  • Substation Automation System
  • Communication Network
  • Monitoring & Control System
  • Others

Application:

  • Transmission
  • Distribution

Connectivity:

  • > 110 kV to ≤ 220 kV
  • ≤ 33 kV
  • > 33 kV to ≤ 110 kV
  • > 220 kV to ≤ 550 kV
  • > 550 kV

Voltage Level:

  • High
  • Medium
  • Low

Region:

  • North America
    • USA
    • Canada
    • Mexico
  • Latin America
    • Brazil
    • Chile
    • Rest of Latin America
  • Western Europe
    • Germany
    • UK
    • Italy
    • Spain
    • France
    • Nordic
    • BENELUX
    • Rest of Western Europe
  • Eastern Europe
    • Russia
    • Poland
    • Hungary
    • Balkan & Baltic
    • Rest of Eastern Europe
  • East Asia
    • China
    • Japan
    • South Korea
  • South Asia and Pacific
    • India
    • ASEAN
    • Australia & New Zealand
    • Rest of South Asia and Pacific
  • Middle East & Africa
    • Kingdom of Saudi Arabia
    • Other GCC Countries
    • Turkiye
    • South Africa
    • Other African Union
    • Rest of Middle East & Africa

Table of Content

  1. Executive Summary
    • Global Market Outlook
    • Demand-side Trends
    • Supply-side Trends
    • Technology Roadmap Analysis
    • Analysis and Recommendations
  2. Market Overview
    • Market Coverage / Taxonomy
    • Market Definition / Scope / Limitations
  3. Market Background
    • Market Dynamics
      • Drivers
      • Restraints
      • Opportunity
      • Trends
    • Scenario Forecast
      • Demand in Optimistic Scenario
      • Demand in Likely Scenario
      • Demand in Conservative Scenario
    • Opportunity Map Analysis
    • Product Life Cycle Analysis
    • Supply Chain Analysis
    • Investment Feasibility Matrix
    • Value Chain Analysis
    • PESTLE and Porter’s Analysis
    • Regulatory Landscape
    • Regional Parent Market Outlook
    • Production and Consumption Statistics
    • Import and Export Statistics
  4. Global Substations Market Analysis 2020-2024 and Forecast, 2025-2035
    • Historical Market Size Value (USD Mn) Analysis, 2020-2024
    • Current and Future Market Size Value (USD Mn) Projections, 2025-2035
      • Y-o-Y Growth Trend Analysis
      • Absolute $ Opportunity Analysis
  5. Global Substations Market Pricing Analysis 2020-2024 and Forecast 2025-2035
  6. Global Substations Market Analysis 2020-2024 and Forecast 2025-2035, By Technology
    • Introduction / Key Findings
    • Historical Market Size Value (USD Mn) Analysis By Technology , 2020-2024
    • Current and Future Market Size Value (USD Mn) Analysis and Forecast By Technology , 2025-2035
      • Conventional
      • Digital
    • Y-o-Y Growth Trend Analysis By Technology , 2020-2024
    • Absolute $ Opportunity Analysis By Technology , 2025-2035
  7. Global Substations Market Analysis 2020-2024 and Forecast 2025-2035, By Component
    • Introduction / Key Findings
    • Historical Market Size Value (USD Mn) Analysis By Component, 2020-2024
    • Current and Future Market Size Value (USD Mn) Analysis and Forecast By Component, 2025-2035
      • Electrical System
      • Substation Automation System
      • Communication Network
      • Monitoring & Control System
      • Others
    • Y-o-Y Growth Trend Analysis By Component, 2020-2024
    • Absolute $ Opportunity Analysis By Component, 2025-2035
  8. Global Substations Market Analysis 2020-2024 and Forecast 2025-2035, By Application
    • Introduction / Key Findings
    • Historical Market Size Value (USD Mn) Analysis By Application, 2020-2024
    • Current and Future Market Size Value (USD Mn) Analysis and Forecast By Application, 2025-2035
      • Transmission
      • Distribution
    • Y-o-Y Growth Trend Analysis By Application, 2020-2024
    • Absolute $ Opportunity Analysis By Application, 2025-2035
  9. Global Substations Market Analysis 2020-2024 and Forecast 2025-2035, By Connectivity
    • Introduction / Key Findings
    • Historical Market Size Value (USD Mn) Analysis By Connectivity, 2020-2024
    • Current and Future Market Size Value (USD Mn) Analysis and Forecast By Connectivity, 2025-2035
      • > 110 kV to ≤ 220 kV
      • ≤ 33 kV
      • > 33 kV to ≤ 110 kV
      • > 220 kV to ≤ 550 kV
      • > 550 kV
    • Y-o-Y Growth Trend Analysis By Connectivity, 2020-2024
    • Absolute $ Opportunity Analysis By Connectivity, 2025-2035
  10. Global Substations Market Analysis 2020-2024 and Forecast 2025-2035, By Voltage Level
    • Introduction / Key Findings
    • Historical Market Size Value (USD Mn) Analysis By Voltage Level, 2020-2024
    • Current and Future Market Size Value (USD Mn) Analysis and Forecast By Voltage Level, 2025-2035
      • High
      • Medium
      • Low
    • Y-o-Y Growth Trend Analysis By Voltage Level, 2020-2024
    • Absolute $ Opportunity Analysis By Voltage Level, 2025-2035
  11. Global Substations Market Analysis 2020-2024 and Forecast 2025-2035, By End Use
    • Introduction / Key Findings
    • Historical Market Size Value (USD Mn) Analysis By End Use, 2020-2024
    • Current and Future Market Size Value (USD Mn) Analysis and Forecast By End Use, 2025-2035
      • Utility
      • Industrial
    • Y-o-Y Growth Trend Analysis By End Use, 2020-2024
    • Absolute $ Opportunity Analysis By End Use, 2025-2035
  12. Global Substations Market Analysis 2020-2024 and Forecast 2025-2035, By Category
    • Introduction / Key Findings
    • Historical Market Size Value (USD Mn) Analysis By Category, 2020-2024
    • Current and Future Market Size Value (USD Mn) Analysis and Forecast By Category, 2025-2035
      • New
      • Refurbished
    • Y-o-Y Growth Trend Analysis By Category, 2020-2024
    • Absolute $ Opportunity Analysis By Category, 2025-2035
  13. Global Substations Market Analysis 2020-2024 and Forecast 2025-2035, By Region
    • Introduction
    • Historical Market Size Value (USD Mn) Analysis By Region, 2020-2024
    • Current Market Size Value (USD Mn) Analysis and Forecast By Region, 2025-2035
      • North America
      • Latin America
      • Western Europe
      • Eastern Europe
      • East Asia
      • South Asia and Pacific
      • Middle East & Africa
    • Market Attractiveness Analysis By Region
  14. North America Substations Market Analysis 2020-2024 and Forecast 2025-2035, By Country
    • Historical Market Size Value (USD Mn) Trend Analysis By Market Taxonomy, 2020-2024
    • Market Size Value (USD Mn) Forecast By Market Taxonomy, 2025-2035
      • By Country
        • USA
        • Canada
        • Mexico
      • By Technology
      • By Component
      • By Application
      • By Connectivity
      • By Voltage Level
      • By End Use
      • By Category
    • Market Attractiveness Analysis
      • By Country
      • By Technology
      • By Component
      • By Application
      • By Connectivity
      • By Voltage Level
      • By End Use
      • By Category
    • Key Takeaways
  15. Latin America Substations Market Analysis 2020-2024 and Forecast 2025-2035, By Country
    • Historical Market Size Value (USD Mn) Trend Analysis By Market Taxonomy, 2020-2024
    • Market Size Value (USD Mn) Forecast By Market Taxonomy, 2025-2035
      • By Country
        • Brazil
        • Chile
        • Rest of Latin America
      • By Technology
      • By Component
      • By Application
      • By Connectivity
      • By Voltage Level
      • By End Use
      • By Category
    • Market Attractiveness Analysis
      • By Country
      • By Technology
      • By Component
      • By Application
      • By Connectivity
      • By Voltage Level
      • By End Use
      • By Category
    • Key Takeaways
  16. Western Europe Substations Market Analysis 2020-2024 and Forecast 2025-2035, By Country
    • Historical Market Size Value (USD Mn) Trend Analysis By Market Taxonomy, 2020-2024
    • Market Size Value (USD Mn) Forecast By Market Taxonomy, 2025-2035
      • By Country
        • Germany
        • UK
        • Italy
        • Spain
        • France
        • Nordic
        • BENELUX
        • Rest of Western Europe
      • By Technology
      • By Component
      • By Application
      • By Connectivity
      • By Voltage Level
      • By End Use
      • By Category
    • Market Attractiveness Analysis
      • By Country
      • By Technology
      • By Component
      • By Application
      • By Connectivity
      • By Voltage Level
      • By End Use
      • By Category
    • Key Takeaways
  17. Eastern Europe Substations Market Analysis 2020-2024 and Forecast 2025-2035, By Country
    • Historical Market Size Value (USD Mn) Trend Analysis By Market Taxonomy, 2020-2024
    • Market Size Value (USD Mn) Forecast By Market Taxonomy, 2025-2035
      • By Country
        • Russia
        • Poland
        • Hungary
        • Balkan & Baltic
        • Rest of Eastern Europe
      • By Technology
      • By Component
      • By Application
      • By Connectivity
      • By Voltage Level
      • By End Use
      • By Category
    • Market Attractiveness Analysis
      • By Country
      • By Technology
      • By Component
      • By Application
      • By Connectivity
      • By Voltage Level
      • By End Use
      • By Category
    • Key Takeaways
  18. East Asia Substations Market Analysis 2020-2024 and Forecast 2025-2035, By Country
    • Historical Market Size Value (USD Mn) Trend Analysis By Market Taxonomy, 2020-2024
    • Market Size Value (USD Mn) Forecast By Market Taxonomy, 2025-2035
      • By Country
        • China
        • Japan
        • South Korea
      • By Technology
      • By Component
      • By Application
      • By Connectivity
      • By Voltage Level
      • By End Use
      • By Category
    • Market Attractiveness Analysis
      • By Country
      • By Technology
      • By Component
      • By Application
      • By Connectivity
      • By Voltage Level
      • By End Use
      • By Category
    • Key Takeaways
  19. South Asia and Pacific Substations Market Analysis 2020-2024 and Forecast 2025-2035, By Country
    • Historical Market Size Value (USD Mn) Trend Analysis By Market Taxonomy, 2020-2024
    • Market Size Value (USD Mn) Forecast By Market Taxonomy, 2025-2035
      • By Country
        • India
        • ASEAN
        • Australia & New Zealand
        • Rest of South Asia and Pacific
      • By Technology
      • By Component
      • By Application
      • By Connectivity
      • By Voltage Level
      • By End Use
      • By Category
    • Market Attractiveness Analysis
      • By Country
      • By Technology
      • By Component
      • By Application
      • By Connectivity
      • By Voltage Level
      • By End Use
      • By Category
    • Key Takeaways
  20. Middle East & Africa Substations Market Analysis 2020-2024 and Forecast 2025-2035, By Country
    • Historical Market Size Value (USD Mn) Trend Analysis By Market Taxonomy, 2020-2024
    • Market Size Value (USD Mn) Forecast By Market Taxonomy, 2025-2035
      • By Country
        • Kingdom of Saudi Arabia
        • Other GCC Countries
        • Turkiye
        • South Africa
        • Other African Union
        • Rest of Middle East & Africa
      • By Technology
      • By Component
      • By Application
      • By Connectivity
      • By Voltage Level
      • By End Use
      • By Category
    • Market Attractiveness Analysis
      • By Country
      • By Technology
      • By Component
      • By Application
      • By Connectivity
      • By Voltage Level
      • By End Use
      • By Category
    • Key Takeaways
  21. Key Countries Substations Market Analysis
    • USA
      • Pricing Analysis
      • Market Share Analysis, 2024
        • By Technology
        • By Component
        • By Application
        • By Connectivity
        • By Voltage Level
        • By End Use
        • By Category
    • Canada
      • Pricing Analysis
      • Market Share Analysis, 2024
        • By Technology
        • By Component
        • By Application
        • By Connectivity
        • By Voltage Level
        • By End Use
        • By Category
    • Mexico
      • Pricing Analysis
      • Market Share Analysis, 2024
        • By Technology
        • By Component
        • By Application
        • By Connectivity
        • By Voltage Level
        • By End Use
        • By Category
    • Brazil
      • Pricing Analysis
      • Market Share Analysis, 2024
        • By Technology
        • By Component
        • By Application
        • By Connectivity
        • By Voltage Level
        • By End Use
        • By Category
    • Chile
      • Pricing Analysis
      • Market Share Analysis, 2024
        • By Technology
        • By Component
        • By Application
        • By Connectivity
        • By Voltage Level
        • By End Use
        • By Category
    • Germany
      • Pricing Analysis
      • Market Share Analysis, 2024
        • By Technology
        • By Component
        • By Application
        • By Connectivity
        • By Voltage Level
        • By End Use
        • By Category
    • UK
      • Pricing Analysis
      • Market Share Analysis, 2024
        • By Technology
        • By Component
        • By Application
        • By Connectivity
        • By Voltage Level
        • By End Use
        • By Category
    • Italy
      • Pricing Analysis
      • Market Share Analysis, 2024
        • By Technology
        • By Component
        • By Application
        • By Connectivity
        • By Voltage Level
        • By End Use
        • By Category
    • Spain
      • Pricing Analysis
      • Market Share Analysis, 2024
        • By Technology
        • By Component
        • By Application
        • By Connectivity
        • By Voltage Level
        • By End Use
        • By Category
    • France
      • Pricing Analysis
      • Market Share Analysis, 2024
        • By Technology
        • By Component
        • By Application
        • By Connectivity
        • By Voltage Level
        • By End Use
        • By Category
    • India
      • Pricing Analysis
      • Market Share Analysis, 2024
        • By Technology
        • By Component
        • By Application
        • By Connectivity
        • By Voltage Level
        • By End Use
        • By Category
    • ASEAN
      • Pricing Analysis
      • Market Share Analysis, 2024
        • By Technology
        • By Component
        • By Application
        • By Connectivity
        • By Voltage Level
        • By End Use
        • By Category
    • Australia & New Zealand
      • Pricing Analysis
      • Market Share Analysis, 2024
        • By Technology
        • By Component
        • By Application
        • By Connectivity
        • By Voltage Level
        • By End Use
        • By Category
    • China
      • Pricing Analysis
      • Market Share Analysis, 2024
        • By Technology
        • By Component
        • By Application
        • By Connectivity
        • By Voltage Level
        • By End Use
        • By Category
    • Japan
      • Pricing Analysis
      • Market Share Analysis, 2024
        • By Technology
        • By Component
        • By Application
        • By Connectivity
        • By Voltage Level
        • By End Use
        • By Category
    • South Korea
      • Pricing Analysis
      • Market Share Analysis, 2024
        • By Technology
        • By Component
        • By Application
        • By Connectivity
        • By Voltage Level
        • By End Use
        • By Category
    • Russia
      • Pricing Analysis
      • Market Share Analysis, 2024
        • By Technology
        • By Component
        • By Application
        • By Connectivity
        • By Voltage Level
        • By End Use
        • By Category
    • Poland
      • Pricing Analysis
      • Market Share Analysis, 2024
        • By Technology
        • By Component
        • By Application
        • By Connectivity
        • By Voltage Level
        • By End Use
        • By Category
    • Hungary
      • Pricing Analysis
      • Market Share Analysis, 2024
        • By Technology
        • By Component
        • By Application
        • By Connectivity
        • By Voltage Level
        • By End Use
        • By Category
    • Kingdom of Saudi Arabia
      • Pricing Analysis
      • Market Share Analysis, 2024
        • By Technology
        • By Component
        • By Application
        • By Connectivity
        • By Voltage Level
        • By End Use
        • By Category
    • Turkiye
      • Pricing Analysis
      • Market Share Analysis, 2024
        • By Technology
        • By Component
        • By Application
        • By Connectivity
        • By Voltage Level
        • By End Use
        • By Category
    • South Africa
      • Pricing Analysis
      • Market Share Analysis, 2024
        • By Technology
        • By Component
        • By Application
        • By Connectivity
        • By Voltage Level
        • By End Use
        • By Category
  22. Market Structure Analysis
    • Competition Dashboard
    • Competition Benchmarking
    • Market Share Analysis of Top Players
      • By Regional
      • By Technology
      • By Component
      • By Application
      • By Connectivity
      • By Voltage Level
      • By End Use
      • By Category
  23. Competition Analysis
    • Competition Deep Dive
      • GE (USA)
        • Overview
        • Product Portfolio
        • Profitability by Market Segments (Product/Age /Sales Channel/Region)
        • Sales Footprint
        • Strategy Overview
          • Marketing Strategy
          • Product Strategy
          • Channel Strategy
      • Siemens (Germany)
      • Hitachi ABB Power Grids (Switzerland)
      • Schneider Electric (France)
      • NR Electric Co., Ltd. (China)
      • Eaton (Ireland)
      • Rockwell Automation (USA)
      • L&T Electrical & Automation (India)
      • Efacec (Portugal)
      • Emerson (USA)
      • Belden (USA)
      • Texas Instruments Incorporated (USA)
  24. Assumptions & Acronyms Used
  25. Research Methodology

List of Tables

  • Table 1: Global Substations Market Value (USD Mn) Forecast by Region, 2020-2035
  • Table 2: Global Substations Market Value (USD Mn) Forecast by Technology , 2020-2035
  • Table 3: Global Substations Market Value (USD Mn) Forecast by Component, 2020-2035
  • Table 4: Global Substations Market Value (USD Mn) Forecast by Application, 2020-2035
  • Table 5: Global Substations Market Value (USD Mn) Forecast by Connectivity, 2020-2035
  • Table 6: Global Substations Market Value (USD Mn) Forecast by Voltage Level, 2020-2035
  • Table 7: Global Substations Market Value (USD Mn) Forecast by End Use, 2020-2035
  • Table 8: Global Substations Market Value (USD Mn) Forecast by Category, 2020-2035
  • Table 9: North America Substations Market Value (USD Mn) Forecast by Country, 2020-2035
  • Table 10: North America Substations Market Value (USD Mn) Forecast by Technology , 2020-2035
  • Table 11: North America Substations Market Value (USD Mn) Forecast by Component, 2020-2035
  • Table 12: North America Substations Market Value (USD Mn) Forecast by Application, 2020-2035
  • Table 13: North America Substations Market Value (USD Mn) Forecast by Connectivity, 2020-2035
  • Table 14: North America Substations Market Value (USD Mn) Forecast by Voltage Level, 2020-2035
  • Table 15: North America Substations Market Value (USD Mn) Forecast by End Use, 2020-2035
  • Table 16: North America Substations Market Value (USD Mn) Forecast by Category, 2020-2035
  • Table 17: Latin America Substations Market Value (USD Mn) Forecast by Country, 2020-2035
  • Table 18: Latin America Substations Market Value (USD Mn) Forecast by Technology , 2020-2035
  • Table 19: Latin America Substations Market Value (USD Mn) Forecast by Component, 2020-2035
  • Table 20: Latin America Substations Market Value (USD Mn) Forecast by Application, 2020-2035
  • Table 21: Latin America Substations Market Value (USD Mn) Forecast by Connectivity, 2020-2035
  • Table 22: Latin America Substations Market Value (USD Mn) Forecast by Voltage Level, 2020-2035
  • Table 23: Latin America Substations Market Value (USD Mn) Forecast by End Use, 2020-2035
  • Table 24: Latin America Substations Market Value (USD Mn) Forecast by Category, 2020-2035
  • Table 25: Western Europe Substations Market Value (USD Mn) Forecast by Country, 2020-2035
  • Table 26: Western Europe Substations Market Value (USD Mn) Forecast by Technology , 2020-2035
  • Table 27: Western Europe Substations Market Value (USD Mn) Forecast by Component, 2020-2035
  • Table 28: Western Europe Substations Market Value (USD Mn) Forecast by Application, 2020-2035
  • Table 29: Western Europe Substations Market Value (USD Mn) Forecast by Connectivity, 2020-2035
  • Table 30: Western Europe Substations Market Value (USD Mn) Forecast by Voltage Level, 2020-2035
  • Table 31: Western Europe Substations Market Value (USD Mn) Forecast by End Use, 2020-2035
  • Table 32: Western Europe Substations Market Value (USD Mn) Forecast by Category, 2020-2035
  • Table 33: Eastern Europe Substations Market Value (USD Mn) Forecast by Country, 2020-2035
  • Table 34: Eastern Europe Substations Market Value (USD Mn) Forecast by Technology , 2020-2035
  • Table 35: Eastern Europe Substations Market Value (USD Mn) Forecast by Component, 2020-2035
  • Table 36: Eastern Europe Substations Market Value (USD Mn) Forecast by Application, 2020-2035
  • Table 37: Eastern Europe Substations Market Value (USD Mn) Forecast by Connectivity, 2020-2035
  • Table 38: Eastern Europe Substations Market Value (USD Mn) Forecast by Voltage Level, 2020-2035
  • Table 39: Eastern Europe Substations Market Value (USD Mn) Forecast by End Use, 2020-2035
  • Table 40: Eastern Europe Substations Market Value (USD Mn) Forecast by Category, 2020-2035
  • Table 41: East Asia Substations Market Value (USD Mn) Forecast by Country, 2020-2035
  • Table 42: East Asia Substations Market Value (USD Mn) Forecast by Technology , 2020-2035
  • Table 43: East Asia Substations Market Value (USD Mn) Forecast by Component, 2020-2035
  • Table 44: East Asia Substations Market Value (USD Mn) Forecast by Application, 2020-2035
  • Table 45: East Asia Substations Market Value (USD Mn) Forecast by Connectivity, 2020-2035
  • Table 46: East Asia Substations Market Value (USD Mn) Forecast by Voltage Level, 2020-2035
  • Table 47: East Asia Substations Market Value (USD Mn) Forecast by End Use, 2020-2035
  • Table 48: East Asia Substations Market Value (USD Mn) Forecast by Category, 2020-2035
  • Table 49: South Asia and Pacific Substations Market Value (USD Mn) Forecast by Country, 2020-2035
  • Table 50: South Asia and Pacific Substations Market Value (USD Mn) Forecast by Technology , 2020-2035
  • Table 51: South Asia and Pacific Substations Market Value (USD Mn) Forecast by Component, 2020-2035
  • Table 52: South Asia and Pacific Substations Market Value (USD Mn) Forecast by Application, 2020-2035
  • Table 53: South Asia and Pacific Substations Market Value (USD Mn) Forecast by Connectivity, 2020-2035
  • Table 54: South Asia and Pacific Substations Market Value (USD Mn) Forecast by Voltage Level, 2020-2035
  • Table 55: South Asia and Pacific Substations Market Value (USD Mn) Forecast by End Use, 2020-2035
  • Table 56: South Asia and Pacific Substations Market Value (USD Mn) Forecast by Category, 2020-2035
  • Table 57: Middle East & Africa Substations Market Value (USD Mn) Forecast by Country, 2020-2035
  • Table 58: Middle East & Africa Substations Market Value (USD Mn) Forecast by Technology , 2020-2035
  • Table 59: Middle East & Africa Substations Market Value (USD Mn) Forecast by Component, 2020-2035
  • Table 60: Middle East & Africa Substations Market Value (USD Mn) Forecast by Application, 2020-2035
  • Table 61: Middle East & Africa Substations Market Value (USD Mn) Forecast by Connectivity, 2020-2035
  • Table 62: Middle East & Africa Substations Market Value (USD Mn) Forecast by Voltage Level, 2020-2035
  • Table 63: Middle East & Africa Substations Market Value (USD Mn) Forecast by End Use, 2020-2035
  • Table 64: Middle East & Africa Substations Market Value (USD Mn) Forecast by Category, 2020-2035

List of Figures

  • Figure 1: Global Substations Market Pricing Analysis
  • Figure 2: Global Substations Market Value (USD Mn) Forecast 2020–2035
  • Figure 3: Global Substations Market Value Share and BPS Analysis by Technology , 2025 and 2035
  • Figure 4: Global Substations Market Y-o-Y Growth Comparison by Technology , 2025–2035
  • Figure 5: Global Substations Market Attractiveness Analysis by Technology
  • Figure 6: Global Substations Market Value Share and BPS Analysis by Component, 2025 and 2035
  • Figure 7: Global Substations Market Y-o-Y Growth Comparison by Component, 2025–2035
  • Figure 8: Global Substations Market Attractiveness Analysis by Component
  • Figure 9: Global Substations Market Value Share and BPS Analysis by Application, 2025 and 2035
  • Figure 10: Global Substations Market Y-o-Y Growth Comparison by Application, 2025–2035
  • Figure 11: Global Substations Market Attractiveness Analysis by Application
  • Figure 12: Global Substations Market Value Share and BPS Analysis by Connectivity, 2025 and 2035
  • Figure 13: Global Substations Market Y-o-Y Growth Comparison by Connectivity, 2025–2035
  • Figure 14: Global Substations Market Attractiveness Analysis by Connectivity
  • Figure 15: Global Substations Market Value Share and BPS Analysis by Voltage Level, 2025 and 2035
  • Figure 16: Global Substations Market Y-o-Y Growth Comparison by Voltage Level, 2025–2035
  • Figure 17: Global Substations Market Attractiveness Analysis by Voltage Level
  • Figure 18: Global Substations Market Value Share and BPS Analysis by End Use, 2025 and 2035
  • Figure 19: Global Substations Market Y-o-Y Growth Comparison by End Use, 2025–2035
  • Figure 20: Global Substations Market Attractiveness Analysis by End Use
  • Figure 21: Global Substations Market Value Share and BPS Analysis by Category, 2025 and 2035
  • Figure 22: Global Substations Market Y-o-Y Growth Comparison by Category, 2025–2035
  • Figure 23: Global Substations Market Attractiveness Analysis by Category
  • Figure 24: Global Substations Market Value (USD Mn) Share and BPS Analysis by Region, 2025 and 2035
  • Figure 25: Global Substations Market Y-o-Y Growth Comparison by Region, 2025–2035
  • Figure 26: Global Substations Market Attractiveness Analysis by Region
  • Figure 27: North America Substations Market Incremental Dollar Opportunity, 2025–2035
  • Figure 28: Latin America Substations Market Incremental Dollar Opportunity, 2025–2035
  • Figure 29: Western Europe Substations Market Incremental Dollar Opportunity, 2025–2035
  • Figure 30: Eastern Europe Substations Market Incremental Dollar Opportunity, 2025–2035
  • Figure 31: East Asia Substations Market Incremental Dollar Opportunity, 2025–2035
  • Figure 32: South Asia and Pacific Substations Market Incremental Dollar Opportunity, 2025–2035
  • Figure 33: Middle East & Africa Substations Market Incremental Dollar Opportunity, 2025–2035
  • Figure 34: North America Substations Market Value Share and BPS Analysis by Country, 2025 and 2035
  • Figure 35: North America Substations Market Value Share and BPS Analysis by Technology , 2025 and 2035
  • Figure 36: North America Substations Market Y-o-Y Growth Comparison by Technology , 2025–2035
  • Figure 37: North America Substations Market Attractiveness Analysis by Technology
  • Figure 38: North America Substations Market Value Share and BPS Analysis by Component, 2025 and 2035
  • Figure 39: North America Substations Market Y-o-Y Growth Comparison by Component, 2025–2035
  • Figure 40: North America Substations Market Attractiveness Analysis by Component
  • Figure 41: North America Substations Market Value Share and BPS Analysis by Application, 2025 and 2035
  • Figure 42: North America Substations Market Y-o-Y Growth Comparison by Application, 2025–2035
  • Figure 43: North America Substations Market Attractiveness Analysis by Application
  • Figure 44: North America Substations Market Value Share and BPS Analysis by Connectivity, 2025 and 2035
  • Figure 45: North America Substations Market Y-o-Y Growth Comparison by Connectivity, 2025–2035
  • Figure 46: North America Substations Market Attractiveness Analysis by Connectivity
  • Figure 47: North America Substations Market Value Share and BPS Analysis by Voltage Level, 2025 and 2035
  • Figure 48: North America Substations Market Y-o-Y Growth Comparison by Voltage Level, 2025–2035
  • Figure 49: North America Substations Market Attractiveness Analysis by Voltage Level
  • Figure 50: North America Substations Market Value Share and BPS Analysis by End Use, 2025 and 2035
  • Figure 51: North America Substations Market Y-o-Y Growth Comparison by End Use, 2025–2035
  • Figure 52: North America Substations Market Attractiveness Analysis by End Use
  • Figure 53: North America Substations Market Value Share and BPS Analysis by Category, 2025 and 2035
  • Figure 54: North America Substations Market Y-o-Y Growth Comparison by Category, 2025–2035
  • Figure 55: North America Substations Market Attractiveness Analysis by Category
  • Figure 56: Latin America Substations Market Value Share and BPS Analysis by Country, 2025 and 2035
  • Figure 57: Latin America Substations Market Value Share and BPS Analysis by Technology , 2025 and 2035
  • Figure 58: Latin America Substations Market Y-o-Y Growth Comparison by Technology , 2025–2035
  • Figure 59: Latin America Substations Market Attractiveness Analysis by Technology
  • Figure 60: Latin America Substations Market Value Share and BPS Analysis by Component, 2025 and 2035
  • Figure 61: Latin America Substations Market Y-o-Y Growth Comparison by Component, 2025–2035
  • Figure 62: Latin America Substations Market Attractiveness Analysis by Component
  • Figure 63: Latin America Substations Market Value Share and BPS Analysis by Application, 2025 and 2035
  • Figure 64: Latin America Substations Market Y-o-Y Growth Comparison by Application, 2025–2035
  • Figure 65: Latin America Substations Market Attractiveness Analysis by Application
  • Figure 66: Latin America Substations Market Value Share and BPS Analysis by Connectivity, 2025 and 2035
  • Figure 67: Latin America Substations Market Y-o-Y Growth Comparison by Connectivity, 2025–2035
  • Figure 68: Latin America Substations Market Attractiveness Analysis by Connectivity
  • Figure 69: Latin America Substations Market Value Share and BPS Analysis by Voltage Level, 2025 and 2035
  • Figure 70: Latin America Substations Market Y-o-Y Growth Comparison by Voltage Level, 2025–2035
  • Figure 71: Latin America Substations Market Attractiveness Analysis by Voltage Level
  • Figure 72: Latin America Substations Market Value Share and BPS Analysis by End Use, 2025 and 2035
  • Figure 73: Latin America Substations Market Y-o-Y Growth Comparison by End Use, 2025–2035
  • Figure 74: Latin America Substations Market Attractiveness Analysis by End Use
  • Figure 75: Latin America Substations Market Value Share and BPS Analysis by Category, 2025 and 2035
  • Figure 76: Latin America Substations Market Y-o-Y Growth Comparison by Category, 2025–2035
  • Figure 77: Latin America Substations Market Attractiveness Analysis by Category
  • Figure 78: Western Europe Substations Market Value Share and BPS Analysis by Country, 2025 and 2035
  • Figure 79: Western Europe Substations Market Value Share and BPS Analysis by Technology , 2025 and 2035
  • Figure 80: Western Europe Substations Market Y-o-Y Growth Comparison by Technology , 2025–2035
  • Figure 81: Western Europe Substations Market Attractiveness Analysis by Technology
  • Figure 82: Western Europe Substations Market Value Share and BPS Analysis by Component, 2025 and 2035
  • Figure 83: Western Europe Substations Market Y-o-Y Growth Comparison by Component, 2025–2035
  • Figure 84: Western Europe Substations Market Attractiveness Analysis by Component
  • Figure 85: Western Europe Substations Market Value Share and BPS Analysis by Application, 2025 and 2035
  • Figure 86: Western Europe Substations Market Y-o-Y Growth Comparison by Application, 2025–2035
  • Figure 87: Western Europe Substations Market Attractiveness Analysis by Application
  • Figure 88: Western Europe Substations Market Value Share and BPS Analysis by Connectivity, 2025 and 2035
  • Figure 89: Western Europe Substations Market Y-o-Y Growth Comparison by Connectivity, 2025–2035
  • Figure 90: Western Europe Substations Market Attractiveness Analysis by Connectivity
  • Figure 91: Western Europe Substations Market Value Share and BPS Analysis by Voltage Level, 2025 and 2035
  • Figure 92: Western Europe Substations Market Y-o-Y Growth Comparison by Voltage Level, 2025–2035
  • Figure 93: Western Europe Substations Market Attractiveness Analysis by Voltage Level
  • Figure 94: Western Europe Substations Market Value Share and BPS Analysis by End Use, 2025 and 2035
  • Figure 95: Western Europe Substations Market Y-o-Y Growth Comparison by End Use, 2025–2035
  • Figure 96: Western Europe Substations Market Attractiveness Analysis by End Use
  • Figure 97: Western Europe Substations Market Value Share and BPS Analysis by Category, 2025 and 2035
  • Figure 98: Western Europe Substations Market Y-o-Y Growth Comparison by Category, 2025–2035
  • Figure 99: Western Europe Substations Market Attractiveness Analysis by Category
  • Figure 100: Eastern Europe Substations Market Value Share and BPS Analysis by Country, 2025 and 2035
  • Figure 101: Eastern Europe Substations Market Value Share and BPS Analysis by Technology , 2025 and 2035
  • Figure 102: Eastern Europe Substations Market Y-o-Y Growth Comparison by Technology , 2025–2035
  • Figure 103: Eastern Europe Substations Market Attractiveness Analysis by Technology
  • Figure 104: Eastern Europe Substations Market Value Share and BPS Analysis by Component, 2025 and 2035
  • Figure 105: Eastern Europe Substations Market Y-o-Y Growth Comparison by Component, 2025–2035
  • Figure 106: Eastern Europe Substations Market Attractiveness Analysis by Component
  • Figure 107: Eastern Europe Substations Market Value Share and BPS Analysis by Application, 2025 and 2035
  • Figure 108: Eastern Europe Substations Market Y-o-Y Growth Comparison by Application, 2025–2035
  • Figure 109: Eastern Europe Substations Market Attractiveness Analysis by Application
  • Figure 110: Eastern Europe Substations Market Value Share and BPS Analysis by Connectivity, 2025 and 2035
  • Figure 111: Eastern Europe Substations Market Y-o-Y Growth Comparison by Connectivity, 2025–2035
  • Figure 112: Eastern Europe Substations Market Attractiveness Analysis by Connectivity
  • Figure 113: Eastern Europe Substations Market Value Share and BPS Analysis by Voltage Level, 2025 and 2035
  • Figure 114: Eastern Europe Substations Market Y-o-Y Growth Comparison by Voltage Level, 2025–2035
  • Figure 115: Eastern Europe Substations Market Attractiveness Analysis by Voltage Level
  • Figure 116: Eastern Europe Substations Market Value Share and BPS Analysis by End Use, 2025 and 2035
  • Figure 117: Eastern Europe Substations Market Y-o-Y Growth Comparison by End Use, 2025–2035
  • Figure 118: Eastern Europe Substations Market Attractiveness Analysis by End Use
  • Figure 119: Eastern Europe Substations Market Value Share and BPS Analysis by Category, 2025 and 2035
  • Figure 120: Eastern Europe Substations Market Y-o-Y Growth Comparison by Category, 2025–2035
  • Figure 121: Eastern Europe Substations Market Attractiveness Analysis by Category
  • Figure 122: East Asia Substations Market Value Share and BPS Analysis by Country, 2025 and 2035
  • Figure 123: East Asia Substations Market Value Share and BPS Analysis by Technology , 2025 and 2035
  • Figure 124: East Asia Substations Market Y-o-Y Growth Comparison by Technology , 2025–2035
  • Figure 125: East Asia Substations Market Attractiveness Analysis by Technology
  • Figure 126: East Asia Substations Market Value Share and BPS Analysis by Component, 2025 and 2035
  • Figure 127: East Asia Substations Market Y-o-Y Growth Comparison by Component, 2025–2035
  • Figure 128: East Asia Substations Market Attractiveness Analysis by Component
  • Figure 129: East Asia Substations Market Value Share and BPS Analysis by Application, 2025 and 2035
  • Figure 130: East Asia Substations Market Y-o-Y Growth Comparison by Application, 2025–2035
  • Figure 131: East Asia Substations Market Attractiveness Analysis by Application
  • Figure 132: East Asia Substations Market Value Share and BPS Analysis by Connectivity, 2025 and 2035
  • Figure 133: East Asia Substations Market Y-o-Y Growth Comparison by Connectivity, 2025–2035
  • Figure 134: East Asia Substations Market Attractiveness Analysis by Connectivity
  • Figure 135: East Asia Substations Market Value Share and BPS Analysis by Voltage Level, 2025 and 2035
  • Figure 136: East Asia Substations Market Y-o-Y Growth Comparison by Voltage Level, 2025–2035
  • Figure 137: East Asia Substations Market Attractiveness Analysis by Voltage Level
  • Figure 138: East Asia Substations Market Value Share and BPS Analysis by End Use, 2025 and 2035
  • Figure 139: East Asia Substations Market Y-o-Y Growth Comparison by End Use, 2025–2035
  • Figure 140: East Asia Substations Market Attractiveness Analysis by End Use
  • Figure 141: East Asia Substations Market Value Share and BPS Analysis by Category, 2025 and 2035
  • Figure 142: East Asia Substations Market Y-o-Y Growth Comparison by Category, 2025–2035
  • Figure 143: East Asia Substations Market Attractiveness Analysis by Category
  • Figure 144: South Asia and Pacific Substations Market Value Share and BPS Analysis by Country, 2025 and 2035
  • Figure 145: South Asia and Pacific Substations Market Value Share and BPS Analysis by Technology , 2025 and 2035
  • Figure 146: South Asia and Pacific Substations Market Y-o-Y Growth Comparison by Technology , 2025–2035
  • Figure 147: South Asia and Pacific Substations Market Attractiveness Analysis by Technology
  • Figure 148: South Asia and Pacific Substations Market Value Share and BPS Analysis by Component, 2025 and 2035
  • Figure 149: South Asia and Pacific Substations Market Y-o-Y Growth Comparison by Component, 2025–2035
  • Figure 150: South Asia and Pacific Substations Market Attractiveness Analysis by Component
  • Figure 151: South Asia and Pacific Substations Market Value Share and BPS Analysis by Application, 2025 and 2035
  • Figure 152: South Asia and Pacific Substations Market Y-o-Y Growth Comparison by Application, 2025–2035
  • Figure 153: South Asia and Pacific Substations Market Attractiveness Analysis by Application
  • Figure 154: South Asia and Pacific Substations Market Value Share and BPS Analysis by Connectivity, 2025 and 2035
  • Figure 155: South Asia and Pacific Substations Market Y-o-Y Growth Comparison by Connectivity, 2025–2035
  • Figure 156: South Asia and Pacific Substations Market Attractiveness Analysis by Connectivity
  • Figure 157: South Asia and Pacific Substations Market Value Share and BPS Analysis by Voltage Level, 2025 and 2035
  • Figure 158: South Asia and Pacific Substations Market Y-o-Y Growth Comparison by Voltage Level, 2025–2035
  • Figure 159: South Asia and Pacific Substations Market Attractiveness Analysis by Voltage Level
  • Figure 160: South Asia and Pacific Substations Market Value Share and BPS Analysis by End Use, 2025 and 2035
  • Figure 161: South Asia and Pacific Substations Market Y-o-Y Growth Comparison by End Use, 2025–2035
  • Figure 162: South Asia and Pacific Substations Market Attractiveness Analysis by End Use
  • Figure 163: South Asia and Pacific Substations Market Value Share and BPS Analysis by Category, 2025 and 2035
  • Figure 164: South Asia and Pacific Substations Market Y-o-Y Growth Comparison by Category, 2025–2035
  • Figure 165: South Asia and Pacific Substations Market Attractiveness Analysis by Category
  • Figure 166: Middle East & Africa Substations Market Value Share and BPS Analysis by Country, 2025 and 2035
  • Figure 167: Middle East & Africa Substations Market Value Share and BPS Analysis by Technology , 2025 and 2035
  • Figure 168: Middle East & Africa Substations Market Y-o-Y Growth Comparison by Technology , 2025–2035
  • Figure 169: Middle East & Africa Substations Market Attractiveness Analysis by Technology
  • Figure 170: Middle East & Africa Substations Market Value Share and BPS Analysis by Component, 2025 and 2035
  • Figure 171: Middle East & Africa Substations Market Y-o-Y Growth Comparison by Component, 2025–2035
  • Figure 172: Middle East & Africa Substations Market Attractiveness Analysis by Component
  • Figure 173: Middle East & Africa Substations Market Value Share and BPS Analysis by Application, 2025 and 2035
  • Figure 174: Middle East & Africa Substations Market Y-o-Y Growth Comparison by Application, 2025–2035
  • Figure 175: Middle East & Africa Substations Market Attractiveness Analysis by Application
  • Figure 176: Middle East & Africa Substations Market Value Share and BPS Analysis by Connectivity, 2025 and 2035
  • Figure 177: Middle East & Africa Substations Market Y-o-Y Growth Comparison by Connectivity, 2025–2035
  • Figure 178: Middle East & Africa Substations Market Attractiveness Analysis by Connectivity
  • Figure 179: Middle East & Africa Substations Market Value Share and BPS Analysis by Voltage Level, 2025 and 2035
  • Figure 180: Middle East & Africa Substations Market Y-o-Y Growth Comparison by Voltage Level, 2025–2035
  • Figure 181: Middle East & Africa Substations Market Attractiveness Analysis by Voltage Level
  • Figure 182: Middle East & Africa Substations Market Value Share and BPS Analysis by End Use, 2025 and 2035
  • Figure 183: Middle East & Africa Substations Market Y-o-Y Growth Comparison by End Use, 2025–2035
  • Figure 184: Middle East & Africa Substations Market Attractiveness Analysis by End Use
  • Figure 185: Middle East & Africa Substations Market Value Share and BPS Analysis by Category, 2025 and 2035
  • Figure 186: Middle East & Africa Substations Market Y-o-Y Growth Comparison by Category, 2025–2035
  • Figure 187: Middle East & Africa Substations Market Attractiveness Analysis by Category
  • Figure 188: Global Substations Market – Tier Structure Analysis
  • Figure 189: Global Substations Market – Company Share Analysis

Frequently Asked Questions

How big is the substations market in 2025?

The global substations market is estimated to be valued at USD 132.6 billion in 2025.

What will be the size of substations market in 2035?

The market size for the substations market is projected to reach USD 181.7 billion by 2035.

How much will be the substations market growth between 2025 and 2035?

The substations market is expected to grow at a 3.2% CAGR between 2025 and 2035.

What are the key product types in the substations market?

The key product types in substations market are conventional and digital.

Which component segment to contribute significant share in the substations market in 2025?

In terms of component, electrical system segment to command 39.6% share in the substations market in 2025.

Explore Similar Insights

Future Market Insights

Substations Market

Chat With

MaRIA

Hi There, I am MaRIA, Your Market Research Intelligence Assistant. How may I help you?