
- Market Size (2026)
- USD 99.9 Mn
- Forecast (2036)
- USD 169.0 Mn
- CAGR (2026 to 2036)
- 5.4%
How big is Sucroglycerides Market in 2026?
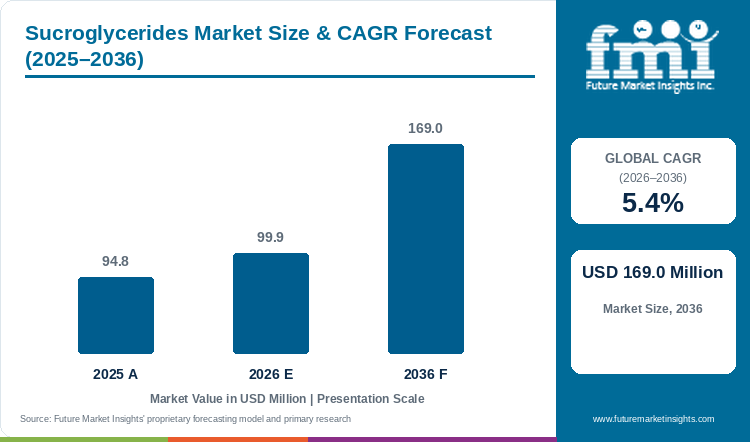
With a valuation of USD 94.8 million in 2025 and moving to USD 99.9 million in 2026, the sucroglycerides market is positioned to attain USD 169.0 million by 2036, exhibiting a CAGR of 5.4%.
Formulation switching by industrial bakeries and dairy emulsion plants plus livestock feed blenders from solvent-extracted sucrose esters to solvent-free E474 sucroglycerides is driving global demand. Global sucroglycerides valuation moved from USD 94.8 million in 2025 to USD 99.9 million in 2026 and is on course to hit USD 169.0 million by 2036, recording a 5.4% CAGR and USD 69.1 million in added value. Hydrophilic High-HLB Oil-in-Water Emulsifiers capture a 58.4% share of 2026 HLB value range demand because sucrose mono- and diester fractions co-blended with diglycerides prevent coalescence in whipped toppings and fine pastry batters. According to an August 2026 interfacial rheology study in Foods, dosing hydrophilic sucrose esters at 0.10 wt% slowed partial fat coalescence and increased whipped cream overrun, whereas 0.50 wt% overdosing triggered serum loss. Category expansion outpaces activated cake emulsifier systems at 4.9% CAGR because sucroglycerides also serve ruminant calf milk replacers and cosmetic emulsions. Groupe Avril Oleon NV advanced its 2026 sustainable supplier program in May 2026 and Croda International Plc posted 6.9% organic growth in protected specialty ingredients in July 2026. According to FMI analyst observations, broader adoption through 2036 hinges on heated paste-metering lines and strict dosage control.
Key Market Trends & Insights
- By HLB value range: Hydrophilic High-HLB Oil-in-Water Emulsifiers hold an estimated 58.4% share in 2026 because water-dispersible sucrose mono- and diester blends stabilize fine fat droplets in bakery and dairy plus calf milk emulsions.
- By physical form: Viscous Paste and Gel represents 53.2% in 2026 as direct solvent-free transesterification of sucrose and triglycerides yields co-melted sucroglyceride pastes without spray-drying losses.
- By lipid feedstock: Palm and Coconut Triglyceride Transesterified grades secure 62.6% in 2026 due to high oxidative stability and sharp melting profiles across palmitic and stearic plus lauric chains.
- By end-use application: Bakery Dough Conditioning and Fine Pastry accounts for 38.6% in 2026 through amylose-complexing crumb softening and gluten starch lubrication.
- By certification, packaging, and customer scale: Non-GMO and Kosher with Halal Certified grades capture 69.5% while 25 kg Multi-Wall Kraft Bags and Fiber Drums hold 49.9% and Multinational CPG and Beverage Groups account for 54.4% in 2026.
Regional Highlights
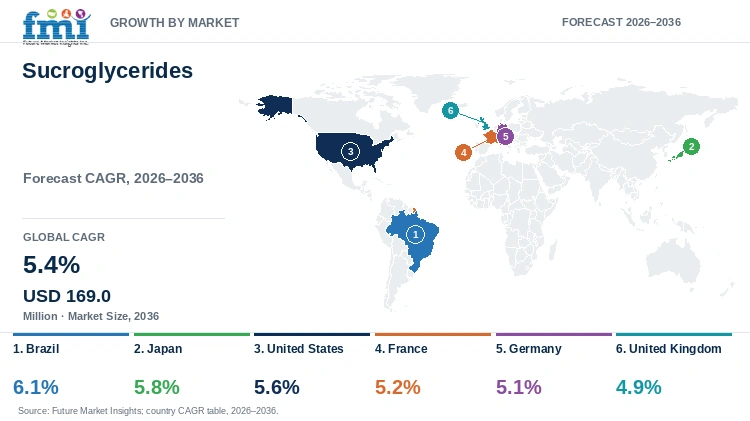
- Top national expansion: Brazil paces country-level demand at a 6.1% annual growth rate through 2036 on the strength of domestic oilseed transesterification and commercial calf-rearing feed production.
- Broader country progression: Japan records a 5.8% annual rate while the United States grows at 5.6% and France advances at 5.2%. Within northern Europe, Germany posts 5.1% and the United Kingdom registers 4.9%.
Market Size & Forecast
Table 1: Market Size and Forecast for the Sucroglycerides Market (USD million and CAGR percentage), 2025 to 2036
| Metric | Value |
|---|---|
| 2025 Market Size | USD 94.8 million |
| Estimated Market Size in 2026 | USD 99.9 million |
| Projected Market Size by 2036 | USD 169.0 million |
| CAGR, 2026 to 2036 | 5.4% |
| Added Value, 2026 to 2036 | USD 69.1 million |
Food and personal-care formulators face mounting regulatory pressure to eliminate ethoxylated surfactants contaminated with 1,4-dioxane and purified sugar esters manufactured with dimethylformamide or dimethyl sulfoxide solvents. When oleochemical producers react sucrose directly with edible triglycerides at 120 to 180 degrees Celsius using potassium carbonate reaction promoters, the resulting E474 sucroglyceride mixture combines 40% to 60% sucrose fatty acid esters with 40% to 60% mono- and diglycerides in a single solvent-free step. In March 2025, polymer chemists reporting in Polymers noted that while sucrose esters span an HLB value range of 1 to 16, conventional solvent esterification raises residual DMSO and DMF concerns that solvent-free triglyceride transesterification avoids. Consequently, clean-label bakery and emulsion engineers specify E474 sucroglycerides to achieve non-ionic surfactant performance without toxic organic solvent residues.
Treated Emulsion Tonnage and Active Surfactant Sizing
Table 2: Treated Food & Feed Emulsion Tonnage and Active Dosing Sizing for the Sucroglycerides Market (USD million and operational ranges), 2025 to 2036
| Metric | 2025 | 2026 | 2036 |
|---|---|---|---|
| Market size (USD million) | 94.8 | 99.9 | 169.0 |
| Treated bakery, dairy, feed & cosmetic output (million metric tons) | 6.2 to 7.1 | 6.5 to 7.5 | 10.8 to 12.4 |
| Commercial sucroglycerides volume (thousand metric tons) | 22.5 to 25.4 | 23.6 to 26.7 | 38.2 to 43.0 |
| Average sucroglyceride price per metric ton (USD) | 3,850 to 4,250 | 3,880 to 4,290 | 4,020 to 4,450 |
Operational note: Treated output ranges apply standard 0.10% to 0.50% active E474 dosing in bakery batters and whipped dairy toppings and 0.8% to 2.0% lipid emulsification dosing in calf milk replacer fat concentrates.
High-shear homogenizers in commercial bakeries and UHT dairy plants plus calf-feed spray dryers require non-ionic emulsifiers that lower oil-water interfacial tension without denaturing milk or wheat proteins. Oleochemical producers supply co-transesterified sucroglycerides that disperse smoothly with synthetic and natural food emulsifiers and de-oiled phospholipid lecithins.
Per Capita & Industrial Emulsion Line Sizing
Table 3: Per Capita and Processing Line Valuation Indicators for the Sucroglycerides Market (USD), 2025 to 2036
| Metric | 2025 | 2026 | 2036 |
|---|---|---|---|
| World population (billion) | 8.2 | 8.3 | 9.0 |
| Market value per 1,000 people (USD) | 11.6 | 12.0 | 18.8 |
| Annual procurement per qualified food/feed emulsion plant (USD thousand) | 18.5 to 22.0 | 19.4 to 23.1 | 31.5 to 37.2 |
| Non-GMO, Kosher & Halal certified share (%) | 68.0% to 70.0% | 69.5% | 75.0% to 78.5% |
Table 4: Segment Allocation and Customer Scale Indicators for the Sucroglycerides Market (USD million and percentages), 2026
| Metric | Value | Institutional Reference Basis |
|---|---|---|
| Market size, 2026 | USD 99.9 million | 2026 global market value baseline |
| Hydrophilic High-HLB Oil-in-Water valuation, 2026 | USD 58.3 million | 58.4% HLB value range allocation |
| Palm and Coconut Transesterified valuation, 2026 | USD 62.5 million | 62.6% lipid feedstock allocation |
| Multinational CPG and Beverage Groups valuation, 2026 | USD 54.3 million | 54.4% customer scale allocation |
Substitution of polysorbate 60 and solvent-processed sucrose esters in fine pastry and dairy toppings requires matching hydrophilic-lipophilic balance between HLB 11 and HLB 15. Formulators blend hydrophilic sucroglycerides with low-HLB sorbitan esters to lock alpha-crystalline fat shells around air cells during whipping.
Analyst Perspective
"Food and feed formulators buy sucroglycerides when they need high-HLB sugar-ester functionality without paying the price premium or carrying the solvent-residue baggage of purified E473 sucrose esters. Suppliers that pair RSPO Mass-Balance or European rapeseed feedstocks with easy-metering pellets and heated IBC paste systems will win multinational CPG contracts through 2036."
- Nandini Roy Choudhury, Principal Consultant, Future Market Insights.
How is the sucroglycerides market segmented?
The sucroglycerides market is segmented by HLB value range, physical form, lipid feedstock, end-use application, clean-label and certification status, packaging bulk format, and customer scale. In 2026, Hydrophilic High-HLB leads at 58.4%, Viscous Paste and Gel at 53.2%, Palm and Coconut Transesterified at 62.6%, Bakery Dough Conditioning at 38.6%, Non-GMO/Kosher/Halal at 69.5%, 25 kg Bags/Drums at 49.9%, and Multinational CPGs at 54.4%.
By HLB value range: Hydrophilic High-HLB Oil-in-Water Emulsifiers, and Lipophilic Low-HLB Water-in-Oil Emulsifiers.
By physical form: Viscous Paste and Gel, Spray-Cooled Powder and Pellets, and Liquid Blends.
By lipid feedstock: Palm and Coconut Triglyceride Transesterified, and Rapeseed, Sunflower, and Soy Oil Derived.
By end-use application: Bakery Dough Conditioning and Fine Pastry, Ice Cream, Whipped Toppings, and Dairy Desserts, Margarines, Sauces, and Mayonnaise Emulsions, and Ruminant Calf Milk Replacers and Cosmetics.
By clean-label and certification status: Non-GMO, Kosher, and Halal Certified, and Standard Conventional Specification.
By packaging bulk format: 25 kg Multi-Wall Kraft Bags and Fiber Drums, 1000 L IBC Totes and Bulk Tankers, and Small-Batch Foil Pouches and Pails.
By customer scale: Multinational CPG and Beverage Groups, Regional Co-Packers and Mid-Market Brands, and Artisanal and Foodservice Operators.
Why do Hydrophilic High-HLB Oil-in-Water Emulsifiers lead the HLB value range?
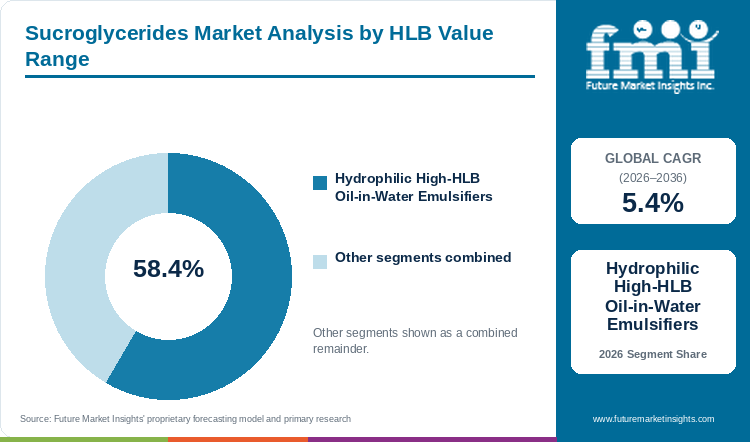
Hydrophilic High-HLB Oil-in-Water Emulsifiers hold an estimated 58.4% of HLB value range demand in 2026, anchored by superior oil-droplet dispersion in aqueous bakery, dairy, and milk-replacer systems.
Table 5: HLB Value Range Share for the Sucroglycerides Market (percentage share), 2026
| HLB Value Range | Share (2026) |
|---|---|
| Hydrophilic High-HLB Oil-in-Water Emulsifiers | 58.4% |
| Lipophilic Low-HLB Water-in-Oil Emulsifiers | 41.6%* |
| Total | 100.0% |
*Note: Lipophilic Low-HLB Water-in-Oil Emulsifiers account for the remaining 41.6% of 2026 global sucroglycerides demand across table margarines and water-in-oil spreads.
Table 6: HLB Value Range Leadership and Market Growth for the Sucroglycerides Market (segment and CAGR percentage), 2026 to 2036
| Metric | Value |
|---|---|
| Global CAGR (2026 to 2036) | 5.4% |
| Leading HLB Segment | Hydrophilic High-HLB Oil-in-Water Emulsifiers |
High-HLB sucroglycerides (HLB 11 to 16) enriched in sucrose monoesters and diglycerides orient rapidly at oil-water interfaces, preventing fat globule flocculation during UHT sterilization and high-shear whipping. Dairy and bakery R&D teams pair high-HLB sucroglycerides with emulsifiers and hydrocolloid stabilizers to maintain foam overrun and freeze-thaw stability.
- Hydrophilic High-HLB Oil-in-Water Emulsifiers capture 58.4% of HLB segment value in 2026 because aqueous food and beverage systems plus calf-milk concentrates outnumber water-in-oil spreads.
- In July 2025, food emulsion scientists reporting in Food Chemistry: X documented how non-ionic high-HLB surfactants and biopolymer complexes govern droplet size distribution and long-term shelf stability across multiphase food emulsions.
What sustains Viscous Paste and Gel leadership in the physical form category?
Viscous Paste and Gel represents 53.2% of the physical form category in 2026, supported by direct reactor discharge economics and rapid dispersion into heated fat phases.
Because sucroglycerides retain 40% to 60% mono- and diglycerides with sucrose esters, the neat reaction product solidifies into a soft cohesive paste or gel at ambient factory temperatures. Industrial cake and calf-feed plants melt viscous sucroglyceride pastes directly into warm lipid tanks with industrial cake margarines, avoiding the carrier cost and thermal energy required for spray-cooled powders.
- Viscous Paste and Gel secures 53.2% of physical form demand in 2026 as high-volume bakery and feed mills meter melted paste directly from heated drums and totes.
- Mitsubishi Chemical Group detailed in its July 2026 Food and Healthcare technical update how tailored sugar-ester and glyceride physical forms solve dispersion bottlenecks in commercial food processing.
How do Palm and Coconut Triglyceride Transesterified grades lead lipid feedstock?
Palm and Coconut Triglyceride Transesterified grades account for 62.6% of lipid feedstock demand in 2026, driven by saturated C12-C18 chain functionality and high transesterification yields.
Refined palm stearin and coconut oil provide saturated palmitic and lauric fatty acid chains that resist rancidity and form firm alpha-crystalline films around starch granules and air bubbles. While European buyers test rapeseed and sunflower alternatives, global processors favor RSPO-certified palm and coconut sucroglycerides in spread and bakery margarines because saturated chains deliver superior crumb softness and whipping stiffness.
- Palm and Coconut Triglyceride Transesterified grades command 62.6% of lipid feedstock value in 2026 owing to superior thermal stability and starch-complexing power.
- In May 2026, the USDA Foreign Agricultural Service reported in its global oilseeds circular that palm and coconut oils remain the primary saturated vegetable lipid feedstocks for industrial food and oleochemical esterification.
Why does Bakery Dough Conditioning and Fine Pastry lead end-use applications?
Bakery Dough Conditioning and Fine Pastry accounts for 38.6% of end-use application demand in 2026, driven by amylose retrogradation delay and gluten network lubrication.
In sponge cakes and laminated viennoiserie, sucroglycerides complex with gelatinized wheat amylose to delay crumb staling while lubricating gluten strands during high-speed sheeting. Industrial bakeries combine sucroglycerides with commercial dough conditioners while livestock nutritionists use the same E474 chemistry in commercial calf milk replacers to homogenize tallow and coconut fat into skim milk replacer powders.
- Bakery Dough Conditioning and Fine Pastry holds 38.6% of application value in 2026 because continuous cake and pastry lines require dual aeration and anti-staling performance.
- An April 2025 study in the Journal of Food Science demonstrated that combined emulsifier treatment significantly increased pasting viscosity and loaf volume across specialty wheat breadmaking lines.
How do Clean-Label Certification, 25 kg Kraft Packaging, and Multinational CPGs shape procurement?
Non-GMO, Kosher, and Halal Certified grades capture 69.5% of certification share in 2026, while 25 kg Multi-Wall Kraft Bags and Fiber Drums hold 49.9% of packaging and Multinational CPGs command 54.4% of customer scale.
Global food and personal-care buyers mandate Non-GMO and Kosher with Halal certification so a single sucroglyceride SKU can be deployed across North American and European plus Asian plants without segregated inventory. While liquid and heated paste lines use 1000 L IBC totes, 25 kg multi-wall kraft bags and fiber drums remain the leading bulk format at 49.9% across bio-based specialty emulsifiers accounts audited by Multinational CPG and Beverage Groups.
- Non-GMO and Kosher with Halal Certified specifications secure 69.5% of certification value and Multinational CPGs represent 54.4% of customer demand in 2026.
- Groupe Avril Oleon NV reported on May 12, 2026 that its supplier sustainability monitoring program targets 80% audited supplier coverage and >60% sustainability scores across its global oleochemical supply chain.
What are the drivers, restraints, and opportunities in the sucroglycerides market?
In the sucroglycerides market, solvent-free E474 transesterification economics and clean-label bakery and calf-feed emulsification are projected to drive adoption, whereas narrow dosage tolerances and heated paste-handling requirements restrain small-plant use and rapeseed/sunflower palm-free grades create European reformulation opportunities.
- Driver: Cost-effective solvent-free transesterification of sucrose and vegetable triglycerides enables bakeries and dairy plants plus calf-feed mills to replace solvent-processed E473 esters and ethoxylated surfactants.
- Restraint: High viscosity of paste grades requiring heated metering lines combined with serum-separation risks above 0.50 wt% dosing complicate uncalibrated plant adoption.
- Opportunity: Production of European non-GMO rapeseed and sunflower sucroglycerides with spray-cooled free-flowing microbeads opens palm-free clean-label bakery and dermo-cosmetic contracts.
Growth Analysis and Future Potential: Qualitative Demand Drivers
Multinational bakery and dairy processors are reformulating emulsions to strip out ethoxylated sorbitan esters (polysorbates) while avoiding the high unit cost of solvent-purified sucrose esters. Sucroglycerides (E474) bridge that gap because the co-presence of mono- and diglycerides with sucrose esters creates a self-emulsifying complex that disperses fat globules below 2 microns in both dairy toppings and ruminant calf milk replacers. In June 2025, food engineers reporting in Gels demonstrated that structured oil-in-water emulsion gels formulated with sunflower oil and plant proteins successfully replaced conventional saturated margarine fats in biscuit doughs without altering color or sensory acceptance. Consequently, ingredient buyers integrate E474 sucroglycerides into reduced-fat pastry and dairy dessert premixes.
Risk Assessment of the Sucroglycerides Market: Operational and Formulation Friction
Over-dosing hydrophilic sucroglycerides or failing to control esterification degree can destabilize protein-coated fat globules in whipped dairy and bakery batters. In August 2026, food physicists publishing in Foods demonstrated that while 0.10 wt% hydrophilic sucrose ester stabilized sodium-caseinate whipped cream, raising dosage to 0.50 wt% caused competitive displacement of interfacial milk proteins and increased serum drainage. Similarly, an August 2025 study in the Journal of the Science of Food and Agriculture showed that exceeding optimal emulsifier incorporation thresholds (0.6% versus 0.9%) degraded gluten network junction density and loaf volume. Food plants therefore require pilot homogenizer and Farinograph validation before switching sucroglyceride suppliers.
Commercial Opportunity Analysis: Palm-Free Seed-Oil Grades and Cosmetic Sensory Esters
Oleochemical producers capture premium margins in Europe and Japan by transesterifying sucrose with non-GMO European rapeseed and high-oleic sunflower oils and by marketing ultra-mild sucroglyceride emollients to dermo-cosmetic brands. Both the European Commission Food Additives database (E474) and the U.S. FDA Food Substances inventory (21 CFR 172.859) maintain clear regulatory authorizations for sucroglycerides and sucrose fatty acid esters across bakery and dairy plus confectionery categories. In May 2026, France-based specialty ester producer Stearinerie Dubois unveiled its TACTILE sensory ester collection at NYSCC Suppliers' Day in New York, demonstrating how tailored sucroglyceride and polyfunctional ester structures govern skin-touch perception in personal care.
Sucroglycerides Market by Country (2026 to 2036)
National demand modeling places Brazil at the forefront of sucroglycerides growth with a 6.1% CAGR through 2036, ahead of Japan at 5.8% and the United States at 5.6%. Country adoption variations reflect domestic oilseed feedstock availability and UHT dairy automation plus EU E474 and FDA 21 CFR 172.859 regulatory rules across six evaluated nations.
Table 7: Country CAGR and Primary Growth Levers for the Sucroglycerides Market (CAGR percentage and operational drivers), 2026 to 2036
| Country | CAGR (2026 to 2036) | Primary Growth Lever |
|---|---|---|
| Brazil | 6.1% | Domestic soy and palm oilseed transesterification plus industrial biscuit and calf-feed scaling |
| Japan | 5.8% | High-purity hydrophilic sugar-ester heritage in UHT canned coffee, whipped cream, and sponge cakes |
| United States | 5.6% | FDA 21 CFR 172.859 bakery emulsifier reformulation and non-GMO kosher/halal CPG contracts |
| France | 5.2% | Domestic oleochemical production (Oleon, Stearinerie Dubois) and viennoiserie/cosmetic emulsion demand |
| Germany | 5.1% | Industrial bake-off roll conditioning and commercial calf milk replacer fat homogenization |
| United Kingdom | 4.9% | Private-label supermarket bakery cost optimization and palm-free rapeseed emulsifier trials |
Source: Future Market Insights analysis
Brazil Sucroglycerides Market Outlook (2026 to 2036)
Sucroglycerides demand in Brazil climbs at a table-topping 6.1% compound annual rate through 2036 because abundant domestic cane sucrose and soybean oil plus palm plantations enable low-cost local transesterification. Unlike Western European buyers focused on niche cosmetic creams, processors in Brazil consume bulk sucroglyceride pastes across high-temperature UHT dairy desserts and industrial crackers plus tropical dairy calf milk replacers. According to the March 2026 USDA Foreign Agricultural Service Brazil Oilseeds Annual report, soybean and palm oil production in Brazil continued to expand on record planted area and international processing investment. Multinational CPG plants across Sao Paulo and Parana specify Kosher and Halal certified E474 pastes to stabilize emulsions under ambient tropical distribution.
Key takeaway: In Brazil, domestic cane-sugar and vegetable-oil feedstock integration with UHT dairy and bakery scaling powers a 6.1% compound annual rate.
Japan Sucroglycerides Market Outlook (2026 to 2036)
Whereas growth in Brazil rests on bulk commodity bakery and feed volumes, market expansion in Japan is anchored by ultra-pure hydrophilic sugar-ester and sucroglyceride engineering for fine sponge cakes and whipped creams. Sucroglycerides demand in Japan advances at a 5.8% annual rate between 2026 and 2036 as convenience-store bakeries and dairy plants reformulate chilled desserts. Per the September 2026 USDA Foreign Agricultural Service Japan Retail Foods Annual report, supermarkets and convenience stores handled over 71% of food distribution in Japan in 2025 across bakery lines. Domestic pioneers Mitsubishi Chemical Group Corporation and Dai-ichi Kogyo Seiyaku Co., Ltd. partner closely with bakery chains in Japan to calibrate HLB 11 to 15 sucroglyceride pastes.
Key takeaway: In Japan, convenience-store fine pastry reformulation and domestic specialty ester engineering are forecast to sustain a 5.8% CAGR through 2036.
United States Sucroglycerides Market Outlook (2026 to 2036)
Unlike Japan where canned beverage bacteriostasis is a major outlet, sucroglycerides adoption in the United States centers on replacing polysorbates and mono-diglycerides in commercial hamburger buns and coffee creamers plus non-dairy whipped toppings. Sucroglycerides procurement in the United States gains 5.6% annually from 2026 to 2036 under U.S. FDA 21 CFR 172.859 authorizations updated through September 2026. Industrial bakeries and co-packers in the United States procure Non-GMO Project Verified and Kosher certified spray-cooled sucroglyceride powders in 25 kg multi-wall kraft bags for automated loss-in-weight dry feeders. Kerry Group plc and Corbion N.V. support North American bakery accounts through domestic technical centers that validate crumb softness and freeze-thaw stability.
Key takeaway: In the United States, polysorbate replacement across commercial bakeries and non-dairy whipped toppings is anticipated to support a 5.6% CAGR.
France Sucroglycerides Market Outlook (2026 to 2036)
France anchors European sucroglyceride synthesis and application, with national demand rising at a 5.2% annual clip from 2026 to 2036. What distinguishes France from the United Kingdom and Germany is the dual pull of industrial brioche and viennoiserie bakeries paired with prestige dermo-cosmetic laboratories specifying cold-processable E474 sucroglyceride gels. According to the September 2026 USDA Foreign Agricultural Service France Retail Foods Annual report, large general food retailers captured 58.6% of food retail distribution in France during 2025 while specialized stores and commercial artisans held 20.4% amid 1.2% food inflation. Domestic oleochemical leaders Groupe Avril Oleon NV and Stearinerie Dubois supply rapeseed and sunflower-derived sucroglycerides that satisfy supermarket palm-oil-free charters in France.
Key takeaway: In France, domestic oleochemical ester synthesis and industrial viennoiserie baking plus dermo-cosmetic emulsion demand support a 5.2% annual growth rate.
Germany Sucroglycerides Market Outlook (2026 to 2036)
Whereas demand in France splits between fine pastry and cosmetics, procurement in Germany concentrates on industrial par-baked roll improvers and high-fat ruminant calf milk replacer powders across Lower Saxony and Bavaria. Sucroglycerides demand in Germany registers a 5.1% compound annual rate over the 2026 to 2036 forecast period. Per the September 2026 USDA Foreign Agricultural Service Germany Retail Foods Annual report, packaged food and agricultural imports in Germany expanded by 9% across more than 37,000 retail grocery outlets in 2025 as processors scaled value-added private-label foods. Essen-based Evonik Industries AG and European distributors of Oleon NV supply E474 sucroglyceride pastes in heated 1000 L IBC totes to compound feed mills and industrial bakeries in Germany.
Key takeaway: In Germany, commercial calf milk replacer fat homogenization and par-baked bakery improver demand are slated to drive a 5.1% CAGR through 2036.
United Kingdom Sucroglycerides Market Outlook (2026 to 2036)
In the United Kingdom, sucroglycerides demand increases at a 4.9% annual rate through 2036 as high-speed Chorleywood plant bakeries and private-label cake manufacturers optimize emulsifier cost-in-use. Unlike continental European markets where artisan bakeries hold a larger share, grocery private-label lines in the United Kingdom accounted for a record 52.2% of supermarket basket share in early 2026, according to the October 2026 USDA Foreign Agricultural Service UK Retail Annual report. East Yorkshire-headquartered Croda International Plc and Kerry Group plc work directly with cake and dairy dessert plants in the United Kingdom to qualify sustainable RSPO Mass-Balance and rapeseed-based E474 emulsifiers across retail bakery supply chains.
Key takeaway: In the United Kingdom, record 52.2% private-label grocery share and plant-bakery cake emulsifier optimization are estimated to sustain a 4.9% CAGR.
Full report country CAGRs cover: North America, Latin America, Western Europe, Eastern Europe, East Asia, South Asia and Pacific, and Middle East and Africa.
Who are the notable companies in the sucroglycerides market?
Groupe Avril Oleon NV, Mitsubishi Chemical Group Corporation, Croda International Plc, Kerry Group plc, Evonik Industries AG, Stearinerie Dubois, Dai-ichi Kogyo Seiyaku Co., Ltd., Palsgaard A/S, Corbion N.V., and BASF SE are the notable companies in the sucroglycerides market.
Producer stratification in the sucroglycerides sector groups primary oleochemical transesterification specialists apart from East Asian high-purity sugar-ester pioneers and global bakery functional blend houses. Groupe Avril Oleon NV and Stearinerie Dubois with Croda International Plc and Evonik Industries AG synthesize food and cosmetic sucroglycerides across European and global reactors. Mitsubishi Chemical Group Corporation and Dai-ichi Kogyo Seiyaku Co., Ltd. anchor high-HLB sugar-ester and glyceride chemistry, whereas Kerry Group plc and Palsgaard A/S with Corbion N.V. and BASF SE supply integrated bakery and dairy emulsifier systems.
- European Oleochemical and Transesterified Ester Specialists: Groupe Avril Oleon NV and Stearinerie Dubois with Croda International Plc and Evonik Industries AG manufacture solvent-free E474 sucroglycerides and polyfunctional esters for food and calf-feed emulsions.
- East Asian High-HLB Sugar Ester and Sucroglyceride Pioneers: Mitsubishi Chemical Group Corporation and Dai-ichi Kogyo Seiyaku Co., Ltd. engineer precision hydrophilic and lipophilic sucrose fatty acid ester and glyceride grades for bakery and dairy lines.
- Global Bakery and Functional Emulsifier Formulators: Kerry Group plc and Palsgaard A/S with Corbion N.V. and BASF SE blend sucroglycerides with mono-diglycerides and hydrocolloids for multinational CPG plants.
Competitive Benchmarking: Sucroglycerides Market
Table 8: Competitive Benchmarking for the Sucroglycerides Market (qualitative capability ratings), 2026
| Company | Solvent-Free Transesterification | HLB Range Portfolio | Clean-Label & Feedstock Certification | Geographic Reach |
|---|---|---|---|---|
| Groupe Avril Oleon NV | High | High | High | European oleochemical leader (France/Belgium) with global food, feed, and industrial reach |
| Mitsubishi Chemical Group Corporation | High | High | High | Japan and global Ryoto Sugar Ester and food emulsifier technical network |
| Croda International Plc | High | High | High | United Kingdom, Europe, Americas, and Asia-Pacific specialty ester and Consumer Care hubs |
| Kerry Group plc | Medium | High | High | Global taste and nutrition emulsifier blending centers across Europe, Americas, and APAC |
| Evonik Industries AG | High | High | High | Germany and global Custom Solutions interfacial and cosmetic/industrial ester plants |
| Stearinerie Dubois | High | High | High | France-based specialty food and cosmetic ester synthesis with North American distribution |
| Dai-ichi Kogyo Seiyaku Co., Ltd. | High | High | Medium | Japan and East Asian DK Ester sucrose fatty acid ester and sucroglyceride specialist |
| Palsgaard A/S | Medium | High | High | Global bakery and dairy emulsifier application centers including Navi Mumbai lab (July 2025) |
| Corbion N.V. | Medium | High | High | North American and European clean-label bakery dough conditioning and emulsifier systems |
| BASF SE | High | Medium | High | Global food performance ingredients, cake emulsifiers, and personal-care surfactants |
Scoring basis: Solvent-Free Transesterification evaluates documented direct triglyceride-sucrose reactor capability without DMF/DMSO solvents, whereas HLB Range Portfolio rates coverage from lipophilic HLB 2 to hydrophilic HLB 16. Clean-Label & Feedstock Certification measures Non-GMO and Kosher/Halal compliance plus RSPO and European seed-oil traceability.
Key Developments in the Sucroglycerides Market
- Groupe Avril Oleon NV announced on May 12, 2026 that its supplier sustainability monitoring program reached its 2026 milestone targeting 80% audited oleochemical supplier coverage and >60% sustainability ratings.
- Croda International Plc reported on July 28, 2026 a 6.9% organic value increase in New and Protected Products during the first half of 2026 across its Consumer Care and specialty ester portfolios.
- Stearinerie Dubois unveiled the first volume of its TACTILE ester structure and sensory application collection at NYSCC Suppliers' Day in New York on May 19, 2026.
Key Players in the Sucroglycerides Market
European Oleochemical and Transesterified Ester Specialists
- Groupe Avril Oleon NV
- Stearinerie Dubois
- Croda International Plc
- Evonik Industries AG
East Asian High-HLB Sugar Ester and Sucroglyceride Pioneers
- Mitsubishi Chemical Group Corporation
- Dai-ichi Kogyo Seiyaku Co., Ltd.
Global Bakery, Dairy, and Functional Emulsifier Formulators
- Kerry Group plc
- Palsgaard A/S
- Corbion N.V.
- BASF SE
Sucroglycerides Market - Report Scope
Table 9: Report Scope for the Sucroglycerides Market (coverage fields and definitions), 2026 to 2036
| Coverage field | Report scope |
|---|---|
| Market breakdown | HLB Value Range, Physical Form, Lipid Feedstock, End-Use Application, Clean-Label and Certification Status, Packaging Bulk Format, Customer Scale, and Region |
| Quantitative Units | USD Million |
| Market Definition | Includes commercial producer valuation from sucroglycerides (E474 / INS 474) produced by the direct transesterification of sucrose with edible vegetable or animal triglycerides (yielding defined co-mixtures of sucrose mono-, di-, and triesters with mono-, di-, and triglycerides) across bakery, dairy, margarine, calf milk replacer, and cosmetic applications. Category Scope Note: Excludes solvent-purified neat sucrose esters of fatty acids (E473) sold without co-transesterified glycerides, standalone distilled monoglycerides (E471), and ethoxylated polysorbates (E432-E436). |
| Regions Covered | North America, Latin America, Western Europe, Eastern Europe, East Asia, South Asia and Pacific, and Middle East and Africa |
| Countries Covered | Brazil, Japan, United States, France, Germany, United Kingdom, and additional countries in the full report |
| Key Companies Covered | Groupe Avril Oleon NV, Mitsubishi Chemical Group Corporation, Croda International Plc, Kerry Group plc, Evonik Industries AG, Stearinerie Dubois, Dai-ichi Kogyo Seiyaku Co., Ltd., Palsgaard A/S, Corbion N.V., BASF SE |
| Forecast Period | 2026 to 2036 |
| Approach | Primary and secondary research with top-down and bottom-up market triangulation. |
Sucroglycerides Market - Research Methodology
Table 10: Research Methodology for the Sucroglycerides Market (research methods and approach), 2026 edition
| Method | Approach |
|---|---|
| Primary Research | Structured interviews with oleochemical esterification plant directors, industrial bakery cereal chemists, UHT dairy emulsion formulators, and calf milk replacer nutritionists to validate E474 inclusion rates and bulk drum/IBC pricing. |
| Secondary Research | Analysis of European Commission E474 food additive specifications, U.S. FDA 21 CFR 172.859 listings, PubMed and PMC interfacial rheology studies, USDA FAS oilseed and retail reports, and corporate financial disclosures. |
| Market Sizing and Forecasting | Top-down food and feed emulsifier baselines reconciled against bottom-up commercial sucroglycerides tonnage (23.6K to 26.7K MT in 2026) and average selling prices across paste, powder, and liquid forms from 2026 to 2036. |
| Country Forecasting Model | Econometric national projections weight industrial bakery and UHT dairy production, commercial calf-rearing herd demand, palm-free seed-oil reformulation mandates, and domestic oleochemical capacity across six countries. |
| Operational Benchmark Traceability | Treated emulsion tonnage and plant indicators in Tables 2, 3, and 4 trace to Foods whipped-cream interfacial assays, Polymers transesterification reviews, and USDA FAS national food processing registries. |
| Data Triangulation and Validation | Valuation estimates isolate co-transesterified sucroglycerides (E474) while strictly excluding neat solvent-processed sucrose esters (E473), commodity mono-diglycerides (E471), and raw vegetable oils. |
Sucroglycerides Market by Segments
Sucroglycerides Market segmented by HLB Value Range:
- Hydrophilic High-HLB Oil-in-Water Emulsifiers
- Lipophilic Low-HLB Water-in-Oil Emulsifiers
Sucroglycerides Market segmented by Physical Form:
- Viscous Paste and Gel
- Spray-Cooled Powder and Pellets
- Liquid Blends
Sucroglycerides Market segmented by Lipid Feedstock:
- Palm and Coconut Triglyceride Transesterified
- Rapeseed, Sunflower, and Soy Oil Derived
Sucroglycerides Market segmented by End-Use Application:
- Bakery Dough Conditioning and Fine Pastry
- Ice Cream, Whipped Toppings, and Dairy Desserts
- Margarines, Sauces, and Mayonnaise Emulsions
- Ruminant Calf Milk Replacers and Cosmetics
Sucroglycerides Market segmented by Clean-Label and Certification Status:
- Non-GMO, Kosher, and Halal Certified
- Standard Conventional Specification
Sucroglycerides Market segmented by Packaging Bulk Format:
- 25 kg Multi-Wall Kraft Bags and Fiber Drums
- 1000 L IBC Totes and Bulk Tankers
- Small-Batch Foil Pouches and Pails
Sucroglycerides Market segmented by Customer Scale:
- Multinational CPG and Beverage Groups
- Regional Co-Packers and Mid-Market Brands
- Artisanal and Foodservice Operators
Sucroglycerides Market by Region
- North America
- United States
- Canada
- Latin America
- Brazil
- Mexico
- Argentina
- Chile
- Western Europe
- Germany
- France
- United Kingdom
- Italy
- Spain
- Benelux
- Nordics
- Eastern Europe
- Poland
- Czech Republic
- Romania
- Hungary
- East Asia
- China
- Japan
- South Korea
- South Asia and Pacific
- India
- ASEAN
- Australia and New Zealand
- Middle East and Africa
- GCC Countries
- South Africa
- Türkiye
- Israel
Research Sources and Bibliography
- [1] Zeng, D., Li, C., Huang, L., Wang, J., Cai, Y., Zhao, Q., & Zhao, M. (2026, August 26). Whipped Cream Regulation by Hydrophilic Sucrose Esters: Interfacial Behavior and Whipping Properties. Foods, 15(17), 2995 (PubMed PMID 42737239, PMCID PMC13564632).
- [2] Zhang, M., & Zhang, G. (2025, March 25). Recent Advances in the Properties and Applications of Polyglycerol Fatty Acid Esters. Polymers, 17(7), 879 (PubMed PMID 40219269, PMCID PMC11991109).
- [3] Groupe Avril Oleon NV. (2026, May 12). Driving Responsible Sourcing: Oleon Strengthens Supplier Sustainability Monitoring and Performance. Oleon Corporate Newsroom.
- [4] Croda International Plc. (2026, July 28). Half Year Results Announcement 2026: Consumer Care and Life Sciences Performance. Croda Media Hub.
- [5] Evonik Industries AG. (2026, March 4). Evonik Meets 2025 Guidance, Confirms 2026 Earnings Outlook. Evonik Corporate Press Releases.
- [6] Stearinerie Dubois. (2026, May 19). Suppliers' Day 2026 NYCC: Unveiling the First Volume of the TACTILE Ester Structure and Sensory Collection. Stearinerie Dubois Corporate Announcements.
- [7] Xiao, T., Ma, X., Hu, H., Xiang, F., Zhang, X., Zheng, Y., Dong, H., Adhikari, B., Wang, Q., & Shi, A. (2025, July 17). Advances in emulsion stability: A review on mechanisms, role of emulsifiers, and applications in food. Food Chemistry: X, 29, 102792 (PubMed PMID 40747487, PMCID PMC12311586).
- [8] Valsalan, A., Swaminathan, I., Kadam, A., Koksel, F., & Malalgoda, M. (2025, April 1). Enhancing the breadmaking quality of ancient grains through synergistic emulsifier treatment and extrusion processing. Journal of Food Science, 90(4), e70206 (PubMed PMID 40260780, PMCID PMC12012863).
- [9] Kim, Y., Lee, S. H., Lim, I. K., & Imm, J. Y. (2025, August 14). Functional role of citrus fiber as an emulsifier in dough rheology, gluten structure formation and bread quality characteristics. Journal of the Science of Food and Agriculture, 105(15), 8911 to 8920 (PubMed PMID 40814163).
- [10] Puscas, A., Tanislav, A. E., Muresan, A. E., & Muresan, V. (2025, June 20). Emulgels as Fat-Replacing Systems in Biscuits Developed with Ternary Mixtures of Pea and Soy Protein Isolates and Gums. Gels, 11(7), 478 (PubMed PMID 40710640, PMCID PMC12295896).
- [11] European Commission Directorate-General for Health and Food Safety. (2025, November 14). Food and Feed Information Portal Database: Sucroglycerides (E 474) Authorization and Conditions of Use. European Commission Food Additives Portal.
- [12] U.S. Food and Drug Administration. (2026, September 8). Inventory of Food Substances Added to Food in the United States: Sucrose Fatty Acid Esters and Glycerides (21 CFR 172.859). FDA Human Foods Program Database.
- [13] USDA Foreign Agricultural Service. (2026, March 18). Brazil: Oilseeds and Products Annual. U.S. Department of Agriculture GAIN Report BR2026-0014.
- [14] USDA Foreign Agricultural Service. (2026, September 30). France: Retail Foods Annual. U.S. Department of Agriculture GAIN Report FR2026-0010.
- [15] USDA Foreign Agricultural Service. (2026, May 2). Oilseeds: World Markets and Trade May 2026 Global Market Analysis. U.S. Department of Agriculture Foreign Agricultural Service.
- [16] Mitsubishi Chemical Group Corporation. (2026, July 15). Ryoto Sugar Ester Technical Column: Toward Solving Emulsification Challenges in the Food Industry. Mitsubishi Chemical Food and Healthcare Division.
- [17] Mitsubishi Chemical Group Corporation. (2026, February 5). Consolidated Financial Summary for the Third Quarter of Fiscal Year Ending March 2026. Mitsubishi Chemical Investor Relations.
- [18] Kerry Group plc. (2026, February 17). Kerry Group Preliminary Statement of Results for the Year Ended 31 December 2025. Kerry Group Media Releases.
- [19] Palsgaard A/S. (2025, July 8). Palsgaard Inaugurates State-of-the-Art Application Centre in Navi Mumbai to Strengthen Regional Customer Support. Palsgaard Corporate Newsroom.
- [20] Corbion N.V. (2025, September 2). Corbion Leads Clean-Label Reformulation Forward at IBIE 2025. Corbion Media Releases.
This bibliography is provided for reader reference and is not exhaustive. The full report contains the complete reference list and detailed citations.
This Report Answers
- What valuation will the sucroglycerides sector reach in 2026 and by 2036?
- Which solvent-free transesterification and clean-label emulsification factors support demand for sucroglycerides?
- Why do Hydrophilic High-HLB Oil-in-Water Emulsifiers lead the HLB value range category?
- Why does Viscous Paste and Gel lead the physical form category globally?
- How do country growth trajectories vary between Brazil and Japan plus North America and Western Europe?
- Which leading companies synthesize neat E474 sucroglycerides versus blended bakery and dairy emulsifiers today?
- What limits sucroglyceride overdosing in whipped dairy creams or complicates ambient paste pumping?
- What should food and feed formulators evaluate when switching from palm-based to rapeseed-derived sucroglycerides?
Table of Content
- Key Takeaways
- Market Size and CAGR
- Top Growth Driver
- Fastest Growing Segment
- Leading Region
- Key Companies
- Emerging Opportunities
- Executive Summary
- Global Market Outlook
- Demand-side Trends
- Supply-side Trends
- Technology Roadmap Analysis
- Analysis and Recommendations
- Analyst Perspective (What is happening? Why now? What should investors know?)
- Key Questions Answered
- How large is the market?
- What is the CAGR?
- What are key trends?
- Which region dominates?
- Who are the leaders?
Read More...
- Market Overview
- Market Coverage / Taxonomy
- Market Definition / Scope / Limitations
- Research Methodology
- Chapter Orientation
- Analytical Lens and Working Hypotheses
- Market Structure, Signals, and Trend Drivers
- Benchmarking and Cross-market Comparability
- Market Sizing, Forecasting, and Opportunity Mapping
- Research Design and Evidence Framework
- Desk Research Programme (Secondary Evidence)
- Expert Input and Fieldwork (Primary Evidence)
- Tooling, Models, and Reference Databases
- Data Engineering and Model Build
- Quality Assurance and Audit Trail
- Market Background
- Market Dynamics (Drivers, Restraints, Opportunity, Trends)
- Scenario Forecast (Optimistic, Likely, Conservative)
- Impact Analysis
- AI Impact
- Sustainability Impact
- Regulatory Impact
- Technology Impact
- Consumer / Buyer Analysis
- Purchase Drivers
- Adoption Barriers
- Buyer Journey
- Opportunity Map Analysis
- Product Life Cycle Analysis
- Supply Chain Analysis
- Investment Feasibility Matrix
- Value Chain Analysis
- PESTLE and Porter's Analysis
- Regulatory Landscape
- Regional Parent Market Outlook
- Production and Consumption Statistics
- Import and Export Statistics
- Global Market Analysis and Forecast, 2021 to 2036
- Historical Market Size Value (USD Million) Analysis, 2021 to 2025
- Current and Future Market Size Value (USD Million) Projections, 2026 to 2036
- Y-o-Y Growth Trend Analysis
- Absolute $ Opportunity Analysis
- Global Market Pricing Analysis, 2021 to 2036
- Global Market Analysis and Forecast, By HLB Value Range, 2021 to 2036
- Introduction / Key Findings
- Historical Market Size Value (USD Million) Analysis By HLB Value Range, 2021 to 2025
- Current and Future Market Size Value (USD Million) Analysis and Forecast By HLB Value Range, 2026 to 2036
- Hydrophilic High-HLB Oil-in-Water Emulsifiers
- Lipophilic Low-HLB Water-in-Oil Emulsifiers
- Y-o-Y Growth Trend Analysis By HLB Value Range, 2021 to 2025
- Absolute $ Opportunity Analysis By HLB Value Range, 2026 to 2036
- Global Market Analysis and Forecast, By Physical Form, 2021 to 2036
- Introduction / Key Findings
- Historical Market Size Value (USD Million) Analysis By Physical Form, 2021 to 2025
- Current and Future Market Size Value (USD Million) Analysis and Forecast By Physical Form, 2026 to 2036
- Viscous Paste and Gel
- Spray-Cooled Powder and Pellets
- Liquid Blends
- Y-o-Y Growth Trend Analysis By Physical Form, 2021 to 2025
- Absolute $ Opportunity Analysis By Physical Form, 2026 to 2036
- Global Market Analysis and Forecast, By Lipid Feedstock, 2021 to 2036
- Introduction / Key Findings
- Historical Market Size Value (USD Million) Analysis By Lipid Feedstock, 2021 to 2025
- Current and Future Market Size Value (USD Million) Analysis and Forecast By Lipid Feedstock, 2026 to 2036
- Palm and Coconut Triglyceride Transesterified
- Rapeseed, Sunflower, and Soy Oil Derived
- Y-o-Y Growth Trend Analysis By Lipid Feedstock, 2021 to 2025
- Absolute $ Opportunity Analysis By Lipid Feedstock, 2026 to 2036
- Global Market Analysis and Forecast, By End-Use Application, 2021 to 2036
- Introduction / Key Findings
- Historical Market Size Value (USD Million) Analysis By End-Use Application, 2021 to 2025
- Current and Future Market Size Value (USD Million) Analysis and Forecast By End-Use Application, 2026 to 2036
- Bakery Dough Conditioning and Fine Pastry
- Ice Cream, Whipped Toppings, and Dairy Desserts
- Margarines, Sauces, and Mayonnaise Emulsions
- Ruminant Calf Milk Replacers and Cosmetics
- Y-o-Y Growth Trend Analysis By End-Use Application, 2021 to 2025
- Absolute $ Opportunity Analysis By End-Use Application, 2026 to 2036
- Global Market Analysis and Forecast, By Clean-Label and Certification Status, 2021 to 2036
- Introduction / Key Findings
- Historical Market Size Value (USD Million) Analysis By Clean-Label and Certification Status, 2021 to 2025
- Current and Future Market Size Value (USD Million) Analysis and Forecast By Clean-Label and Certification Status, 2026 to 2036
- Non-GMO, Kosher, and Halal Certified
- Standard Conventional Specification
- Y-o-Y Growth Trend Analysis By Clean-Label and Certification Status, 2021 to 2025
- Absolute $ Opportunity Analysis By Clean-Label and Certification Status, 2026 to 2036
- Global Market Analysis and Forecast, By Packaging Bulk Format, 2021 to 2036
- Introduction / Key Findings
- Historical Market Size Value (USD Million) Analysis By Packaging Bulk Format, 2021 to 2025
- Current and Future Market Size Value (USD Million) Analysis and Forecast By Packaging Bulk Format, 2026 to 2036
- 25 kg Multi-Wall Kraft Bags and Fiber Drums
- 1000 L IBC Totes and Bulk Tankers
- Small-Batch Foil Pouches and Pails
- Y-o-Y Growth Trend Analysis By Packaging Bulk Format, 2021 to 2025
- Absolute $ Opportunity Analysis By Packaging Bulk Format, 2026 to 2036
- Global Market Analysis and Forecast, By Customer Scale, 2021 to 2036
- Introduction / Key Findings
- Historical Market Size Value (USD Million) Analysis By Customer Scale, 2021 to 2025
- Current and Future Market Size Value (USD Million) Analysis and Forecast By Customer Scale, 2026 to 2036
- Multinational CPG and Beverage Groups
- Regional Co-Packers and Mid-Market Brands
- Artisanal and Foodservice Operators
- Y-o-Y Growth Trend Analysis By Customer Scale, 2021 to 2025
- Absolute $ Opportunity Analysis By Customer Scale, 2026 to 2036
- Global Market Analysis and Forecast, By Region, 2021 to 2036
- Introduction
- Historical Market Size Value (USD Million) Analysis By Region, 2021 to 2025
- Current Market Size Value (USD Million) Analysis and Forecast By Region, 2026 to 2036
- North America
- Latin America
- Western Europe
- Eastern Europe
- East Asia
- South Asia and Pacific
- Middle East and Africa
- Market Attractiveness Analysis By Region
- North America Market Analysis and Forecast, By Country, 2021 to 2036
- Historical Market Size Value (USD Million) Trend Analysis By Market Taxonomy, 2021 to 2025
- Market Size Value (USD Million) Forecast By Market Taxonomy, 2026 to 2036
- By Country
- United States
- Canada
- By HLB Value Range
- By Physical Form
- By Lipid Feedstock
- By End-Use Application
- By Clean-Label and Certification Status
- By Packaging Bulk Format
- By Customer Scale
- By Country
- Market Attractiveness Analysis
- By Country
- By HLB Value Range
- By Physical Form
- By Lipid Feedstock
- By End-Use Application
- By Clean-Label and Certification Status
- By Packaging Bulk Format
- By Customer Scale
- Key Takeaways
- Latin America Market Analysis and Forecast, By Country
- Historical Market Size Value (USD Million) Trend Analysis By Market Taxonomy, 2021 to 2025
- Market Size Value (USD Million) Forecast By Market Taxonomy, 2026 to 2036
- By Country
- Brazil
- Mexico
- Argentina
- Chile
- By HLB Value Range
- By Physical Form
- By Lipid Feedstock
- By End-Use Application
- By Clean-Label and Certification Status
- By Packaging Bulk Format
- By Customer Scale
- By Country
- Market Attractiveness Analysis
- By Country
- By HLB Value Range
- By Physical Form
- By Lipid Feedstock
- By End-Use Application
- By Clean-Label and Certification Status
- By Packaging Bulk Format
- By Customer Scale
- Key Takeaways
- Western Europe Market Analysis and Forecast, By Country
- Historical Market Size Value (USD Million) Trend Analysis By Market Taxonomy, 2021 to 2025
- Market Size Value (USD Million) Forecast By Market Taxonomy, 2026 to 2036
- By Country
- Germany
- France
- United Kingdom
- Italy
- Spain
- Benelux
- Nordics
- By HLB Value Range
- By Physical Form
- By Lipid Feedstock
- By End-Use Application
- By Clean-Label and Certification Status
- By Packaging Bulk Format
- By Customer Scale
- By Country
- Market Attractiveness Analysis
- By Country
- By HLB Value Range
- By Physical Form
- By Lipid Feedstock
- By End-Use Application
- By Clean-Label and Certification Status
- By Packaging Bulk Format
- By Customer Scale
- Key Takeaways
- Eastern Europe Market Analysis and Forecast, By Country
- Historical Market Size Value (USD Million) Trend Analysis By Market Taxonomy, 2021 to 2025
- Market Size Value (USD Million) Forecast By Market Taxonomy, 2026 to 2036
- By Country
- Poland
- Czech Republic
- Romania
- Hungary
- By HLB Value Range
- By Physical Form
- By Lipid Feedstock
- By End-Use Application
- By Clean-Label and Certification Status
- By Packaging Bulk Format
- By Customer Scale
- By Country
- Market Attractiveness Analysis
- By Country
- By HLB Value Range
- By Physical Form
- By Lipid Feedstock
- By End-Use Application
- By Clean-Label and Certification Status
- By Packaging Bulk Format
- By Customer Scale
- Key Takeaways
- East Asia Market Analysis and Forecast, By Country
- Historical Market Size Value (USD Million) Trend Analysis By Market Taxonomy, 2021 to 2025
- Market Size Value (USD Million) Forecast By Market Taxonomy, 2026 to 2036
- By Country
- China
- Japan
- South Korea
- By HLB Value Range
- By Physical Form
- By Lipid Feedstock
- By End-Use Application
- By Clean-Label and Certification Status
- By Packaging Bulk Format
- By Customer Scale
- By Country
- Market Attractiveness Analysis
- By Country
- By HLB Value Range
- By Physical Form
- By Lipid Feedstock
- By End-Use Application
- By Clean-Label and Certification Status
- By Packaging Bulk Format
- By Customer Scale
- Key Takeaways
- South Asia and Pacific Market Analysis and Forecast, By Country
- Historical Market Size Value (USD Million) Trend Analysis By Market Taxonomy, 2021 to 2025
- Market Size Value (USD Million) Forecast By Market Taxonomy, 2026 to 2036
- By Country
- India
- ASEAN
- Australia and New Zealand
- By HLB Value Range
- By Physical Form
- By Lipid Feedstock
- By End-Use Application
- By Clean-Label and Certification Status
- By Packaging Bulk Format
- By Customer Scale
- By Country
- Market Attractiveness Analysis
- By Country
- By HLB Value Range
- By Physical Form
- By Lipid Feedstock
- By End-Use Application
- By Clean-Label and Certification Status
- By Packaging Bulk Format
- By Customer Scale
- Key Takeaways
- Middle East and Africa Market Analysis and Forecast, By Country
- Historical Market Size Value (USD Million) Trend Analysis By Market Taxonomy, 2021 to 2025
- Market Size Value (USD Million) Forecast By Market Taxonomy, 2026 to 2036
- By Country
- GCC Countries
- South Africa
- Türkiye
- Israel
- By HLB Value Range
- By Physical Form
- By Lipid Feedstock
- By End-Use Application
- By Clean-Label and Certification Status
- By Packaging Bulk Format
- By Customer Scale
- By Country
- Market Attractiveness Analysis
- By Country
- By HLB Value Range
- By Physical Form
- By Lipid Feedstock
- By End-Use Application
- By Clean-Label and Certification Status
- By Packaging Bulk Format
- By Customer Scale
- Key Takeaways
- Key Countries Market Analysis
- United States
- Pricing Analysis
- Market Share Analysis, 2025
- By HLB Value Range
- By Physical Form
- By Lipid Feedstock
- By End-Use Application
- By Clean-Label and Certification Status
- By Packaging Bulk Format
- By Customer Scale
- Canada
- Pricing Analysis
- Market Share Analysis, 2025
- By HLB Value Range
- By Physical Form
- By Lipid Feedstock
- By End-Use Application
- By Clean-Label and Certification Status
- By Packaging Bulk Format
- By Customer Scale
- Mexico
- Pricing Analysis
- Market Share Analysis, 2025
- By HLB Value Range
- By Physical Form
- By Lipid Feedstock
- By End-Use Application
- By Clean-Label and Certification Status
- By Packaging Bulk Format
- By Customer Scale
- Brazil
- Pricing Analysis
- Market Share Analysis, 2025
- By HLB Value Range
- By Physical Form
- By Lipid Feedstock
- By End-Use Application
- By Clean-Label and Certification Status
- By Packaging Bulk Format
- By Customer Scale
- Chile
- Pricing Analysis
- Market Share Analysis, 2025
- By HLB Value Range
- By Physical Form
- By Lipid Feedstock
- By End-Use Application
- By Clean-Label and Certification Status
- By Packaging Bulk Format
- By Customer Scale
- Germany
- Pricing Analysis
- Market Share Analysis, 2025
- By HLB Value Range
- By Physical Form
- By Lipid Feedstock
- By End-Use Application
- By Clean-Label and Certification Status
- By Packaging Bulk Format
- By Customer Scale
- United Kingdom
- Pricing Analysis
- Market Share Analysis, 2025
- By HLB Value Range
- By Physical Form
- By Lipid Feedstock
- By End-Use Application
- By Clean-Label and Certification Status
- By Packaging Bulk Format
- By Customer Scale
- Italy
- Pricing Analysis
- Market Share Analysis, 2025
- By HLB Value Range
- By Physical Form
- By Lipid Feedstock
- By End-Use Application
- By Clean-Label and Certification Status
- By Packaging Bulk Format
- By Customer Scale
- Spain
- Pricing Analysis
- Market Share Analysis, 2025
- By HLB Value Range
- By Physical Form
- By Lipid Feedstock
- By End-Use Application
- By Clean-Label and Certification Status
- By Packaging Bulk Format
- By Customer Scale
- France
- Pricing Analysis
- Market Share Analysis, 2025
- By HLB Value Range
- By Physical Form
- By Lipid Feedstock
- By End-Use Application
- By Clean-Label and Certification Status
- By Packaging Bulk Format
- By Customer Scale
- India
- Pricing Analysis
- Market Share Analysis, 2025
- By HLB Value Range
- By Physical Form
- By Lipid Feedstock
- By End-Use Application
- By Clean-Label and Certification Status
- By Packaging Bulk Format
- By Customer Scale
- ASEAN
- Pricing Analysis
- Market Share Analysis, 2025
- By HLB Value Range
- By Physical Form
- By Lipid Feedstock
- By End-Use Application
- By Clean-Label and Certification Status
- By Packaging Bulk Format
- By Customer Scale
- Australia and New Zealand
- Pricing Analysis
- Market Share Analysis, 2025
- By HLB Value Range
- By Physical Form
- By Lipid Feedstock
- By End-Use Application
- By Clean-Label and Certification Status
- By Packaging Bulk Format
- By Customer Scale
- China
- Pricing Analysis
- Market Share Analysis, 2025
- By HLB Value Range
- By Physical Form
- By Lipid Feedstock
- By End-Use Application
- By Clean-Label and Certification Status
- By Packaging Bulk Format
- By Customer Scale
- Japan
- Pricing Analysis
- Market Share Analysis, 2025
- By HLB Value Range
- By Physical Form
- By Lipid Feedstock
- By End-Use Application
- By Clean-Label and Certification Status
- By Packaging Bulk Format
- By Customer Scale
- South Korea
- Pricing Analysis
- Market Share Analysis, 2025
- By HLB Value Range
- By Physical Form
- By Lipid Feedstock
- By End-Use Application
- By Clean-Label and Certification Status
- By Packaging Bulk Format
- By Customer Scale
- Poland
- Pricing Analysis
- Market Share Analysis, 2025
- By HLB Value Range
- By Physical Form
- By Lipid Feedstock
- By End-Use Application
- By Clean-Label and Certification Status
- By Packaging Bulk Format
- By Customer Scale
- Hungary
- Pricing Analysis
- Market Share Analysis, 2025
- By HLB Value Range
- By Physical Form
- By Lipid Feedstock
- By End-Use Application
- By Clean-Label and Certification Status
- By Packaging Bulk Format
- By Customer Scale
- Türkiye
- Pricing Analysis
- Market Share Analysis, 2025
- By HLB Value Range
- By Physical Form
- By Lipid Feedstock
- By End-Use Application
- By Clean-Label and Certification Status
- By Packaging Bulk Format
- By Customer Scale
- South Africa
- Pricing Analysis
- Market Share Analysis, 2025
- By HLB Value Range
- By Physical Form
- By Lipid Feedstock
- By End-Use Application
- By Clean-Label and Certification Status
- By Packaging Bulk Format
- By Customer Scale
- United States
- Market Structure Analysis
- Competition Dashboard
- Competition Benchmarking
- Market Share Analysis of Top Players
- By Regional
- By HLB Value Range
- By Physical Form
- By Lipid Feedstock
- By End-Use Application
- By Clean-Label and Certification Status
- By Packaging Bulk Format
- By Customer Scale
- Emerging Startups
- Innovation Benchmarking
- Competition Analysis
- Competition Deep Dive
- Groupe Avril Oleon NV
- Overview
- Product Portfolio
- Profitability by Market Segments
- Sales Footprint
- Strategy Overview
- Marketing Strategy
- Product Strategy
- Channel Strategy
- Mitsubishi Chemical Group Corporation
- Croda International Plc
- Kerry Group plc
- Evonik Industries AG
- Stearinerie Dubois
- Dai-ichi Kogyo Seiyaku Co., Ltd.
- Palsgaard A/S
- Corbion N.V.
- BASF SE
- Groupe Avril Oleon NV
- Case Studies
- Success Stories
- Recent Developments
- Competition Deep Dive
- Assumptions & Acronyms Used
List of Tables
- Table 1: Global Market Value (USD Million) Forecast by Region, 2021 to 2036
- Table 2: Global Market Value (USD Million) Forecast by HLB Value Range, 2021 to 2036
- Table 3: Global Market Value (USD Million) Forecast by Physical Form, 2021 to 2036
- Table 4: Global Market Value (USD Million) Forecast by Lipid Feedstock, 2021 to 2036
- Table 5: Global Market Value (USD Million) Forecast by End-Use Application, 2021 to 2036
- Table 6: Global Market Value (USD Million) Forecast by Clean-Label and Certification Status, 2021 to 2036
- Table 7: Global Market Value (USD Million) Forecast by Packaging Bulk Format, 2021 to 2036
- Table 8: Global Market Value (USD Million) Forecast by Customer Scale, 2021 to 2036
- Table 9: North America Market Value (USD Million) Forecast by Country, 2021 to 2036
- Table 10: North America Market Value (USD Million) Forecast by HLB Value Range, 2021 to 2036
- Table 11: North America Market Value (USD Million) Forecast by Physical Form, 2021 to 2036
- Table 12: North America Market Value (USD Million) Forecast by Lipid Feedstock, 2021 to 2036
- Table 13: North America Market Value (USD Million) Forecast by End-Use Application, 2021 to 2036
- Table 14: North America Market Value (USD Million) Forecast by Clean-Label and Certification Status, 2021 to 2036
- Table 15: North America Market Value (USD Million) Forecast by Packaging Bulk Format, 2021 to 2036
- Table 16: North America Market Value (USD Million) Forecast by Customer Scale, 2021 to 2036
- Table 17: Latin America Market Value (USD Million) Forecast by Country, 2021 to 2036
- Table 18: Latin America Market Value (USD Million) Forecast by HLB Value Range, 2021 to 2036
- Table 19: Latin America Market Value (USD Million) Forecast by Physical Form, 2021 to 2036
- Table 20: Latin America Market Value (USD Million) Forecast by Lipid Feedstock, 2021 to 2036
- Table 21: Latin America Market Value (USD Million) Forecast by End-Use Application, 2021 to 2036
- Table 22: Latin America Market Value (USD Million) Forecast by Clean-Label and Certification Status, 2021 to 2036
- Table 23: Latin America Market Value (USD Million) Forecast by Packaging Bulk Format, 2021 to 2036
- Table 24: Latin America Market Value (USD Million) Forecast by Customer Scale, 2021 to 2036
- Table 25: Western Europe Market Value (USD Million) Forecast by Country, 2021 to 2036
- Table 26: Western Europe Market Value (USD Million) Forecast by HLB Value Range, 2021 to 2036
- Table 27: Western Europe Market Value (USD Million) Forecast by Physical Form, 2021 to 2036
- Table 28: Western Europe Market Value (USD Million) Forecast by Lipid Feedstock, 2021 to 2036
- Table 29: Western Europe Market Value (USD Million) Forecast by End-Use Application, 2021 to 2036
- Table 30: Western Europe Market Value (USD Million) Forecast by Clean-Label and Certification Status, 2021 to 2036
- Table 31: Western Europe Market Value (USD Million) Forecast by Packaging Bulk Format, 2021 to 2036
- Table 32: Western Europe Market Value (USD Million) Forecast by Customer Scale, 2021 to 2036
- Table 33: Eastern Europe Market Value (USD Million) Forecast by Country, 2021 to 2036
- Table 34: Eastern Europe Market Value (USD Million) Forecast by HLB Value Range, 2021 to 2036
- Table 35: Eastern Europe Market Value (USD Million) Forecast by Physical Form, 2021 to 2036
- Table 36: Eastern Europe Market Value (USD Million) Forecast by Lipid Feedstock, 2021 to 2036
- Table 37: Eastern Europe Market Value (USD Million) Forecast by End-Use Application, 2021 to 2036
- Table 38: Eastern Europe Market Value (USD Million) Forecast by Clean-Label and Certification Status, 2021 to 2036
- Table 39: Eastern Europe Market Value (USD Million) Forecast by Packaging Bulk Format, 2021 to 2036
- Table 40: Eastern Europe Market Value (USD Million) Forecast by Customer Scale, 2021 to 2036
- Table 41: East Asia Market Value (USD Million) Forecast by Country, 2021 to 2036
- Table 42: East Asia Market Value (USD Million) Forecast by HLB Value Range, 2021 to 2036
- Table 43: East Asia Market Value (USD Million) Forecast by Physical Form, 2021 to 2036
- Table 44: East Asia Market Value (USD Million) Forecast by Lipid Feedstock, 2021 to 2036
- Table 45: East Asia Market Value (USD Million) Forecast by End-Use Application, 2021 to 2036
- Table 46: East Asia Market Value (USD Million) Forecast by Clean-Label and Certification Status, 2021 to 2036
- Table 47: East Asia Market Value (USD Million) Forecast by Packaging Bulk Format, 2021 to 2036
- Table 48: East Asia Market Value (USD Million) Forecast by Customer Scale, 2021 to 2036
- Table 49: South Asia and Pacific Market Value (USD Million) Forecast by Country, 2021 to 2036
- Table 50: South Asia and Pacific Market Value (USD Million) Forecast by HLB Value Range, 2021 to 2036
- Table 51: South Asia and Pacific Market Value (USD Million) Forecast by Physical Form, 2021 to 2036
- Table 52: South Asia and Pacific Market Value (USD Million) Forecast by Lipid Feedstock, 2021 to 2036
- Table 53: South Asia and Pacific Market Value (USD Million) Forecast by End-Use Application, 2021 to 2036
- Table 54: South Asia and Pacific Market Value (USD Million) Forecast by Clean-Label and Certification Status, 2021 to 2036
- Table 55: South Asia and Pacific Market Value (USD Million) Forecast by Packaging Bulk Format, 2021 to 2036
- Table 56: South Asia and Pacific Market Value (USD Million) Forecast by Customer Scale, 2021 to 2036
- Table 57: Middle East and Africa Market Value (USD Million) Forecast by Country, 2021 to 2036
- Table 58: Middle East and Africa Market Value (USD Million) Forecast by HLB Value Range, 2021 to 2036
- Table 59: Middle East and Africa Market Value (USD Million) Forecast by Physical Form, 2021 to 2036
- Table 60: Middle East and Africa Market Value (USD Million) Forecast by Lipid Feedstock, 2021 to 2036
- Table 61: Middle East and Africa Market Value (USD Million) Forecast by End-Use Application, 2021 to 2036
- Table 62: Middle East and Africa Market Value (USD Million) Forecast by Clean-Label and Certification Status, 2021 to 2036
- Table 63: Middle East and Africa Market Value (USD Million) Forecast by Packaging Bulk Format, 2021 to 2036
- Table 64: Middle East and Africa Market Value (USD Million) Forecast by Customer Scale, 2021 to 2036
List of Figures
- Figure 1: Global Market Pricing Analysis
- Figure 2: Global Market Value (USD Million) Forecast 2021-2036
- Figure 3: Global Market Value Share and BPS Analysis by HLB Value Range, 2026 and 2036
- Figure 4: Global Market Y-o-Y Growth Comparison by HLB Value Range, 2026-2036
- Figure 5: Global Market Attractiveness Analysis by HLB Value Range
- Figure 6: Global Market Value Share and BPS Analysis by Physical Form, 2026 and 2036
- Figure 7: Global Market Y-o-Y Growth Comparison by Physical Form, 2026-2036
- Figure 8: Global Market Attractiveness Analysis by Physical Form
- Figure 9: Global Market Value Share and BPS Analysis by Lipid Feedstock, 2026 and 2036
- Figure 10: Global Market Y-o-Y Growth Comparison by Lipid Feedstock, 2026-2036
- Figure 11: Global Market Attractiveness Analysis by Lipid Feedstock
- Figure 12: Global Market Value Share and BPS Analysis by End-Use Application, 2026 and 2036
- Figure 13: Global Market Y-o-Y Growth Comparison by End-Use Application, 2026-2036
- Figure 14: Global Market Attractiveness Analysis by End-Use Application
- Figure 15: Global Market Value Share and BPS Analysis by Clean-Label and Certification Status, 2026 and 2036
- Figure 16: Global Market Y-o-Y Growth Comparison by Clean-Label and Certification Status, 2026-2036
- Figure 17: Global Market Attractiveness Analysis by Clean-Label and Certification Status
- Figure 18: Global Market Value Share and BPS Analysis by Packaging Bulk Format, 2026 and 2036
- Figure 19: Global Market Y-o-Y Growth Comparison by Packaging Bulk Format, 2026-2036
- Figure 20: Global Market Attractiveness Analysis by Packaging Bulk Format
- Figure 21: Global Market Value Share and BPS Analysis by Customer Scale, 2026 and 2036
- Figure 22: Global Market Y-o-Y Growth Comparison by Customer Scale, 2026-2036
- Figure 23: Global Market Attractiveness Analysis by Customer Scale
- Figure 24: Global Market Value (USD Million) Share and BPS Analysis by Region, 2026 and 2036
- Figure 25: Global Market Y-o-Y Growth Comparison by Region, 2026-2036
- Figure 26: Global Market Attractiveness Analysis by Region
- Figure 27: North America Market Incremental Dollar Opportunity, 2026-2036
- Figure 28: Latin America Market Incremental Dollar Opportunity, 2026-2036
- Figure 29: Western Europe Market Incremental Dollar Opportunity, 2026-2036
- Figure 30: Eastern Europe Market Incremental Dollar Opportunity, 2026-2036
- Figure 31: East Asia Market Incremental Dollar Opportunity, 2026-2036
- Figure 32: South Asia and Pacific Market Incremental Dollar Opportunity, 2026-2036
- Figure 33: Middle East and Africa Market Incremental Dollar Opportunity, 2026-2036
- Figure 34: North America Market Value Share and BPS Analysis by Country, 2026 and 2036
- Figure 35: North America Market Value Share and BPS Analysis by HLB Value Range, 2026 and 2036
- Figure 36: North America Market Y-o-Y Growth Comparison by HLB Value Range, 2026-2036
- Figure 37: North America Market Attractiveness Analysis by HLB Value Range
- Figure 38: North America Market Value Share and BPS Analysis by Physical Form, 2026 and 2036
- Figure 39: North America Market Y-o-Y Growth Comparison by Physical Form, 2026-2036
- Figure 40: North America Market Attractiveness Analysis by Physical Form
- Figure 41: North America Market Value Share and BPS Analysis by Lipid Feedstock, 2026 and 2036
- Figure 42: North America Market Y-o-Y Growth Comparison by Lipid Feedstock, 2026-2036
- Figure 43: North America Market Attractiveness Analysis by Lipid Feedstock
- Figure 44: North America Market Value Share and BPS Analysis by End-Use Application, 2026 and 2036
- Figure 45: North America Market Y-o-Y Growth Comparison by End-Use Application, 2026-2036
- Figure 46: North America Market Attractiveness Analysis by End-Use Application
- Figure 47: North America Market Value Share and BPS Analysis by Clean-Label and Certification Status, 2026 and 2036
- Figure 48: North America Market Y-o-Y Growth Comparison by Clean-Label and Certification Status, 2026-2036
- Figure 49: North America Market Attractiveness Analysis by Clean-Label and Certification Status
- Figure 50: North America Market Value Share and BPS Analysis by Packaging Bulk Format, 2026 and 2036
- Figure 51: North America Market Y-o-Y Growth Comparison by Packaging Bulk Format, 2026-2036
- Figure 52: North America Market Attractiveness Analysis by Packaging Bulk Format
- Figure 53: North America Market Value Share and BPS Analysis by Customer Scale, 2026 and 2036
- Figure 54: North America Market Y-o-Y Growth Comparison by Customer Scale, 2026-2036
- Figure 55: North America Market Attractiveness Analysis by Customer Scale
- Figure 56: Latin America Market Value Share and BPS Analysis by Country, 2026 and 2036
- Figure 57: Latin America Market Value Share and BPS Analysis by HLB Value Range, 2026 and 2036
- Figure 58: Latin America Market Y-o-Y Growth Comparison by HLB Value Range, 2026-2036
- Figure 59: Latin America Market Attractiveness Analysis by HLB Value Range
- Figure 60: Latin America Market Value Share and BPS Analysis by Physical Form, 2026 and 2036
- Figure 61: Latin America Market Y-o-Y Growth Comparison by Physical Form, 2026-2036
- Figure 62: Latin America Market Attractiveness Analysis by Physical Form
- Figure 63: Latin America Market Value Share and BPS Analysis by Lipid Feedstock, 2026 and 2036
- Figure 64: Latin America Market Y-o-Y Growth Comparison by Lipid Feedstock, 2026-2036
- Figure 65: Latin America Market Attractiveness Analysis by Lipid Feedstock
- Figure 66: Latin America Market Value Share and BPS Analysis by End-Use Application, 2026 and 2036
- Figure 67: Latin America Market Y-o-Y Growth Comparison by End-Use Application, 2026-2036
- Figure 68: Latin America Market Attractiveness Analysis by End-Use Application
- Figure 69: Latin America Market Value Share and BPS Analysis by Clean-Label and Certification Status, 2026 and 2036
- Figure 70: Latin America Market Y-o-Y Growth Comparison by Clean-Label and Certification Status, 2026-2036
- Figure 71: Latin America Market Attractiveness Analysis by Clean-Label and Certification Status
- Figure 72: Latin America Market Value Share and BPS Analysis by Packaging Bulk Format, 2026 and 2036
- Figure 73: Latin America Market Y-o-Y Growth Comparison by Packaging Bulk Format, 2026-2036
- Figure 74: Latin America Market Attractiveness Analysis by Packaging Bulk Format
- Figure 75: Latin America Market Value Share and BPS Analysis by Customer Scale, 2026 and 2036
- Figure 76: Latin America Market Y-o-Y Growth Comparison by Customer Scale, 2026-2036
- Figure 77: Latin America Market Attractiveness Analysis by Customer Scale
- Figure 78: Western Europe Market Value Share and BPS Analysis by Country, 2026 and 2036
- Figure 79: Western Europe Market Value Share and BPS Analysis by HLB Value Range, 2026 and 2036
- Figure 80: Western Europe Market Y-o-Y Growth Comparison by HLB Value Range, 2026-2036
- Figure 81: Western Europe Market Attractiveness Analysis by HLB Value Range
- Figure 82: Western Europe Market Value Share and BPS Analysis by Physical Form, 2026 and 2036
- Figure 83: Western Europe Market Y-o-Y Growth Comparison by Physical Form, 2026-2036
- Figure 84: Western Europe Market Attractiveness Analysis by Physical Form
- Figure 85: Western Europe Market Value Share and BPS Analysis by Lipid Feedstock, 2026 and 2036
- Figure 86: Western Europe Market Y-o-Y Growth Comparison by Lipid Feedstock, 2026-2036
- Figure 87: Western Europe Market Attractiveness Analysis by Lipid Feedstock
- Figure 88: Western Europe Market Value Share and BPS Analysis by End-Use Application, 2026 and 2036
- Figure 89: Western Europe Market Y-o-Y Growth Comparison by End-Use Application, 2026-2036
- Figure 90: Western Europe Market Attractiveness Analysis by End-Use Application
- Figure 91: Western Europe Market Value Share and BPS Analysis by Clean-Label and Certification Status, 2026 and 2036
- Figure 92: Western Europe Market Y-o-Y Growth Comparison by Clean-Label and Certification Status, 2026-2036
- Figure 93: Western Europe Market Attractiveness Analysis by Clean-Label and Certification Status
- Figure 94: Western Europe Market Value Share and BPS Analysis by Packaging Bulk Format, 2026 and 2036
- Figure 95: Western Europe Market Y-o-Y Growth Comparison by Packaging Bulk Format, 2026-2036
- Figure 96: Western Europe Market Attractiveness Analysis by Packaging Bulk Format
- Figure 97: Western Europe Market Value Share and BPS Analysis by Customer Scale, 2026 and 2036
- Figure 98: Western Europe Market Y-o-Y Growth Comparison by Customer Scale, 2026-2036
- Figure 99: Western Europe Market Attractiveness Analysis by Customer Scale
- Figure 100: Eastern Europe Market Value Share and BPS Analysis by Country, 2026 and 2036
- Figure 101: Eastern Europe Market Value Share and BPS Analysis by HLB Value Range, 2026 and 2036
- Figure 102: Eastern Europe Market Y-o-Y Growth Comparison by HLB Value Range, 2026-2036
- Figure 103: Eastern Europe Market Attractiveness Analysis by HLB Value Range
- Figure 104: Eastern Europe Market Value Share and BPS Analysis by Physical Form, 2026 and 2036
- Figure 105: Eastern Europe Market Y-o-Y Growth Comparison by Physical Form, 2026-2036
- Figure 106: Eastern Europe Market Attractiveness Analysis by Physical Form
- Figure 107: Eastern Europe Market Value Share and BPS Analysis by Lipid Feedstock, 2026 and 2036
- Figure 108: Eastern Europe Market Y-o-Y Growth Comparison by Lipid Feedstock, 2026-2036
- Figure 109: Eastern Europe Market Attractiveness Analysis by Lipid Feedstock
- Figure 110: Eastern Europe Market Value Share and BPS Analysis by End-Use Application, 2026 and 2036
- Figure 111: Eastern Europe Market Y-o-Y Growth Comparison by End-Use Application, 2026-2036
- Figure 112: Eastern Europe Market Attractiveness Analysis by End-Use Application
- Figure 113: Eastern Europe Market Value Share and BPS Analysis by Clean-Label and Certification Status, 2026 and 2036
- Figure 114: Eastern Europe Market Y-o-Y Growth Comparison by Clean-Label and Certification Status, 2026-2036
- Figure 115: Eastern Europe Market Attractiveness Analysis by Clean-Label and Certification Status
- Figure 116: Eastern Europe Market Value Share and BPS Analysis by Packaging Bulk Format, 2026 and 2036
- Figure 117: Eastern Europe Market Y-o-Y Growth Comparison by Packaging Bulk Format, 2026-2036
- Figure 118: Eastern Europe Market Attractiveness Analysis by Packaging Bulk Format
- Figure 119: Eastern Europe Market Value Share and BPS Analysis by Customer Scale, 2026 and 2036
- Figure 120: Eastern Europe Market Y-o-Y Growth Comparison by Customer Scale, 2026-2036
- Figure 121: Eastern Europe Market Attractiveness Analysis by Customer Scale
- Figure 122: East Asia Market Value Share and BPS Analysis by Country, 2026 and 2036
- Figure 123: East Asia Market Value Share and BPS Analysis by HLB Value Range, 2026 and 2036
- Figure 124: East Asia Market Y-o-Y Growth Comparison by HLB Value Range, 2026-2036
- Figure 125: East Asia Market Attractiveness Analysis by HLB Value Range
- Figure 126: East Asia Market Value Share and BPS Analysis by Physical Form, 2026 and 2036
- Figure 127: East Asia Market Y-o-Y Growth Comparison by Physical Form, 2026-2036
- Figure 128: East Asia Market Attractiveness Analysis by Physical Form
- Figure 129: East Asia Market Value Share and BPS Analysis by Lipid Feedstock, 2026 and 2036
- Figure 130: East Asia Market Y-o-Y Growth Comparison by Lipid Feedstock, 2026-2036
- Figure 131: East Asia Market Attractiveness Analysis by Lipid Feedstock
- Figure 132: East Asia Market Value Share and BPS Analysis by End-Use Application, 2026 and 2036
- Figure 133: East Asia Market Y-o-Y Growth Comparison by End-Use Application, 2026-2036
- Figure 134: East Asia Market Attractiveness Analysis by End-Use Application
- Figure 135: East Asia Market Value Share and BPS Analysis by Clean-Label and Certification Status, 2026 and 2036
- Figure 136: East Asia Market Y-o-Y Growth Comparison by Clean-Label and Certification Status, 2026-2036
- Figure 137: East Asia Market Attractiveness Analysis by Clean-Label and Certification Status
- Figure 138: East Asia Market Value Share and BPS Analysis by Packaging Bulk Format, 2026 and 2036
- Figure 139: East Asia Market Y-o-Y Growth Comparison by Packaging Bulk Format, 2026-2036
- Figure 140: East Asia Market Attractiveness Analysis by Packaging Bulk Format
- Figure 141: East Asia Market Value Share and BPS Analysis by Customer Scale, 2026 and 2036
- Figure 142: East Asia Market Y-o-Y Growth Comparison by Customer Scale, 2026-2036
- Figure 143: East Asia Market Attractiveness Analysis by Customer Scale
- Figure 144: South Asia and Pacific Market Value Share and BPS Analysis by Country, 2026 and 2036
- Figure 145: South Asia and Pacific Market Value Share and BPS Analysis by HLB Value Range, 2026 and 2036
- Figure 146: South Asia and Pacific Market Y-o-Y Growth Comparison by HLB Value Range, 2026-2036
- Figure 147: South Asia and Pacific Market Attractiveness Analysis by HLB Value Range
- Figure 148: South Asia and Pacific Market Value Share and BPS Analysis by Physical Form, 2026 and 2036
- Figure 149: South Asia and Pacific Market Y-o-Y Growth Comparison by Physical Form, 2026-2036
- Figure 150: South Asia and Pacific Market Attractiveness Analysis by Physical Form
- Figure 151: South Asia and Pacific Market Value Share and BPS Analysis by Lipid Feedstock, 2026 and 2036
- Figure 152: South Asia and Pacific Market Y-o-Y Growth Comparison by Lipid Feedstock, 2026-2036
- Figure 153: South Asia and Pacific Market Attractiveness Analysis by Lipid Feedstock
- Figure 154: South Asia and Pacific Market Value Share and BPS Analysis by End-Use Application, 2026 and 2036
- Figure 155: South Asia and Pacific Market Y-o-Y Growth Comparison by End-Use Application, 2026-2036
- Figure 156: South Asia and Pacific Market Attractiveness Analysis by End-Use Application
- Figure 157: South Asia and Pacific Market Value Share and BPS Analysis by Clean-Label and Certification Status, 2026 and 2036
- Figure 158: South Asia and Pacific Market Y-o-Y Growth Comparison by Clean-Label and Certification Status, 2026-2036
- Figure 159: South Asia and Pacific Market Attractiveness Analysis by Clean-Label and Certification Status
- Figure 160: South Asia and Pacific Market Value Share and BPS Analysis by Packaging Bulk Format, 2026 and 2036
- Figure 161: South Asia and Pacific Market Y-o-Y Growth Comparison by Packaging Bulk Format, 2026-2036
- Figure 162: South Asia and Pacific Market Attractiveness Analysis by Packaging Bulk Format
- Figure 163: South Asia and Pacific Market Value Share and BPS Analysis by Customer Scale, 2026 and 2036
- Figure 164: South Asia and Pacific Market Y-o-Y Growth Comparison by Customer Scale, 2026-2036
- Figure 165: South Asia and Pacific Market Attractiveness Analysis by Customer Scale
- Figure 166: Middle East and Africa Market Value Share and BPS Analysis by Country, 2026 and 2036
- Figure 167: Middle East and Africa Market Value Share and BPS Analysis by HLB Value Range, 2026 and 2036
- Figure 168: Middle East and Africa Market Y-o-Y Growth Comparison by HLB Value Range, 2026-2036
- Figure 169: Middle East and Africa Market Attractiveness Analysis by HLB Value Range
- Figure 170: Middle East and Africa Market Value Share and BPS Analysis by Physical Form, 2026 and 2036
- Figure 171: Middle East and Africa Market Y-o-Y Growth Comparison by Physical Form, 2026-2036
- Figure 172: Middle East and Africa Market Attractiveness Analysis by Physical Form
- Figure 173: Middle East and Africa Market Value Share and BPS Analysis by Lipid Feedstock, 2026 and 2036
- Figure 174: Middle East and Africa Market Y-o-Y Growth Comparison by Lipid Feedstock, 2026-2036
- Figure 175: Middle East and Africa Market Attractiveness Analysis by Lipid Feedstock
- Figure 176: Middle East and Africa Market Value Share and BPS Analysis by End-Use Application, 2026 and 2036
- Figure 177: Middle East and Africa Market Y-o-Y Growth Comparison by End-Use Application, 2026-2036
- Figure 178: Middle East and Africa Market Attractiveness Analysis by End-Use Application
- Figure 179: Middle East and Africa Market Value Share and BPS Analysis by Clean-Label and Certification Status, 2026 and 2036
- Figure 180: Middle East and Africa Market Y-o-Y Growth Comparison by Clean-Label and Certification Status, 2026-2036
- Figure 181: Middle East and Africa Market Attractiveness Analysis by Clean-Label and Certification Status
- Figure 182: Middle East and Africa Market Value Share and BPS Analysis by Packaging Bulk Format, 2026 and 2036
- Figure 183: Middle East and Africa Market Y-o-Y Growth Comparison by Packaging Bulk Format, 2026-2036
- Figure 184: Middle East and Africa Market Attractiveness Analysis by Packaging Bulk Format
- Figure 185: Middle East and Africa Market Value Share and BPS Analysis by Customer Scale, 2026 and 2036
- Figure 186: Middle East and Africa Market Y-o-Y Growth Comparison by Customer Scale, 2026-2036
- Figure 187: Middle East and Africa Market Attractiveness Analysis by Customer Scale
- Figure 188: Global Market - Tier Structure Analysis
- Figure 189: Global Market - Company Share Analysis
Frequently Asked Questions
What is the 2026 market valuation for sucroglycerides and the 2036 forecast?
Global sucroglycerides market value reached USD 94.8 million in 2025 and stands at an estimated USD 99.9 million in 2026. Category valuation is projected to attain USD 169.0 million by 2036 as food and cosmetic processors adopt solvent-free E474 emulsifiers. At what compound annual rate will the sucroglycerides market grow through 2036? Global sucroglycerides valuation progresses at a 5.4% CAGR between 2026 and 2036, creating USD 69.1 million in incremental value across industrial bakery and calf-feed accounts.
Which HLB value range segment leads global sucroglycerides consumption?
Hydrophilic High-HLB Oil-in-Water Emulsifiers command 58.4% of HLB segment demand in 2026 because high-HLB sucrose ester and glyceride complexes stabilize fine oil droplets in aqueous batters and milk replacers.
Which physical form category leads the global sucroglycerides market?
Viscous Paste and Gel holds 53.2% of physical form demand in 2026 because direct solvent-free transesterification yields co-melted pastes that industrial plants meter directly into heated fat tanks.
Which country exhibits the highest growth rate for sucroglycerides?
Brazil leads country-level sucroglycerides expansion at a 6.1% annual rate through 2036, supported by abundant cane-sugar and vegetable-oil feedstocks plus expanding UHT dairy and biscuit production.
Which companies represent the primary suppliers of sucroglycerides?
Groupe Avril Oleon NV and Mitsubishi Chemical Group Corporation with Croda International Plc plus Kerry Group plc and Evonik Industries AG anchor global supply. Stearinerie Dubois and Dai-ichi Kogyo Seiyaku Co., Ltd. with Palsgaard A/S plus Corbion N.V. and BASF SE round out the ten primary producers.
Preview the report firsthand - request a free sample
Get SampleGet the brochure for pricing and purchase details.
Get PDF
