Telemetry Market Outlook (2023 to 2033)

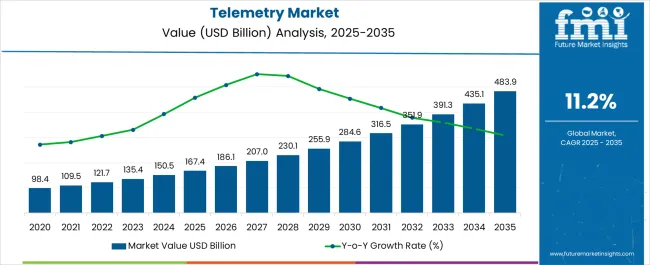
The global telemetry market size was anticipated to be worth USD 135,354.5 million in 2023. The market is likely to expand to USD 392,452.1 million by 2033, with a steep rise in the CAGR of 11.2% during the forecast period.

Sudden elevation is attributed to the market’s growth and demand and returning to the pre-pandemic levels with lucrative opportunities. The impact of COVID-19 globally has been unparalleled and overwhelming, with experiencing a low demand across all the regions amidst the pandemic.

Telemetry is an automatic data measurement and wireless transmission from remote terminals. In layman's terms - sensors at the source measure either physical data such as pressure or temperature or electrical data such as current or voltage. This data is later transmitted to the receiving points to be monitored and analyzed.

Measurements are transferred to particular electrical voltages. These voltages are mixed by a multiplexer, along with timing data, into a solo data stream for transmission to a remote receiver. Once delivered, the data stream is split into its initial elements, and the data is demonstrated and administered based on the user specifications. Such beneficial factors are accountable for the growing demand for telemetry.

Telemetry monitoring is widely used and is popular in the healthcare sector. In fact, in this sector, Wireless Medical Telemetry Service (WMTS) is becoming of much significance. The telemetry market is predicted to exhibit considerable growth in the vehicle (transportation, telematics, and logistics), automation, and retail sectors.

The growing adoption of smart devices coupled with advanced technologies and the development of the cloud computing market is said to drive the global market.

Attributes Details
Global Telemetry Market Valuation in 2022 USD 123,490.4 million
Estimated Global Market Share in 2023 USD 135,354.5 million
Forecasted Global Market Size by 2033 USD 392,452.1 million
Projected Global Market Growth Rate from 2023 to 2033 11.2% CAGR
Historical Market Growth Rate from 2018 to 2022 9.1%

Top Telemetry Market Trends & Dynamics

Healthcare Industry Witnessing Growing Demand of Telemetry Devices

The increasing use of telemetry devices in the healthcare industry to monitor cardiac abnormalities is encouraging the growth of the telemetry market across the world. Further, the rising adoption of telemetry monitoring devices is due to the alarming rise in cardiovascular diseases (CVDs) around the globe. For example,

Every year, nearly 17 million individuals succumb to cardiovascular diseases, which is around 32% of overall deaths in the world. Telemetry monitoring devices are extremely useful for meeting patients who are susceptible to CVDs.

Telemetry Benefits Defense & Space Segment

Telemetry monitoring finds a broad range of use in advanced and complex systems such as spacecraft, missiles, oil rigs, Remotely Piloted Vehicles (RPVs), and chemical plants. It enables and sends swift alerting, observation, and documents vitals for the effective and safe functioning of the systems. Further, to gather data from spacecraft and satellites, agencies like NASA, ISRO, etc., use telemetry solutions.

In the developing advanced levels of satellites and aircraft, telemetry devices portray a significant role. To enhance and analyze the system’s performance, engineers who construct these complex systems require crucial system parameters, which without telemetry services, is more often unobtainable.

Category By Component
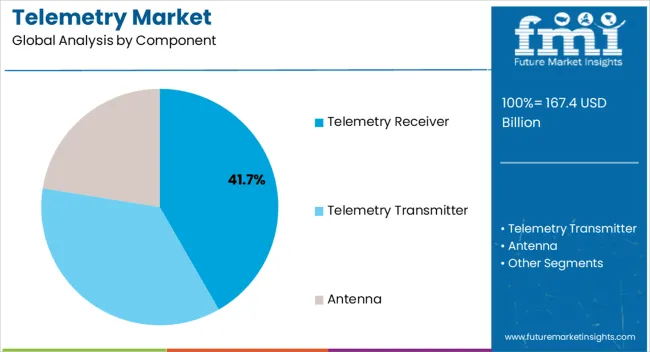
Top Segment Antenna
Market Share in Percentage 48.6%
Category By Sensors
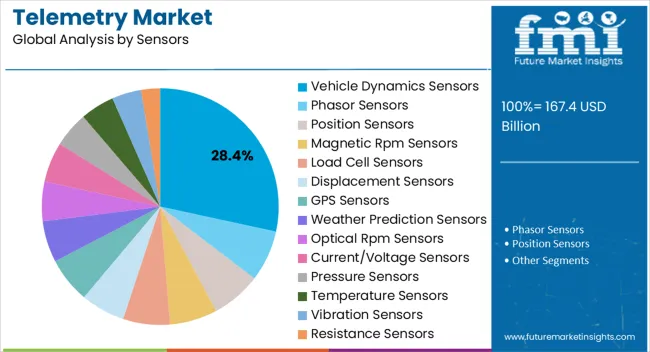
Top Segment Current or Voltage Sensors
Market Share in Percentage 6.9%

Market Trend Points toward the Adoption of Modern Technologies

The rising use of the Internet of Things (IoT) enhances the battery life for the miniaturization of hardware systems and connected devices. Moreover, telemetry uses IoT devices like low bandwidth, remote sensors, reduced power, local IoT intelligent gateways, and low-code footprint. Additionally, the conjunction of the Internet of Things (IoT) and artificial intelligence will reshape the future of industrial automation.

Artificial Intelligence of Things affects several industries, such as automotive, aerospace and defense, supply chain, healthcare, and manufacturing.

Regional Insights

Regional Market Comparison Global Market Share in Percentage
North America 26.1%
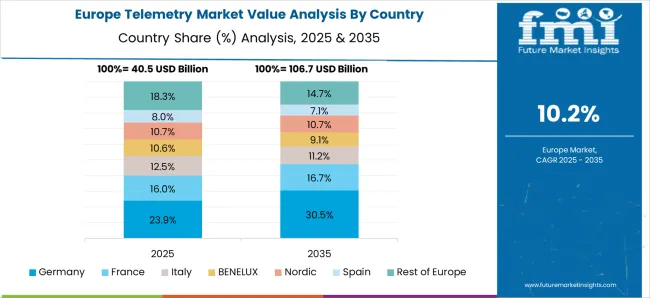
Europe 21.3%

North America is the Largest Market for Telemetry

North America holds a 35.1% market share in the global telemetry market. Such dominance is owing to increased drug use in this region. Also, increased demand for the connected car, smart mobility, and smart energy metersin Canada and the United States is anticipated to experience significant growth in North America’s market. Moreover, this region has a high prevalence of cardiovascular disorders. For example,

  • According to the Centre for Disease Control and Prevention analysis, in the United States, nearly 610,000 individuals die due to cardiac diseases each year.

Growing awareness amongs healthcare providers and patients about telemetry devices, as a result, is anticipated to assist in decreasing death because of heart attacks by rendering real-time monitoring. Consequently, this assists in boosting the growth of the telemetry market in this region.

Regional Market Comparison Global Market Share in Percentage
The United States 18.4%
Germany 9.3%
Japan 4.8%
Australia 3.5%

Europe & Asia Pacific Expected To Present a Promising Market for Telemetry

Europe is accountable for 23.2% market share in the global market owing to the constantly increasing demand for healthcare services in this region. Also, it has been predicted that Asia Pacific is estimated expand at a significant CAGR over the estimated timeframe.

Europe region has many wastewater treatment systems, increasing government funding for reservoir monitoring systems, and development of wireless telemetry in developing countries such as Japan, India, China, and others. These factors are likely to boost the growth of Asia Pacific’s telemetry market in the future. Moreover, the growth is also due to the big oil and gas industry and the developing automotive industry in the region.

Regional Market CAGR (2023 to 2033)
The United Kingdom 10.5%
China 9.8%
India 13.4%

What are The Start-ups Up To?

In May 2021, New Relic, Inc. announced a series of novel product inventions and community initiatives to assist engineers in making observability a data-driven approach. It is going help them plan, build, deploy and run the software.

The company launched its new Kubernetes experience, powered by Auto-Telemetry with Pixie, which incorporates New Relic One to render instant Kubernetes observability without requring users to update any sample data or code.
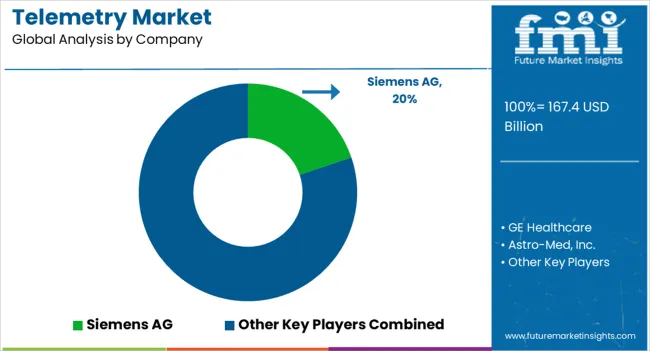
Who Are The Key Players In the Telemetry Market?

Some of the key players in the telemetry market are Siemens AG, GE Healthcare, Astro-Med, Inc., Rogers Communications, Inc., BayerischeMotorenWerke AG (BMW), Philips Healthcare, Lindsay Corporation, Schneider Electric, Verizon Communications, Inc., Kongsberg Gruppen, Honeywell International Inc., BioTelemetry, Inc., Schlumberger Ltd., L-3 Communications Holdings Inc., Sierra Wireless, Inc., Cobham Plc., IBM Corp, and Finmeccanica SPA.

  • In July 2022, at Farnborough Air Show, GE Digital announced that it had signed an MOU with Teradata and Microsoft to develop a solution designed to decrease carbon emissions. All three companies are expected to commence working together to develop an offering designed to assist aircraft operators with the tools they need to report, record, and decrease emissions.
  • Siemens AG and Skeleton Technologies have partnered to develop, plan, and implement a completely automated, digital manufacturing technology for producing super-capacitors in Germany.

Report Scope

Report Attribute Details
Growth Rate CAGR of 11.2% from 2023 to 2033
Base Year for Estimation 2022
Historical Data 2018 to 2022
Forecast Period 2023 to 2033
Quantitative Units Revenue in USD million or USD billion and CAGR from 2023 to 2033
Report Coverage Revenue Forecast, Volume Forecast, Company Ranking, Competitive Landscape, Growth Factors, Trends and Pricing Analysis
Segments Covered Component, Technology, Sensor, Application, Region
Regions Covered North America; Latin America; Europe; East Asia; South Asia; Oceania; The Middle East and Africa
Key Countries Profiled The United States, Canada, Brazil, Argentina, Germany, The United Kingdom, France, Spain, Italy, Nordics, BENELUX, Australia & New Zealand, China, India, Asia Pacific, GCC, South Africa
Key Companies Profiled Siemens AG; GE Healthcare; Astro-Med, Inc.; Rogers Communications, Inc.; BayerischeMotorenWerke AG (BMW); Philips Healthcare; Lindsay Corporation; Schneider Electric; Honeywell International Inc; BioTelemetry, Inc.; Schlumberger Ltd.; L-3 Communications Holdings Inc.; Sierra Wireless, Inc.; Cobham Plc.; IBM Corp.; Finmeccanica SPA.
Customization & Pricing

Available Upon Request

Key Segmentation

By Component:

  • Telemetry Receiver
  • Telemetry Transmitter
  • Antenna

By Technology:

  • Wire-Link Telemetry
  • Acoustic Telemetry
  • Microwave Telemetry
  • Wireless Telemetry Systems
  • Digital Telemetry
  • Data Loggers

By Sensors:

  • Vehicle Dynamics Sensors
  • Phasor Sensors
  • Position Sensors
  • Magnetic Rpm Sensors
  • Load Cell Sensors
  • Displacement Sensors
  • GPS Sensors
  • Weather Prediction Sensors
  • Optical Rpm Sensors
  • Current/Voltage Sensors
  • Pressure Sensors
  • Temperature Sensors
  • Vibration Sensors
  • Resistance Sensors
  • Other Sensors

By Application:

  • Healthcare
  • Energy and Power Utilities
  • Oil & Gas
  • Retail
  • Aerospace & Defense
  • Automotive
  • Automation
  • Manufacturing
  • Agriculture
  • Other Applications (Wildlife, Hydrography, Logistics, and Oceanography)

By Region:

  • North America Market
  • Latin America Market
  • East Asia Market
  • South Asia and Pacific Market
  • The Middle East & Africa (MEA) Market
  • Europe Market

Table of Content

  • 1. Executive Summary
  • 2. Market Overview
  • 3. Market Background
  • 4. Global Market Analysis 2018 to 2022 and Forecast, 2023 to 2033
  • 5. Global Market Analysis 2018 to 2022 and Forecast 2023 to 2033, By Component
    • 5.1. Receiver
    • 5.2. Transmitter
    • 5.3. Antenna
  • 6. Global Market Analysis 2018 to 2022 and Forecast 2023 to 2033, By Technology
    • 6.1. Wire-Link Telemetry
    • 6.2. Acoustic Telemetry
    • 6.3. Microwave Telemetry
    • 6.4. Wireless Systems
    • 6.5. Digital Telemetry
    • 6.6. Data Loggers
  • 7. Global Market Analysis 2018 to 2022 and Forecast 2023 to 2033, By Sensors
    • 7.1. Vehicle Dynamics Sensors
    • 7.2. Phasor Sensors
    • 7.3. Position Sensors
    • 7.4. Magnetic RPM Sensors
    • 7.5. Load Cell Sensors
    • 7.6. Displacement Sensors
    • 7.7. GPS Sensors
    • 7.8. Weather Prediction Sensors
    • 7.9. Optical RPM Sensors
    • 7.10. Current/Voltage Sensors
    • 7.11. Pressure Sensors
    • 7.12. Temperature Sensors
    • 7.13. Vibration Sensors
    • 7.14. Resistance Sensors
  • 8. Global Market Analysis 2018 to 2022 and Forecast 2023 to 2033, By Application
    • 8.1. Healthcare
    • 8.2. Energy and Power Utilities
    • 8.3. Oil & Gas
    • 8.4. Retail
    • 8.5. Aerospace & Defence
    • 8.6. Automotive
    • 8.7. Automation
    • 8.8. Manufacturing
    • 8.9. Agriculture
    • 8.10. Others (Wildlife, Hydrography, Logistics, and Oceanography)
  • 9. Global Market Analysis 2018 to 2022 and Forecast 2023 to 2033, By Region
    • 9.1. North America
    • 9.2. Latin America
    • 9.3. Western Europe
    • 9.4. Eastern Europe
    • 9.5. South Asia and Pacific
    • 9.6. East Asia
    • 9.7. Middle East and Africa
  • 10. North America Market Analysis 2018 to 2022 and Forecast 2023 to 2033, By Country
  • 11. Latin America Market Analysis 2018 to 2022 and Forecast 2023 to 2033, By Country
  • 12. Western Europe Market Analysis 2018 to 2022 and Forecast 2023 to 2033, By Country
  • 13. Eastern Europe Market Analysis 2018 to 2022 and Forecast 2023 to 2033, By Country
  • 14. South Asia and Pacific Market Analysis 2018 to 2022 and Forecast 2023 to 2033, By Country
  • 15. East Asia Market Analysis 2018 to 2022 and Forecast 2023 to 2033, By Country
  • 16. Middle East and Africa Market Analysis 2018 to 2022 and Forecast 2023 to 2033, By Country
  • 17. Key Countries Market Analysis
  • 18. Market Structure Analysis
  • 19. Competition Analysis
    • 19.1. Siemens AG
    • 19.2. GE Healthcare
    • 19.3. Astro-Med, Inc.
    • 19.4. Rogers Communications, Inc.
    • 19.5. Bayerische Motoren Werke AG (BMW)
    • 19.6. Philips Healthcare
    • 19.7. Lindsay Corporation
    • 19.8. Schneider Electric
    • 19.9. Verizon Communications, Inc
    • 19.10. Kongsberg Gruppen
    • 19.11. Honeywell International Inc
    • 19.12. BioTelemetry, Inc.
    • 19.13. Schlumberger Ltd.
    • 19.14. L-3 Communications Holdings Inc.
    • 19.15. Sierra Wireless, Inc.
    • 19.16. Cobham Plc.
    • 19.17. IBM Corp.
    • 19.18. Finmeccanica SPA.
  • 20. Assumptions & Acronyms Used
  • 21. Research Methodology

List of Tables

Table 1: Global Market Value (US$ Million) Forecast by Region, 2018 to 2033

Table 2: Global Market Volume (Units) Forecast by Region, 2018 to 2033

Table 3: Global Market Value (US$ Million) Forecast by Component, 2018 to 2033

Table 4: Global Market Volume (Units) Forecast by Component, 2018 to 2033

Table 5: Global Market Value (US$ Million) Forecast by Technology, 2018 to 2033

Table 6: Global Market Volume (Units) Forecast by Technology, 2018 to 2033

Table 7: Global Market Value (US$ Million) Forecast by Sensors, 2018 to 2033

Table 8: Global Market Volume (Units) Forecast by Sensors, 2018 to 2033

Table 9: Global Market Value (US$ Million) Forecast by Application, 2018 to 2033

Table 10: Global Market Volume (Units) Forecast by Application, 2018 to 2033

Table 11: North America Market Value (US$ Million) Forecast by Country, 2018 to 2033

Table 12: North America Market Volume (Units) Forecast by Country, 2018 to 2033

Table 13: North America Market Value (US$ Million) Forecast by Component, 2018 to 2033

Table 14: North America Market Volume (Units) Forecast by Component, 2018 to 2033

Table 15: North America Market Value (US$ Million) Forecast by Technology, 2018 to 2033

Table 16: North America Market Volume (Units) Forecast by Technology, 2018 to 2033

Table 17: North America Market Value (US$ Million) Forecast by Sensors, 2018 to 2033

Table 18: North America Market Volume (Units) Forecast by Sensors, 2018 to 2033

Table 19: North America Market Value (US$ Million) Forecast by Application, 2018 to 2033

Table 20: North America Market Volume (Units) Forecast by Application, 2018 to 2033

Table 21: Latin America Market Value (US$ Million) Forecast by Country, 2018 to 2033

Table 22: Latin America Market Volume (Units) Forecast by Country, 2018 to 2033

Table 23: Latin America Market Value (US$ Million) Forecast by Component, 2018 to 2033

Table 24: Latin America Market Volume (Units) Forecast by Component, 2018 to 2033

Table 25: Latin America Market Value (US$ Million) Forecast by Technology, 2018 to 2033

Table 26: Latin America Market Volume (Units) Forecast by Technology, 2018 to 2033

Table 27: Latin America Market Value (US$ Million) Forecast by Sensors, 2018 to 2033

Table 28: Latin America Market Volume (Units) Forecast by Sensors, 2018 to 2033

Table 29: Latin America Market Value (US$ Million) Forecast by Application, 2018 to 2033

Table 30: Latin America Market Volume (Units) Forecast by Application, 2018 to 2033

Table 31: Western Europe Market Value (US$ Million) Forecast by Country, 2018 to 2033

Table 32: Western Europe Market Volume (Units) Forecast by Country, 2018 to 2033

Table 33: Western Europe Market Value (US$ Million) Forecast by Component, 2018 to 2033

Table 34: Western Europe Market Volume (Units) Forecast by Component, 2018 to 2033

Table 35: Western Europe Market Value (US$ Million) Forecast by Technology, 2018 to 2033

Table 36: Western Europe Market Volume (Units) Forecast by Technology, 2018 to 2033

Table 37: Western Europe Market Value (US$ Million) Forecast by Sensors, 2018 to 2033

Table 38: Western Europe Market Volume (Units) Forecast by Sensors, 2018 to 2033

Table 39: Western Europe Market Value (US$ Million) Forecast by Application, 2018 to 2033

Table 40: Western Europe Market Volume (Units) Forecast by Application, 2018 to 2033

Table 41: Eastern Europe Market Value (US$ Million) Forecast by Country, 2018 to 2033

Table 42: Eastern Europe Market Volume (Units) Forecast by Country, 2018 to 2033

Table 43: Eastern Europe Market Value (US$ Million) Forecast by Component, 2018 to 2033

Table 44: Eastern Europe Market Volume (Units) Forecast by Component, 2018 to 2033

Table 45: Eastern Europe Market Value (US$ Million) Forecast by Technology, 2018 to 2033

Table 46: Eastern Europe Market Volume (Units) Forecast by Technology, 2018 to 2033

Table 47: Eastern Europe Market Value (US$ Million) Forecast by Sensors, 2018 to 2033

Table 48: Eastern Europe Market Volume (Units) Forecast by Sensors, 2018 to 2033

Table 49: Eastern Europe Market Value (US$ Million) Forecast by Application, 2018 to 2033

Table 50: Eastern Europe Market Volume (Units) Forecast by Application, 2018 to 2033

Table 51: South Asia and Pacific Market Value (US$ Million) Forecast by Country, 2018 to 2033

Table 52: South Asia and Pacific Market Volume (Units) Forecast by Country, 2018 to 2033

Table 53: South Asia and Pacific Market Value (US$ Million) Forecast by Component, 2018 to 2033

Table 54: South Asia and Pacific Market Volume (Units) Forecast by Component, 2018 to 2033

Table 55: South Asia and Pacific Market Value (US$ Million) Forecast by Technology, 2018 to 2033

Table 56: South Asia and Pacific Market Volume (Units) Forecast by Technology, 2018 to 2033

Table 57: South Asia and Pacific Market Value (US$ Million) Forecast by Sensors, 2018 to 2033

Table 58: South Asia and Pacific Market Volume (Units) Forecast by Sensors, 2018 to 2033

Table 59: South Asia and Pacific Market Value (US$ Million) Forecast by Application, 2018 to 2033

Table 60: South Asia and Pacific Market Volume (Units) Forecast by Application, 2018 to 2033

Table 61: East Asia Market Value (US$ Million) Forecast by Country, 2018 to 2033

Table 62: East Asia Market Volume (Units) Forecast by Country, 2018 to 2033

Table 63: East Asia Market Value (US$ Million) Forecast by Component, 2018 to 2033

Table 64: East Asia Market Volume (Units) Forecast by Component, 2018 to 2033

Table 65: East Asia Market Value (US$ Million) Forecast by Technology, 2018 to 2033

Table 66: East Asia Market Volume (Units) Forecast by Technology, 2018 to 2033

Table 67: East Asia Market Value (US$ Million) Forecast by Sensors, 2018 to 2033

Table 68: East Asia Market Volume (Units) Forecast by Sensors, 2018 to 2033

Table 69: East Asia Market Value (US$ Million) Forecast by Application, 2018 to 2033

Table 70: East Asia Market Volume (Units) Forecast by Application, 2018 to 2033

Table 71: Middle East and Africa Market Value (US$ Million) Forecast by Country, 2018 to 2033

Table 72: Middle East and Africa Market Volume (Units) Forecast by Country, 2018 to 2033

Table 73: Middle East and Africa Market Value (US$ Million) Forecast by Component, 2018 to 2033

Table 74: Middle East and Africa Market Volume (Units) Forecast by Component, 2018 to 2033

Table 75: Middle East and Africa Market Value (US$ Million) Forecast by Technology, 2018 to 2033

Table 76: Middle East and Africa Market Volume (Units) Forecast by Technology, 2018 to 2033

Table 77: Middle East and Africa Market Value (US$ Million) Forecast by Sensors, 2018 to 2033

Table 78: Middle East and Africa Market Volume (Units) Forecast by Sensors, 2018 to 2033

Table 79: Middle East and Africa Market Value (US$ Million) Forecast by Application, 2018 to 2033

Table 80: Middle East and Africa Market Volume (Units) Forecast by Application, 2018 to 2033

List of Figures

Figure 1: Global Market Value (US$ Million) by Component, 2023 to 2033

Figure 2: Global Market Value (US$ Million) by Technology, 2023 to 2033

Figure 3: Global Market Value (US$ Million) by Sensors, 2023 to 2033

Figure 4: Global Market Value (US$ Million) by Application, 2023 to 2033

Figure 5: Global Market Value (US$ Million) by Region, 2023 to 2033

Figure 6: Global Market Value (US$ Million) Analysis by Region, 2018 to 2033

Figure 7: Global Market Volume (Units) Analysis by Region, 2018 to 2033

Figure 8: Global Market Value Share (%) and BPS Analysis by Region, 2023 to 2033

Figure 9: Global Market Y-o-Y Growth (%) Projections by Region, 2023 to 2033

Figure 10: Global Market Value (US$ Million) Analysis by Component, 2018 to 2033

Figure 11: Global Market Volume (Units) Analysis by Component, 2018 to 2033

Figure 12: Global Market Value Share (%) and BPS Analysis by Component, 2023 to 2033

Figure 13: Global Market Y-o-Y Growth (%) Projections by Component, 2023 to 2033

Figure 14: Global Market Value (US$ Million) Analysis by Technology, 2018 to 2033

Figure 15: Global Market Volume (Units) Analysis by Technology, 2018 to 2033

Figure 16: Global Market Value Share (%) and BPS Analysis by Technology, 2023 to 2033

Figure 17: Global Market Y-o-Y Growth (%) Projections by Technology, 2023 to 2033

Figure 18: Global Market Value (US$ Million) Analysis by Sensors, 2018 to 2033

Figure 19: Global Market Volume (Units) Analysis by Sensors, 2018 to 2033

Figure 20: Global Market Value Share (%) and BPS Analysis by Sensors, 2023 to 2033

Figure 21: Global Market Y-o-Y Growth (%) Projections by Sensors, 2023 to 2033

Figure 22: Global Market Value (US$ Million) Analysis by Application, 2018 to 2033

Figure 23: Global Market Volume (Units) Analysis by Application, 2018 to 2033

Figure 24: Global Market Value Share (%) and BPS Analysis by Application, 2023 to 2033

Figure 25: Global Market Y-o-Y Growth (%) Projections by Application, 2023 to 2033

Figure 26: Global Market Attractiveness by Component, 2023 to 2033

Figure 27: Global Market Attractiveness by Technology, 2023 to 2033

Figure 28: Global Market Attractiveness by Sensors, 2023 to 2033

Figure 29: Global Market Attractiveness by Application, 2023 to 2033

Figure 30: Global Market Attractiveness by Region, 2023 to 2033

Figure 31: North America Market Value (US$ Million) by Component, 2023 to 2033

Figure 32: North America Market Value (US$ Million) by Technology, 2023 to 2033

Figure 33: North America Market Value (US$ Million) by Sensors, 2023 to 2033

Figure 34: North America Market Value (US$ Million) by Application, 2023 to 2033

Figure 35: North America Market Value (US$ Million) by Country, 2023 to 2033

Figure 36: North America Market Value (US$ Million) Analysis by Country, 2018 to 2033

Figure 37: North America Market Volume (Units) Analysis by Country, 2018 to 2033

Figure 38: North America Market Value Share (%) and BPS Analysis by Country, 2023 to 2033

Figure 39: North America Market Y-o-Y Growth (%) Projections by Country, 2023 to 2033

Figure 40: North America Market Value (US$ Million) Analysis by Component, 2018 to 2033

Figure 41: North America Market Volume (Units) Analysis by Component, 2018 to 2033

Figure 42: North America Market Value Share (%) and BPS Analysis by Component, 2023 to 2033

Figure 43: North America Market Y-o-Y Growth (%) Projections by Component, 2023 to 2033

Figure 44: North America Market Value (US$ Million) Analysis by Technology, 2018 to 2033

Figure 45: North America Market Volume (Units) Analysis by Technology, 2018 to 2033

Figure 46: North America Market Value Share (%) and BPS Analysis by Technology, 2023 to 2033

Figure 47: North America Market Y-o-Y Growth (%) Projections by Technology, 2023 to 2033

Figure 48: North America Market Value (US$ Million) Analysis by Sensors, 2018 to 2033

Figure 49: North America Market Volume (Units) Analysis by Sensors, 2018 to 2033

Figure 50: North America Market Value Share (%) and BPS Analysis by Sensors, 2023 to 2033

Figure 51: North America Market Y-o-Y Growth (%) Projections by Sensors, 2023 to 2033

Figure 52: North America Market Value (US$ Million) Analysis by Application, 2018 to 2033

Figure 53: North America Market Volume (Units) Analysis by Application, 2018 to 2033

Figure 54: North America Market Value Share (%) and BPS Analysis by Application, 2023 to 2033

Figure 55: North America Market Y-o-Y Growth (%) Projections by Application, 2023 to 2033

Figure 56: North America Market Attractiveness by Component, 2023 to 2033

Figure 57: North America Market Attractiveness by Technology, 2023 to 2033

Figure 58: North America Market Attractiveness by Sensors, 2023 to 2033

Figure 59: North America Market Attractiveness by Application, 2023 to 2033

Figure 60: North America Market Attractiveness by Country, 2023 to 2033

Figure 61: Latin America Market Value (US$ Million) by Component, 2023 to 2033

Figure 62: Latin America Market Value (US$ Million) by Technology, 2023 to 2033

Figure 63: Latin America Market Value (US$ Million) by Sensors, 2023 to 2033

Figure 64: Latin America Market Value (US$ Million) by Application, 2023 to 2033

Figure 65: Latin America Market Value (US$ Million) by Country, 2023 to 2033

Figure 66: Latin America Market Value (US$ Million) Analysis by Country, 2018 to 2033

Figure 67: Latin America Market Volume (Units) Analysis by Country, 2018 to 2033

Figure 68: Latin America Market Value Share (%) and BPS Analysis by Country, 2023 to 2033

Figure 69: Latin America Market Y-o-Y Growth (%) Projections by Country, 2023 to 2033

Figure 70: Latin America Market Value (US$ Million) Analysis by Component, 2018 to 2033

Figure 71: Latin America Market Volume (Units) Analysis by Component, 2018 to 2033

Figure 72: Latin America Market Value Share (%) and BPS Analysis by Component, 2023 to 2033

Figure 73: Latin America Market Y-o-Y Growth (%) Projections by Component, 2023 to 2033

Figure 74: Latin America Market Value (US$ Million) Analysis by Technology, 2018 to 2033

Figure 75: Latin America Market Volume (Units) Analysis by Technology, 2018 to 2033

Figure 76: Latin America Market Value Share (%) and BPS Analysis by Technology, 2023 to 2033

Figure 77: Latin America Market Y-o-Y Growth (%) Projections by Technology, 2023 to 2033

Figure 78: Latin America Market Value (US$ Million) Analysis by Sensors, 2018 to 2033

Figure 79: Latin America Market Volume (Units) Analysis by Sensors, 2018 to 2033

Figure 80: Latin America Market Value Share (%) and BPS Analysis by Sensors, 2023 to 2033

Figure 81: Latin America Market Y-o-Y Growth (%) Projections by Sensors, 2023 to 2033

Figure 82: Latin America Market Value (US$ Million) Analysis by Application, 2018 to 2033

Figure 83: Latin America Market Volume (Units) Analysis by Application, 2018 to 2033

Figure 84: Latin America Market Value Share (%) and BPS Analysis by Application, 2023 to 2033

Figure 85: Latin America Market Y-o-Y Growth (%) Projections by Application, 2023 to 2033

Figure 86: Latin America Market Attractiveness by Component, 2023 to 2033

Figure 87: Latin America Market Attractiveness by Technology, 2023 to 2033

Figure 88: Latin America Market Attractiveness by Sensors, 2023 to 2033

Figure 89: Latin America Market Attractiveness by Application, 2023 to 2033

Figure 90: Latin America Market Attractiveness by Country, 2023 to 2033

Figure 91: Western Europe Market Value (US$ Million) by Component, 2023 to 2033

Figure 92: Western Europe Market Value (US$ Million) by Technology, 2023 to 2033

Figure 93: Western Europe Market Value (US$ Million) by Sensors, 2023 to 2033

Figure 94: Western Europe Market Value (US$ Million) by Application, 2023 to 2033

Figure 95: Western Europe Market Value (US$ Million) by Country, 2023 to 2033

Figure 96: Western Europe Market Value (US$ Million) Analysis by Country, 2018 to 2033

Figure 97: Western Europe Market Volume (Units) Analysis by Country, 2018 to 2033

Figure 98: Western Europe Market Value Share (%) and BPS Analysis by Country, 2023 to 2033

Figure 99: Western Europe Market Y-o-Y Growth (%) Projections by Country, 2023 to 2033

Figure 100: Western Europe Market Value (US$ Million) Analysis by Component, 2018 to 2033

Figure 101: Western Europe Market Volume (Units) Analysis by Component, 2018 to 2033

Figure 102: Western Europe Market Value Share (%) and BPS Analysis by Component, 2023 to 2033

Figure 103: Western Europe Market Y-o-Y Growth (%) Projections by Component, 2023 to 2033

Figure 104: Western Europe Market Value (US$ Million) Analysis by Technology, 2018 to 2033

Figure 105: Western Europe Market Volume (Units) Analysis by Technology, 2018 to 2033

Figure 106: Western Europe Market Value Share (%) and BPS Analysis by Technology, 2023 to 2033

Figure 107: Western Europe Market Y-o-Y Growth (%) Projections by Technology, 2023 to 2033

Figure 108: Western Europe Market Value (US$ Million) Analysis by Sensors, 2018 to 2033

Figure 109: Western Europe Market Volume (Units) Analysis by Sensors, 2018 to 2033

Figure 110: Western Europe Market Value Share (%) and BPS Analysis by Sensors, 2023 to 2033

Figure 111: Western Europe Market Y-o-Y Growth (%) Projections by Sensors, 2023 to 2033

Figure 112: Western Europe Market Value (US$ Million) Analysis by Application, 2018 to 2033

Figure 113: Western Europe Market Volume (Units) Analysis by Application, 2018 to 2033

Figure 114: Western Europe Market Value Share (%) and BPS Analysis by Application, 2023 to 2033

Figure 115: Western Europe Market Y-o-Y Growth (%) Projections by Application, 2023 to 2033

Figure 116: Western Europe Market Attractiveness by Component, 2023 to 2033

Figure 117: Western Europe Market Attractiveness by Technology, 2023 to 2033

Figure 118: Western Europe Market Attractiveness by Sensors, 2023 to 2033

Figure 119: Western Europe Market Attractiveness by Application, 2023 to 2033

Figure 120: Western Europe Market Attractiveness by Country, 2023 to 2033

Figure 121: Eastern Europe Market Value (US$ Million) by Component, 2023 to 2033

Figure 122: Eastern Europe Market Value (US$ Million) by Technology, 2023 to 2033

Figure 123: Eastern Europe Market Value (US$ Million) by Sensors, 2023 to 2033

Figure 124: Eastern Europe Market Value (US$ Million) by Application, 2023 to 2033

Figure 125: Eastern Europe Market Value (US$ Million) by Country, 2023 to 2033

Figure 126: Eastern Europe Market Value (US$ Million) Analysis by Country, 2018 to 2033

Figure 127: Eastern Europe Market Volume (Units) Analysis by Country, 2018 to 2033

Figure 128: Eastern Europe Market Value Share (%) and BPS Analysis by Country, 2023 to 2033

Figure 129: Eastern Europe Market Y-o-Y Growth (%) Projections by Country, 2023 to 2033

Figure 130: Eastern Europe Market Value (US$ Million) Analysis by Component, 2018 to 2033

Figure 131: Eastern Europe Market Volume (Units) Analysis by Component, 2018 to 2033

Figure 132: Eastern Europe Market Value Share (%) and BPS Analysis by Component, 2023 to 2033

Figure 133: Eastern Europe Market Y-o-Y Growth (%) Projections by Component, 2023 to 2033

Figure 134: Eastern Europe Market Value (US$ Million) Analysis by Technology, 2018 to 2033

Figure 135: Eastern Europe Market Volume (Units) Analysis by Technology, 2018 to 2033

Figure 136: Eastern Europe Market Value Share (%) and BPS Analysis by Technology, 2023 to 2033

Figure 137: Eastern Europe Market Y-o-Y Growth (%) Projections by Technology, 2023 to 2033

Figure 138: Eastern Europe Market Value (US$ Million) Analysis by Sensors, 2018 to 2033

Figure 139: Eastern Europe Market Volume (Units) Analysis by Sensors, 2018 to 2033

Figure 140: Eastern Europe Market Value Share (%) and BPS Analysis by Sensors, 2023 to 2033

Figure 141: Eastern Europe Market Y-o-Y Growth (%) Projections by Sensors, 2023 to 2033

Figure 142: Eastern Europe Market Value (US$ Million) Analysis by Application, 2018 to 2033

Figure 143: Eastern Europe Market Volume (Units) Analysis by Application, 2018 to 2033

Figure 144: Eastern Europe Market Value Share (%) and BPS Analysis by Application, 2023 to 2033

Figure 145: Eastern Europe Market Y-o-Y Growth (%) Projections by Application, 2023 to 2033

Figure 146: Eastern Europe Market Attractiveness by Component, 2023 to 2033

Figure 147: Eastern Europe Market Attractiveness by Technology, 2023 to 2033

Figure 148: Eastern Europe Market Attractiveness by Sensors, 2023 to 2033

Figure 149: Eastern Europe Market Attractiveness by Application, 2023 to 2033

Figure 150: Eastern Europe Market Attractiveness by Country, 2023 to 2033

Figure 151: South Asia and Pacific Market Value (US$ Million) by Component, 2023 to 2033

Figure 152: South Asia and Pacific Market Value (US$ Million) by Technology, 2023 to 2033

Figure 153: South Asia and Pacific Market Value (US$ Million) by Sensors, 2023 to 2033

Figure 154: South Asia and Pacific Market Value (US$ Million) by Application, 2023 to 2033

Figure 155: South Asia and Pacific Market Value (US$ Million) by Country, 2023 to 2033

Figure 156: South Asia and Pacific Market Value (US$ Million) Analysis by Country, 2018 to 2033

Figure 157: South Asia and Pacific Market Volume (Units) Analysis by Country, 2018 to 2033

Figure 158: South Asia and Pacific Market Value Share (%) and BPS Analysis by Country, 2023 to 2033

Figure 159: South Asia and Pacific Market Y-o-Y Growth (%) Projections by Country, 2023 to 2033

Figure 160: South Asia and Pacific Market Value (US$ Million) Analysis by Component, 2018 to 2033

Figure 161: South Asia and Pacific Market Volume (Units) Analysis by Component, 2018 to 2033

Figure 162: South Asia and Pacific Market Value Share (%) and BPS Analysis by Component, 2023 to 2033

Figure 163: South Asia and Pacific Market Y-o-Y Growth (%) Projections by Component, 2023 to 2033

Figure 164: South Asia and Pacific Market Value (US$ Million) Analysis by Technology, 2018 to 2033

Figure 165: South Asia and Pacific Market Volume (Units) Analysis by Technology, 2018 to 2033

Figure 166: South Asia and Pacific Market Value Share (%) and BPS Analysis by Technology, 2023 to 2033

Figure 167: South Asia and Pacific Market Y-o-Y Growth (%) Projections by Technology, 2023 to 2033

Figure 168: South Asia and Pacific Market Value (US$ Million) Analysis by Sensors, 2018 to 2033

Figure 169: South Asia and Pacific Market Volume (Units) Analysis by Sensors, 2018 to 2033

Figure 170: South Asia and Pacific Market Value Share (%) and BPS Analysis by Sensors, 2023 to 2033

Figure 171: South Asia and Pacific Market Y-o-Y Growth (%) Projections by Sensors, 2023 to 2033

Figure 172: South Asia and Pacific Market Value (US$ Million) Analysis by Application, 2018 to 2033

Figure 173: South Asia and Pacific Market Volume (Units) Analysis by Application, 2018 to 2033

Figure 174: South Asia and Pacific Market Value Share (%) and BPS Analysis by Application, 2023 to 2033

Figure 175: South Asia and Pacific Market Y-o-Y Growth (%) Projections by Application, 2023 to 2033

Figure 176: South Asia and Pacific Market Attractiveness by Component, 2023 to 2033

Figure 177: South Asia and Pacific Market Attractiveness by Technology, 2023 to 2033

Figure 178: South Asia and Pacific Market Attractiveness by Sensors, 2023 to 2033

Figure 179: South Asia and Pacific Market Attractiveness by Application, 2023 to 2033

Figure 180: South Asia and Pacific Market Attractiveness by Country, 2023 to 2033

Figure 181: East Asia Market Value (US$ Million) by Component, 2023 to 2033

Figure 182: East Asia Market Value (US$ Million) by Technology, 2023 to 2033

Figure 183: East Asia Market Value (US$ Million) by Sensors, 2023 to 2033

Figure 184: East Asia Market Value (US$ Million) by Application, 2023 to 2033

Figure 185: East Asia Market Value (US$ Million) by Country, 2023 to 2033

Figure 186: East Asia Market Value (US$ Million) Analysis by Country, 2018 to 2033

Figure 187: East Asia Market Volume (Units) Analysis by Country, 2018 to 2033

Figure 188: East Asia Market Value Share (%) and BPS Analysis by Country, 2023 to 2033

Figure 189: East Asia Market Y-o-Y Growth (%) Projections by Country, 2023 to 2033

Figure 190: East Asia Market Value (US$ Million) Analysis by Component, 2018 to 2033

Figure 191: East Asia Market Volume (Units) Analysis by Component, 2018 to 2033

Figure 192: East Asia Market Value Share (%) and BPS Analysis by Component, 2023 to 2033

Figure 193: East Asia Market Y-o-Y Growth (%) Projections by Component, 2023 to 2033

Figure 194: East Asia Market Value (US$ Million) Analysis by Technology, 2018 to 2033

Figure 195: East Asia Market Volume (Units) Analysis by Technology, 2018 to 2033

Figure 196: East Asia Market Value Share (%) and BPS Analysis by Technology, 2023 to 2033

Figure 197: East Asia Market Y-o-Y Growth (%) Projections by Technology, 2023 to 2033

Figure 198: East Asia Market Value (US$ Million) Analysis by Sensors, 2018 to 2033

Figure 199: East Asia Market Volume (Units) Analysis by Sensors, 2018 to 2033

Figure 200: East Asia Market Value Share (%) and BPS Analysis by Sensors, 2023 to 2033

Figure 201: East Asia Market Y-o-Y Growth (%) Projections by Sensors, 2023 to 2033

Figure 202: East Asia Market Value (US$ Million) Analysis by Application, 2018 to 2033

Figure 203: East Asia Market Volume (Units) Analysis by Application, 2018 to 2033

Figure 204: East Asia Market Value Share (%) and BPS Analysis by Application, 2023 to 2033

Figure 205: East Asia Market Y-o-Y Growth (%) Projections by Application, 2023 to 2033

Figure 206: East Asia Market Attractiveness by Component, 2023 to 2033

Figure 207: East Asia Market Attractiveness by Technology, 2023 to 2033

Figure 208: East Asia Market Attractiveness by Sensors, 2023 to 2033

Figure 209: East Asia Market Attractiveness by Application, 2023 to 2033

Figure 210: East Asia Market Attractiveness by Country, 2023 to 2033

Figure 211: Middle East and Africa Market Value (US$ Million) by Component, 2023 to 2033

Figure 212: Middle East and Africa Market Value (US$ Million) by Technology, 2023 to 2033

Figure 213: Middle East and Africa Market Value (US$ Million) by Sensors, 2023 to 2033

Figure 214: Middle East and Africa Market Value (US$ Million) by Application, 2023 to 2033

Figure 215: Middle East and Africa Market Value (US$ Million) by Country, 2023 to 2033

Figure 216: Middle East and Africa Market Value (US$ Million) Analysis by Country, 2018 to 2033

Figure 217: Middle East and Africa Market Volume (Units) Analysis by Country, 2018 to 2033

Figure 218: Middle East and Africa Market Value Share (%) and BPS Analysis by Country, 2023 to 2033

Figure 219: Middle East and Africa Market Y-o-Y Growth (%) Projections by Country, 2023 to 2033

Figure 220: Middle East and Africa Market Value (US$ Million) Analysis by Component, 2018 to 2033

Figure 221: Middle East and Africa Market Volume (Units) Analysis by Component, 2018 to 2033

Figure 222: Middle East and Africa Market Value Share (%) and BPS Analysis by Component, 2023 to 2033

Figure 223: Middle East and Africa Market Y-o-Y Growth (%) Projections by Component, 2023 to 2033

Figure 224: Middle East and Africa Market Value (US$ Million) Analysis by Technology, 2018 to 2033

Figure 225: Middle East and Africa Market Volume (Units) Analysis by Technology, 2018 to 2033

Figure 226: Middle East and Africa Market Value Share (%) and BPS Analysis by Technology, 2023 to 2033

Figure 227: Middle East and Africa Market Y-o-Y Growth (%) Projections by Technology, 2023 to 2033

Figure 228: Middle East and Africa Market Value (US$ Million) Analysis by Sensors, 2018 to 2033

Figure 229: Middle East and Africa Market Volume (Units) Analysis by Sensors, 2018 to 2033

Figure 230: Middle East and Africa Market Value Share (%) and BPS Analysis by Sensors, 2023 to 2033

Figure 231: Middle East and Africa Market Y-o-Y Growth (%) Projections by Sensors, 2023 to 2033

Figure 232: Middle East and Africa Market Value (US$ Million) Analysis by Application, 2018 to 2033

Figure 233: Middle East and Africa Market Volume (Units) Analysis by Application, 2018 to 2033

Figure 234: Middle East and Africa Market Value Share (%) and BPS Analysis by Application, 2023 to 2033

Figure 235: Middle East and Africa Market Y-o-Y Growth (%) Projections by Application, 2023 to 2033

Figure 236: Middle East and Africa Market Attractiveness by Component, 2023 to 2033

Figure 237: Middle East and Africa Market Attractiveness by Technology, 2023 to 2033

Figure 238: Middle East and Africa Market Attractiveness by Sensors, 2023 to 2033

Figure 239: Middle East and Africa Market Attractiveness by Application, 2023 to 2033

Figure 240: Middle East and Africa Market Attractiveness by Country, 2023 to 2033


Frequently Asked Questions

What is North America's expected share in 2023 of Telemetry Market?

North America is anticipated to account for 36% of the telemetry market in 2023.

Which form/product type is in higher demand of Telemetry Market?

Demand for real-time telemetry is greater than that for historical telemetry.

Which Country is Set to Register Exponential Growth in Telemetry Market?

The telemetry market in China is expected to increase at an exponential rate.

What Drives Sales of Telemetry Market?

The increased use of connected devices, remote monitoring, and data analytics is driving the market for telemetry sales.

What Key Trends are Driving the Telemetry Market?

The growing use of connected devices, remote monitoring, data analytics, patient safety, and cost savings are driving the telemetry market.

Explore Similar Insights

Future Market Insights

Telemetry Market