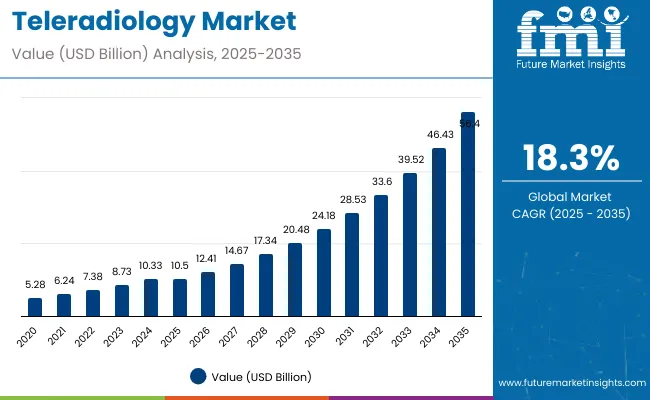
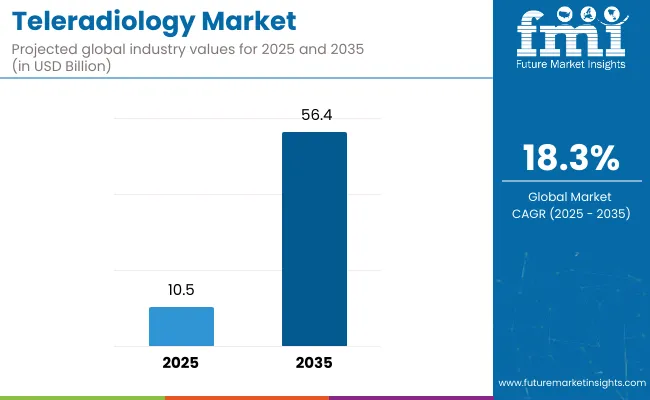
The teleradiology market is estimated to be valued at USD 10.5 billion in 2025. It is projected to reach USD 56.4 billion by 2035, registering a compound annual growth rate (CAGR) of 18.3% over the forecast period. The market is projected to add an absolute dollar opportunity of USD 45.9 billion over the forecast period.
| Metric | Value |
|---|---|
| Estimated Size (2025E) | USD 10.5 billion |
| Projected Value (2035F) | USD 56.4 billion |
| CAGR (2025 to 2035) | 18.3% |
This reflects a 5.4 times growth at a compound annual growth rate of 18.3%. The market's evolution is expected to be shaped by the rising demand for diagnostic imaging due to aging populations, global shortage of radiologists, technological advancements in imaging and telecommunication, and increasing adoption of telemedicine practices, particularly where remote healthcare access and specialist consultation are prioritized.
By 2030, the market is likely to reach USD 24.6 billion, accounting for USD 13.9 billion in incremental value over the first half of the decade. The remaining USD 31.3 billion is expected to be realized during the second half, suggesting an accelerated growth pattern. Product innovation in cloud-based teleradiology platforms, AI integration, and secure image transmission technologies are gaining traction.
Companies such as Siemens Healthineers, GE Healthcare, and Koninklijke Philips N.V. are advancing their competitive positions through investment in AI-powered diagnostic tools, cloud infrastructure development, and strategic partnerships with healthcare providers. Rising chronic disease prevalence, technological advancement in medical imaging, and improved telecommunication infrastructure are supporting expansion into emergency care, rural healthcare, and specialized diagnostic services. Market performance will remain anchored in data security standards, regulatory compliance, and diagnostic accuracy benchmarks.
The market holds a significant share across its parent markets. Within the global telemedicine market, it accounts for 18.5% due to its critical role in remote diagnostic imaging. In the medical imaging segment, it commands a 15.2% share, supported by increasing demand for remote interpretation services. It contributes nearly 22.3% to the radiology services market and 12.7% to the digital health segment. In cloud-based healthcare solutions, teleradiology holds around 14.6% share, driven by secure image transmission requirements. Across the emergency healthcare services market, its share is close to 16.8%, owing to its position as a key component in urgent diagnostic care.
The market is undergoing a strategic transformation driven by rising demand for remote diagnostic services, AI-powered image analysis technologies, and the integration of cloud-based platforms. Advanced teleradiology solutions using artificial intelligence, machine learning algorithms, and secure cloud infrastructure have enhanced diagnostic accuracy, reduced interpretation time, and improved workflow efficiency, making modern teleradiology platforms essential alternatives to traditional on-site radiology service models.
Manufacturers are introducing specialized platforms, including emergency care applications and subspecialty imaging solutions tailored for different medical conditions. Strategic collaborations between teleradiology providers and healthcare systems have accelerated innovation in AI-assisted diagnosis and market penetration.
The teleradiology market's robust growth is driven by increasing global shortage of radiologists, rising demand for emergency diagnostic services, and growing adoption of telemedicine practices, making them an essential solution for healthcare providers seeking accessible and timely diagnostic imaging interpretation. The expanding need for 24/7 radiology coverage in hospitals, improved access to specialized expertise in rural areas, and cost-effective diagnostic solutions appeal to healthcare systems prioritizing patient care efficiency and resource optimization.
A growing focus on healthcare digitalization, cloud-based infrastructure adoption, and AI-powered diagnostic tools is further propelling adoption, particularly in emergency care, rural healthcare delivery, and subspecialty imaging services. Rising chronic disease prevalence, technological advancements in medical imaging, and improved telecommunications infrastructure are also enhancing diagnostic capabilities and market penetration.
As artificial intelligence and machine learning technologies accelerate across medical imaging and diagnostic applications, the market outlook remains highly favorable. With healthcare providers prioritizing diagnostic accuracy, cost efficiency, and remote accessibility, teleradiology services are well-positioned to expand across various hospital systems, imaging centers, and emergency care facilities.
The market is segmented by modality, organ, and region. By modality, the market is categorized into X-ray scans, CT scans, MRI scans, ultrasound scans, nuclear scans, cardiac echo, mammography, and electromyography. Based on organ, the market is classified into brain, lung, heart, liver, bones, pancreas, spleen, and others. Regionally, the market is divided into North America, Europe, Asia-Pacific, Latin America, and the Middle East & Africa.
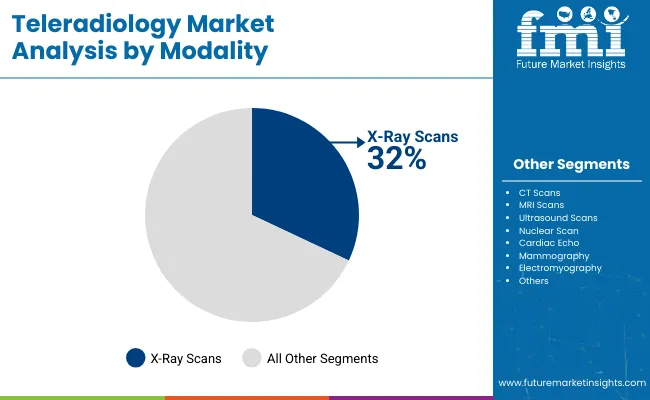
The X-ray scans segment is projected to hold a dominant position with 32% of the market share in the modality category, owing to its widespread use in healthcare facilities, cost-effectiveness, and fundamental role in primary diagnosis across diverse medical conditions. X-ray imaging is the most commonly performed diagnostic procedure globally, used extensively for diagnosing bone fractures, chest infections, tumors, and various other conditions, making it a significant contributor to teleradiology volume.
X-Ray scans enable healthcare providers and radiologists to achieve rapid diagnosis while maintaining excellent image quality and transmission efficiency in remote interpretation scenarios. As demand for accessible, cost-effective diagnostic imaging grows, the X-Ray scans segment continues to maintain preference in teleradiology applications.
Manufacturers are investing in advanced digital X-Ray technologies, improved image compression algorithms, and enhanced transmission protocols to maintain market leadership, broaden application scope, and improve diagnostic accuracy. The segment is positioned to remain dominant as global healthcare markets prioritize proven imaging technology and efficient diagnostic workflows.
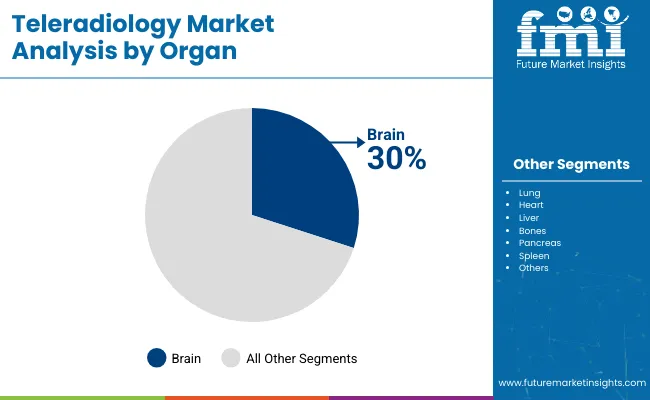
Brain imaging is projected to remain the core organ segment with 30% of the market share in 2025, as it represents the most critical application requiring specialized expertise and urgent interpretation in neurological emergencies, stroke cases, and traumatic brain injuries. The segment's dominance is driven by the complexity of neurological conditions, high-value imaging studies, and the critical need for immediate specialist consultation in brain-related cases.
Brain imaging applications also benefit from technological advancements in AI-powered analysis, automated detection algorithms, and specialized neuroimaging platforms, making teleradiology essential for timely and accurate neurological diagnosis. This makes brain imaging indispensable in emergency care and specialized neurological services.
Ongoing prevalence of neurological disorders and the growing emphasis on rapid stroke diagnosis and treatment are key trends driving the sustained relevance of brain imaging applications in the teleradiology market.
In 2024, global teleradiology adoption grew by 17.5% year-on-year, with North America taking a 35% share. Applications include emergency radiology, rural healthcare, and subspecialty consultations. Providers are introducing AI-powered diagnostic tools and cloud-based platforms that deliver superior accuracy profiles and workflow optimization.
Cloud-based solutions now support real-time collaboration. Regulatory frameworks and data security initiatives support healthcare providers’ confidence. Technology vendors increasingly supply ready-to-deploy teleradiology systems with integrated AI capabilities to reduce implementation complexity.
AI Integration Accelerates Teleradiology Market Demand
Healthcare providers and imaging centers are choosing AI-powered teleradiology solutions to achieve superior diagnostic accuracy, enhance workflow efficiency, and meet growing demands for rapid, reliable remote interpretation services. In clinical applications, AI-assisted platforms deliver up to 25% improvement in diagnostic speed compared to traditional interpretation methods. Solutions equipped with machine learning algorithms maintain consistent accuracy throughout varying case complexity and imaging modalities. In emergency settings, integrated AI systems help reduce diagnosis time while maintaining quality standards by up to 30%.
AI applications are now being deployed for subspecialty imaging and critical care segments, driving adoption in sectors that demand precise diagnostic interpretation. These advantages help explain why AI-enhanced teleradiology adoption rates rose 22% in 2024 across developed healthcare markets.
Cost Constraints, Regulatory Complexity and Infrastructure Requirements Limit Growth
Market expansion is constrained by high implementation costs, complex regulatory requirements, and specialized infrastructure needs. AI-powered teleradiology systems can cost 50-70% more than basic platforms, depending on AI capabilities and integration requirements, impacting adoption in resource-constrained healthcare settings. Regulatory compliance across different jurisdictions requires extensive validation processes, which can add 3-6 months to deployment timelines.
Data security and HIPAA compliance requirements extend implementation costs by 30-40% compared to conventional imaging systems. Limited availability of trained radiologists for subspecialty interpretation restricts scalable deployment, especially in emerging markets. These constraints make comprehensive teleradiology adoption challenging in cost-sensitive healthcare environments despite growing clinical advantages and efficiency drivers.
| Country | CAGR (2025 to 2035) |
|---|---|
| China | 22.1% |
| Brazil | 20.5% |
| Global Average | 18.3% |
| France | 17.8% |
| UK | 17.2% |
| Japan | 16.9% |
| USA | 15.8% |
| Germany | 15.4% |
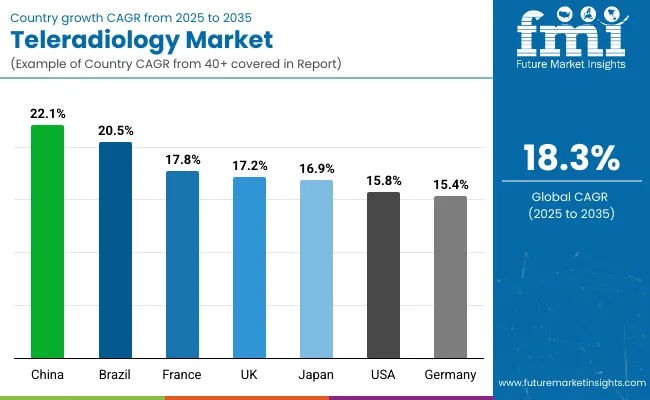
In the teleradiology market, China leads with the highest projected CAGR of 22.1% from 2025 to 2035, driven by massive healthcare digitalization initiatives, government support for telemedicine, and expanding healthcare infrastructure. Brazil follows with a CAGR of 20.5%, supported by emerging market dynamics and significant healthcare expansion needs.
France shows strong growth at 17.8%, benefiting from healthcare system digitalization and specialist shortage solutions. The UK demonstrates solid growth at 17.2%, supported by NHS digital transformation and post-COVID telehealth adoption. Japan and the USA show moderate growth at 16.9% and 15.8% respectively, driven by aging populations and established healthcare infrastructure modernization. Germany, with a CAGR of 15.4%, experiences steady expansion supported by healthcare digitalization standards, reflecting regional differences in market maturity and regulatory environments.
The report covers an in-depth analysis of 40+ countries; seven top-performing OECD countries are highlighted below.
Revenue from teleradiology in China is projected to grow at a CAGR of 22.1% from 2025 to 2035, significantly exceeding the global average of 18.3%. Growth is fueled by massive healthcare digitalization initiatives, government support for telemedicine infrastructure, and increasing demand for remote diagnostic services across major cities, including Beijing, Shanghai, and Guangzhou.
Chinese healthcare providers are increasingly adopting advanced teleradiology platforms as medical imaging volumes expand and specialist access needs grow. The country is expected to account for 45% of the Asia-Pacific market share, driven by both domestic healthcare expansion and technology infrastructure development.
Key Statistics:
Sales of teleradiology services in Brazil are slated to flourish at a CAGR of 20.5% from 2025 to 2035, approaching regional leadership levels. Growth has been concentrated in urban healthcare expansion and remote area coverage in São Paulo, Rio de Janeiro, and Brasília regions.
Market adoption is shifting from basic image transmission to comprehensive AI-powered diagnostic platforms and subspecialty consultation services. Local healthcare partnerships and international technology collaborations are leading deployment strategies. Rising healthcare demand and improved telecommunications infrastructure are primary growth drivers.
Key Statistics:
The teleradiology market in the USA is anticipated to expand at a CAGR of 15.8% from 2025 to 2035, reflecting mature market dynamics with a focus on AI integration and workflow optimization. Growth is centered on emergency care enhancement and rural healthcare access in California, Texas, and Florida regions.
Advanced AI-powered platforms and subspecialty consultation services are being deployed for hospital systems, imaging centers, and emergency departments. FDA regulations and healthcare quality standards support the development of comprehensive teleradiology applications across diverse healthcare environments.
Key Statistics:
Revenue from teleradiology in France is projected to rise at a CAGR of 17.8% from 2025 to 2035, supported by steady demand for healthcare system digitalization and specialist shortage solutions. Teleradiology services in Paris, Lyon, and Marseille are experiencing expansion in emergency care applications, rural healthcare access, and subspecialty imaging consultations. French healthcare regulations and digital health initiatives are leveraging advanced teleradiology platforms to meet quality expectations for comprehensive diagnostic imaging services.
Key Statistics:
The teleradiology market in the UK is expected to grow at a CAGR of 17.2% from 2025 to 2035, reflecting robust post-COVID healthcare digitalization trends. Growth is driven by NHS digital transformation initiatives and improved emergency care protocols in the London, Manchester, and Edinburgh regions.
Integrated teleradiology systems and healthcare efficiency standards are driving technology adoption, while healthcare providers incorporate AI-powered diagnostic tools into comprehensive patient care programs. Brexit-related healthcare workforce challenges and specialist shortages are influencing market dynamics.
Key Statistics:
Demand for teleradiology in Japan is projected to expand at a CAGR of 16.9% from 2025 to 2035, driven by aging population demographics and gradual regulatory acceptance of telemedicine technologies. Growth is concentrated in urban healthcare markets, including Tokyo, Osaka, and Nagoya, where hospital systems and imaging centers are expanding remote diagnostic capabilities. Healthcare workforce shortages and increasing chronic disease prevalence are gradually building comprehensive teleradiology requirements across emergency care and subspecialty imaging applications.
Key Statistics:
Demand for teleradiology in Germany is expected to increase at a CAGR of 15.4% from 2025 to 2035, exceeding the European average. Demand is driven by advanced healthcare infrastructure, robust data protection regulations, and comprehensive digital health standards in Berlin, Munich, and Hamburg markets. Evidence-based healthcare protocols and specialized imaging systems are increasingly adopting AI-powered teleradiology technologies for optimal diagnostic accuracy and workflow efficiency.
Key Statistics:
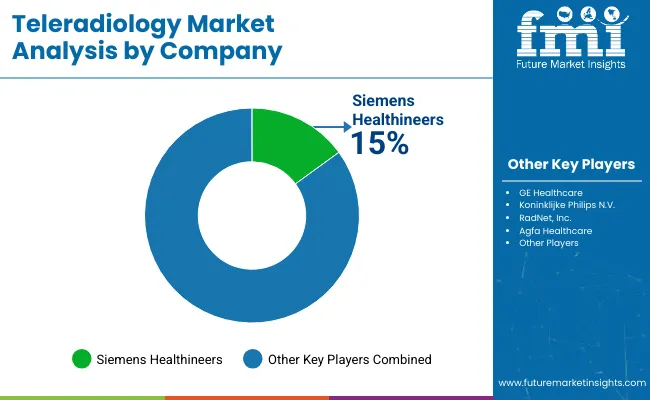
The market is moderately concentrated, featuring a mix of global healthcare technology companies, specialized teleradiology providers, and AI-powered platform developers with varying levels of technical expertise, infrastructure capabilities, and market reach. Siemens Healthineers leads the market with an estimated 15% share, primarily driven by its comprehensive imaging portfolio, cloud-based solutions, and advanced AI integration capabilities across multiple diagnostic applications.
GE Healthcare maintains a significant market presence with its specialization in medical imaging equipment and teleradiology platforms, leveraging established relationships with major healthcare systems and comprehensive technical support services. Koninklijke Philips N.V., RadNet Inc., and Agfa Healthcare differentiate through diversified healthcare portfolios, innovative cloud technologies, and specialized AI algorithms that cater to various emergency care, subspecialty imaging, and workflow optimization applications.
Regional specialists and emerging AI companies focus on specific market segments, cost-effective solutions, and innovative diagnostic technologies, addressing growing demand from rural healthcare, emergency services, and specialized medical facilities.
Entry barriers remain moderate to high, driven by challenges in regulatory compliance, data security requirements, and the need for technical expertise across multiple imaging modalities. Competitiveness increasingly depends on AI innovation, cloud infrastructure reliability, and healthcare partnership capabilities for diverse clinical environments.
| Items | Value |
|---|---|
| Quantitative Units (2025) | USD 10.5 Billion |
| Modality | X-Ray Scans, CT Scans, MRI Scans, Ultrasound Scans, Nuclear Scan, Cardiac Echo, Mammography, Electromyography |
| Organ Type | Brain, Lung, Heart, Liver, Bones, Pancreas, Spleen, Others |
| Regions Covered | North America, Europe, Asia Pacific, Latin America, Middle East & Africa |
| Countries Covered | United States, Canada, United Kingdom, Germany, France, China, Japan, South Korea, Brazil, Australia, India, and 40+ Countries |
| Key Companies Profiled | Cerner Corporation, Siemens Healthineers, McKesson Corporation, Agfa Healthcare, MEDNAX Services Inc., ONRAD Inc., Novarad Corporation, TeleDiagnostic Solutions Pvt. Ltd., Telerad Tech, StatRad LLC, MedWeb LLC, USARAD Holdings Inc., Everlight Radiology, SRL Diagnostics, Vital Radiology Services, Telemedicine Clinic |
| Additional Attributes | Dollar sales by imaging modality and organ specialization, healthcare provider preferences for remote diagnostic services, regulatory compliance landscape, impact of AI technologies on diagnostic accuracy, regional healthcare digitalization trends and growth opportunities |
The global teleradiology market is estimated to be valued at USD 10.5 billion in 2025.
The market size for teleradiology is projected to reach USD 56.4 billion by 2035.
The teleradiology market is expected to grow at an 18.3% CAGR between 2025 and 2035.
The X-ray scans segment is projected to lead in the teleradiology market with 32% market share in 2025.
In terms of organ type, the brain segment is projected to command 30% share in the teleradiology market in 2025.


Our Research Products

The "Full Research Suite" delivers actionable market intel, deep dives on markets or technologies, so clients act faster, cut risk, and unlock growth.

The Leaderboard benchmarks and ranks top vendors, classifying them as Established Leaders, Leading Challengers, or Disruptors & Challengers.

Locates where complements amplify value and substitutes erode it, forecasting net impact by horizon

We deliver granular, decision-grade intel: market sizing, 5-year forecasts, pricing, adoption, usage, revenue, and operational KPIs—plus competitor tracking, regulation, and value chains—across 60 countries broadly.

Spot the shifts before they hit your P&L. We track inflection points, adoption curves, pricing moves, and ecosystem plays to show where demand is heading, why it is changing, and what to do next across high-growth markets and disruptive tech

Real-time reads of user behavior. We track shifting priorities, perceptions of today’s and next-gen services, and provider experience, then pace how fast tech moves from trial to adoption, blending buyer, consumer, and channel inputs with social signals (#WhySwitch, #UX).

Partner with our analyst team to build a custom report designed around your business priorities. From analysing market trends to assessing competitors or crafting bespoke datasets, we tailor insights to your needs.
Supplier Intelligence
Discovery & Profiling
Capacity & Footprint
Performance & Risk
Compliance & Governance
Commercial Readiness
Who Supplies Whom
Scorecards & Shortlists
Playbooks & Docs
Category Intelligence
Definition & Scope
Demand & Use Cases
Cost Drivers
Market Structure
Supply Chain Map
Trade & Policy
Operating Norms
Deliverables
Buyer Intelligence
Account Basics
Spend & Scope
Procurement Model
Vendor Requirements
Terms & Policies
Entry Strategy
Pain Points & Triggers
Outputs
Pricing Analysis
Benchmarks
Trends
Should-Cost
Indexation
Landed Cost
Commercial Terms
Deliverables
Brand Analysis
Positioning & Value Prop
Share & Presence
Customer Evidence
Go-to-Market
Digital & Reputation
Compliance & Trust
KPIs & Gaps
Outputs
Full Research Suite comprises of:
Market outlook & trends analysis
Interviews & case studies
Strategic recommendations
Vendor profiles & capabilities analysis
5-year forecasts
8 regions and 60+ country-level data splits
Market segment data splits
12 months of continuous data updates
DELIVERED AS:
PDF EXCEL ONLINE
Teleradiology Services Market Growth - Trends & Forecast 2025 to 2035

Thank you!
You will receive an email from our Business Development Manager. Please be sure to check your SPAM/JUNK folder too.
Chat With
MaRIA