
- Market Size (2026)
- USD 46.7 Bn
- Forecast (2036)
- USD 99.0 Bn
- CAGR (2026 to 2036)
- 7.8%
How big is Ubiquinone Market in 2026?
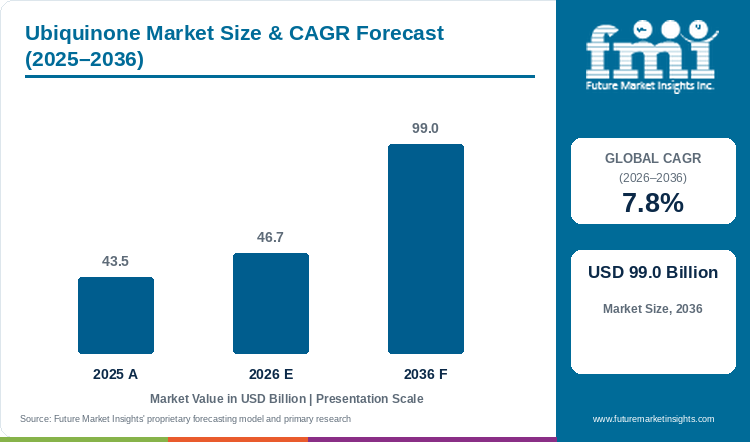
Accounting for USD 43.5 billion in 2025 and rising to USD 46.7 billion in 2026, the ubiquinone market is projected to expand to USD 99.0 billion by 2036, advancing at a CAGR of 7.8%.
Supplement and medical-nutrition brands pay a clear price premium for lipid-solubilized ubiquinone softgels because raw crystalline CoQ10 powder absorbs poorly in the human digestive tract. Standing at USD 43.5 billion in 2025, the global ubiquinone market size is forecast to climb from USD 46.7 billion in 2026 to USD 99.0 billion by 2036, expanding at a 7.8% CAGR between 2026 and 2036. As per FMI findings, oxidized ubiquinone CoQ10 holds 61.2% of 2026 demand because oxidized crystals stay stable at room temperature inside standard capsules and tablets. That shelf-life advantage separates bio-fermented ubiquinone supply from general preventive dietary supplement formats sold in mass retail. Even so, heat-induced crystal clumping above 48°C and oxygen sensitivity force softgel makers to use climate-controlled storage and nitrogen-flushed blister packs.
Key Market Trends & Insights
- By redox state: Ubiquinone Oxidized Form CoQ10 holds a 61.2% share in 2026 because high thermal and oxygen stability simplifies bulk blending and long-term ambient storage.
- By production process: Natural Yeast Microbial Fermentation represents 64.9% in 2026 as yeast-derived biosynthesis yields 100% all-trans stereoisomers free of synthetic cis-isomer impurities.
- By physical delivery form: Lipid Oil Suspension in Softgels accounts for 52.0% in 2026 since medium-chain triglyceride carriers triple intestinal lymphatic absorption.
- By target application: Cardiovascular Heart Health Supplements secure 47.4% in 2026 through clinician-recommended mitochondrial ATP support in heart failure and hypertension cohorts.
- By distribution channel: Retail and Hospital Pharmacies command 43.5% in 2026 as cardiologists and pharmacists co-dispense coenzyme Q10 alongside prescription statin regimens.
Regional Highlights
- Top national expansion: Brazil leads country growth projections at an 8.5% CAGR through 2036 via ANVISA bioactive supplement clearances and compounding pharmacy demand.
- Broader country progression: The United States tracks at an 8.3% CAGR ahead of Canada at 8.1% and the United Kingdom at 7.6%, propelled by cardiometabolic softgel and gummy adoption.
Market Size & Forecast
Table 1: Market Size and Forecast for the Ubiquinone Market (USD billion and CAGR percentage), 2025 to 2036
| Metric | Value |
|---|---|
| 2025 Market Size | USD 43.5 billion |
| Estimated Market Size in 2026 | USD 46.7 billion |
| Projected Market Size by 2036 | USD 99.0 billion |
| CAGR, 2026 to 2036 | 7.8% |
| Added Value, 2026 to 2036 | USD 52.3 billion |
Poor intestinal absorption of raw crystalline ubiquinone powder has long been the biggest hurdle for supplement brands trying to prove clinical heart-health benefits. When a manufacturer presses dry CoQ10 powder into a hard tablet, most of the active ingredient passes through the body unabsorbed. A March 2025 Phase 1 pharmacokinetic trial in Nutrients demonstrated that a self-emulsifying lipid formulation combining medium-chain triglycerides and conjugated linoleic acid sharply boosted human blood absorption of coenzyme Q10 compared with standard powder. Product development teams therefore combine fermented ubiquinone with hermetic gelatin softgel capsules to deliver reliable blood levels to consumers.
Finished-Regimen and Active-Bioactive Sizing
Table 2: Finished-Regimen and Bulk Active Sizing for the Ubiquinone Market (USD billion and operational ranges), 2025 to 2036
| Metric | 2025 | 2026 | 2036 |
|---|---|---|---|
| Market size (USD billion) | 43.5 | 46.7 | 99.0 |
| Finished cardiometabolic & cosmeceutical units (billion packs) | 1.52 to 1.68 | 1.63 to 1.80 | 3.35 to 3.72 |
| Bulk fermented CoQ10 & ubiquinol active volume (metric tons) | 2,650 to 2,920 | 2,850 to 3,150 | 5,900 to 6,520 |
| Average finished retail & clinical realization per pack (USD) | 25.9 to 28.6 | 26.0 to 28.7 | 26.6 to 29.5 |
Operational note on dosage ranges reflects 100 to 300 mg daily oral ubiquinone in cardiovascular softgels and 0.5% to 2.0% inclusion in topical anti-aging emulsions.
Widespread prescribing of cholesterol-lowering statin drugs among middle-aged and older adults continues to fuel repeat pharmacy purchases of ubiquinone supplements. Because statins block the same liver pathway that produces both cholesterol and natural coenzyme Q10, many patients experience muscle aches and fatigue that lead them to seek daily supplementation. Nutraceutical brands build their flagship cardiac lines around bioavailable coenzyme Q10 ingredients to serve these long-term statin users.
Per Capita & Encapsulation Line Sizing
Table 3: Per Capita and Encapsulation Line Valuation Indicators for the Ubiquinone Market (USD), 2025 to 2036
| Metric | 2025 | 2026 | 2036 |
|---|---|---|---|
| World population (billion) | 8.2 | 8.3 | 9.0 |
| Valuation per 1,000 people (USD thousand) | 5.3 | 5.6 | 11.0 |
| Annual output per nutraceutical & cosmeceutical line (USD million) | 9.8 to 11.2 | 10.5 to 12.0 | 21.8 to 24.8 |
| Solubilized ubiquinol & CWD micellar share (%) | 36.5% to 38.0% | 38.0% to 39.5% | 46.5% to 49.5% |
Table 4: Pharmacy & Channel Valuation Indicators for the Ubiquinone Market (USD billion and percentages), 2026
| Metric | Value | Institutional Reference Basis |
|---|---|---|
| Market size, 2026 | USD 46.7 billion | 2026 global finished & bioactive valuation baseline |
| Nutraceutical softgel & cosmeceutical lines global | 4,150 lines | Cardiometabolic softgel, gummy & Q10 skin-care lines |
| Market valuation per production line | USD 11.25 million | Annualized finished & specialty ubiquinone output |
| Retail and Hospital Pharmacies value, 2026 | USD 20.3 billion | 43.5% distribution channel allocation |
Widespread pill fatigue among younger wellness shoppers is pushing supplement brands to launch chewable gummies and effervescent tablets as well as functional energy drinks. Because raw ubiquinone is fat-soluble and leaves an oily ring in water, beverage and gummy makers buy cold-water-dispersible beadlets coated in starch or cyclodextrin. Contract packers blend these water-dispersible powders into pectin-based coenzyme Q10 gummies to win supermarket and online subscription sales.
Analyst Perspective
"Global supplement and medical-nutrition buyers no longer evaluate ubiquinone solely on bulk per-kilogram crystal price. Cardiometabolic brands pay substantial premiums for yeast-fermented all-trans ubiquinone and stabilized ubiquinol pre-solubilized in medium-chain triglycerides or cyclodextrin micelles that prove superior plasma area-under-the-curve in human trials. Fermentation leaders that pair USP compendial purity with patent-protected cold-water-dispersible and non-recrystallizing softgel pastes will capture the highest value share through 2036."
- Nandini Roy Choudhury, Principal Consultant, Future Market Insights.
How is the ubiquinone market segmented?
The ubiquinone market is segmented by redox state, production process, physical delivery form, target application, and distribution channel. In 2026, Ubiquinone Oxidized Form CoQ10 is projected at 61.2%, Natural Yeast Microbial Fermentation at 64.9%, Lipid Oil Suspension in Softgels at 52.0%, Cardiovascular Heart Health Supplements at 47.4%, and Retail and Hospital Pharmacies at 43.5%.
By redox state: Ubiquinone Oxidized Form CoQ10 and Ubiquinol Reduced Active Bioavailable Form.
By production process: Natural Yeast Microbial Fermentation and Bacterial Fermentation Synthesis alongside Chemical Semisynthetic Synthesis.
By physical delivery form: Lipid Oil Suspension in Softgels and Water-Soluble and CWD Dispersible Powders alongside Crystalline Pure Yellow-Orange Powder.
By target application: Cardiovascular Heart Health Supplements with Cellular Energy and Anti-Aging Formulations alongside Statin-Induced Myopathy Support and Cosmetic Anti-Wrinkle Facial Creams.
By distribution channel: Retail and Hospital Pharmacies and Direct Ingredient Supply to Nutraceutical Brands alongside Online Health and E-Commerce Platforms and Specialty Wellness and Dermatology Clinics.
Why does Ubiquinone Oxidized Form CoQ10 lead the redox state category?
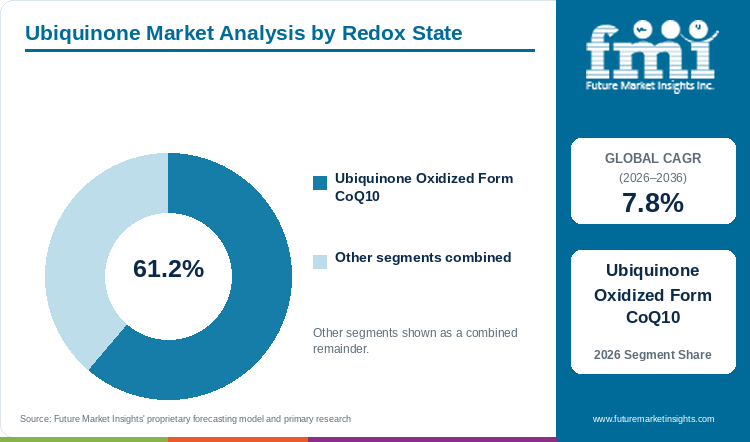
Ubiquinone Oxidized Form CoQ10 holds an estimated 61.2% of redox state demand in 2026, anchored by superior oxidative stability across two-piece capsules, tablets, and topical emulsions.
Table 5: Redox State Share for the Ubiquinone Market (percentage share), 2026
| Redox State | Share (2026) |
|---|---|
| Ubiquinone Oxidized Form CoQ10 | 61.2% |
| Other Segments Combined | 38.8%* |
| Total | 100.0% |
*Note that the remaining redox state category accounts for the balance of 2026 global ubiquinone demand.
Table 6: Redox State Leadership and Market Growth for the Ubiquinone Market (segment and CAGR percentage), 2026 to 2036
| Metric | Value |
|---|---|
| Global CAGR (2026 to 2036) | 7.8% |
| Leading Segment | Ubiquinone Oxidized Form CoQ10 |
Lower packaging costs and strong resistance to air oxidation keep oxidized ubiquinone CoQ10 ahead of reduced ubiquinol across mass-market supplements and anti-aging skin creams. While reduced ubiquinol turns back into ubiquinone if exposed to oxygen during mixing, oxidized ubiquinone remains stable in two-piece capsules and multivitamin tablets as well as cosmetic jars. Supplement formulators pair oxidized ubiquinone with cardiovascular wellness supplements to guarantee a full two- to three-year retail shelf life.
- Ubiquinone Oxidized Form CoQ10 holds 61.2% of redox state value in 2026 because superior oxidative stability and lower encapsulation cost support mass pharmacy distribution.
- A March 2026 randomized crossover trial in Food Science & Nutrition confirmed strong systemic bioavailability and tolerability across both ubiquinone and cocrystal ubiquinol oral formulations in healthy adults.
What sustains Natural Yeast Microbial Fermentation leadership in the production process segment?
Natural Yeast Microbial Fermentation represents 64.9% of the production process category in 2026, supported by 100% bio-identical all-trans stereoisomer purity.
Clean-label positioning and strict pharmacopeial purity standards drive supplement brands toward natural yeast microbial fermentation. Yeast fermentation produces 100% all-trans coenzyme Q10 that is identical to the ubiquinone made inside human cells, whereas chemical synthesis from tobacco-leaf solanesol leaves unwanted cis-isomer byproducts. Brands source yeast-fermented CoQ10 alongside fermented nutritional yeast bioactives to support natural, non-synthetic label claims.
- Natural Yeast Microbial Fermentation represents 64.9% of the production process segment in 2026 as global supplement brands reject synthetic cis-isomer residues.
- In September 2025, Kaneka Corporation launched its Watashi no Chikara Q10 functional drink in Japan containing 100 mg of yeast-fermented coenzyme Q10 for daily energy and sleep support.
How does Lipid Oil Suspension in Softgels lead the physical delivery form category?
Lipid Oil Suspension in Softgels accounts for 52.0% of physical delivery form volume in 2026, driven by enhanced lymphatic absorption and hermetic oxygen protection.
Consumer demand for one-a-day heart supplements that absorb easily with meals keeps lipid oil suspension in softgels as the leading delivery format. Thermal dispersion of ubiquinone crystals in warm carrier oils inside a sealed gelatin softgel prevents the active ingredient from re-crystallizing in the stomach. Softgel encapsulators frequently combine ubiquinone pastes with marine omega-3 lipid concentrates to offer combined heart and cholesterol support in a single capsule.
- Lipid Oil Suspension in Softgels accounts for 52.0% of physical delivery form demand in 2026 because lipid solubilization maximizes chylomicron transport across enterocytes.
- A June 2025 formulation study in AJPS showed that co-amorphous and lipid-solubilized coenzyme Q10 systems markedly improve dissolution and oral bioavailability over raw crystals.
Why do Cardiovascular Heart Health Supplements lead the target application category?
Cardiovascular Heart Health Supplements secure 47.4% of target application value in 2026, supported by clinical myocardial ATP and endothelial health protocols.
Elevated global rates of chronic heart failure and high blood pressure among aging populations anchor demand for cardiovascular heart health supplements. Clinical cardiology studies such as the 420-patient Q-Symbio trial have shown that daily coenzyme Q10 supplementation supports heart-muscle pumping efficiency and lowers hospital readmissions.
- Cardiovascular Heart Health Supplements secure 47.4% of target application demand in 2026 as aging populations adopt preventive mitochondrial cardiac regimens.
- A May 2025 randomized controlled trial of 120 cardiac patients in Eur. J. Med. Res. confirmed that six months of daily CoQ10 supplementation improved left ventricular global longitudinal strain.
What gives Retail and Hospital Pharmacies the leading position in distribution channel?
Retail and Hospital Pharmacies command 43.5% of distribution channel share in 2026, anchored by pharmacist statin co-dispensing and cardiologist recommendations.
Doctor recommendations and pharmacist advice at the prescription counter make retail and hospital pharmacies the primary sales channel for ubiquinone. When patients pick up prescription statin refills, pharmacists routinely suggest a 100 mg or 200 mg CoQ10 softgel pack to prevent muscle cramping.
- Retail and Hospital Pharmacies secure 43.5% of channel sales value during 2026 because clinical credibility and prescription co-dispensing anchor patient adherence.
- In February 2026, Pharma Nord ApS detailed how its pharmaceutical-grade Bio-Quinone Active Q10 oil-matrix softgel serves as the documented absorption benchmark across clinical cardiology trials.
What are the growth drivers and restraints alongside opportunities in the ubiquinone market?
In the ubiquinone market, preventive cardiometabolic supplementation and statin-adjunct regimens drive adoption whereas low crystalline aqueous solubility and thermal recrystallization at 48°C restrain dry powders and CWD gummies and fertility protocols generate specialty growth.
- Driver: Global prescription statin adoption and preventive cardiometabolic care among aging adults accelerate daily 100 to 300 mg ubiquinone supplementation.
- Restraint: Poor aqueous solubility and sensitivity to UV light and temperatures above 48°C alongside export fermentation price competition challenge unformulated bulk suppliers.
- Opportunity: Reproductive fertility oocyte-quality protocols and migraine prophylaxis regimens alongside cold-water-dispersible functional energy beverages create high-growth specialty segments.
Growth Analysis and Future Potential: Qualitative Demand Drivers
Delayed parenthood and rising demand for in vitro fertilization treatments are creating a fast-growing medical market for high-dose ubiquinone and ubiquinol supplements. Fertility specialists routinely recommend three months of pre-conception coenzyme Q10 supplementation to boost mitochondrial energy inside aging egg cells and improve embryo quality. A January 2026 clinical review in Antioxidants confirmed that ubiquinol and ubiquinone support oocyte mitochondrial renewal and early reproductive outcomes. Supplement brands are bundling these fertility regimens with mitochondrial cellular health supplements sold through fertility clinics and specialty pharmacies.
Risk Assessment of the Ubiquinone Market: Operational and Formulation Friction
Heat sensitivity above 48°C and intense price competition from bulk fermentation plants in China represent the main commercial challenges in the ubiquinone market. If softgels or topical creams overheat during summer shipping, dissolved ubiquinone cools into large crystal needles that cannot pass through the intestinal wall or skin barrier. A June 2026 study in the Journal of Liposome Research demonstrated that encapsulating coenzyme Q10 inside ultra-small lipid nanoparticles prevents crystal clumping and protects the active from UV light. Formulators therefore rely on functional nutraceutical excipients to keep high-potency softgels stable in warm climates.
Commercial Opportunity Analysis: Formulation Differentiation and Value-Add Formats
Prestige skincare and dermatology brands are driving high-margin growth by adding complexed ubiquinone to anti-wrinkle facial serums and eye creams as well as sunscreens. Sun exposure and urban pollution drain natural CoQ10 levels in outer skin cells, which speeds up collagen breakdown and fine lines. A January 2025 cosmetic formulation study in the Journal of Cosmetic Dermatology showed that a complexed ubiquinone serum combined with hyaluronic acid and vitamin C improved skin antioxidant stability and anti-aging performance. Ingredient producers supply these topical grades alongside bioactive nutraceutical ingredients for beauty-from-within product lines.
Ubiquinone Market by Country (2026 to 2036)
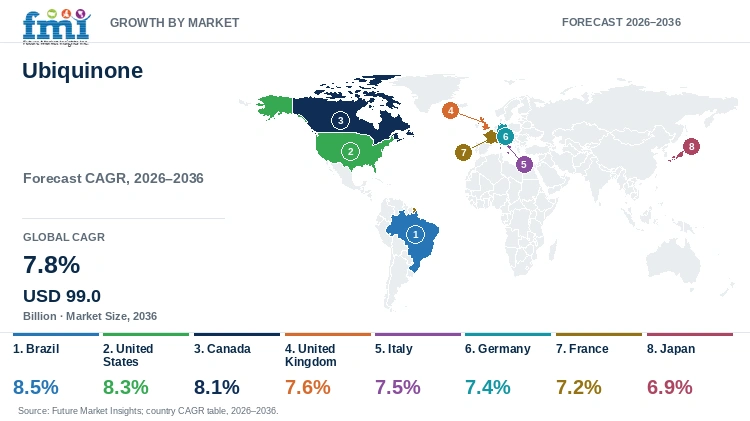
Regional forecasting places Brazil at the front of ubiquinone growth with an 8.5% CAGR through 2036, whereas Japan tracks at 6.9% as a mature fermentation pioneer.
Table 7: Country CAGR and Primary Growth Levers for the Ubiquinone Market (CAGR percentage and operational drivers), 2026 to 2036
| Country | CAGR (2026 to 2036) | Primary Growth Lever |
|---|---|---|
| Brazil | 8.5% | ANVISA bioactive supplement clearances and 8,000+ magistral compounding pharmacies |
| United States | 8.3% | 40M+ statin-prescribed adult cohort and domestic Pasadena, Texas yeast fermentation |
| Canada | 8.1% | Health Canada NHP cardiovascular and migraine monographs and export softgel plants |
| United Kingdom | 7.6% | Private fertility clinic oocyte protocols and high-street vegan softgel adoption |
| Italy | 7.5% | Physician-dispensed cardiometabolic combination nutraceuticals in community pharmacies |
| Germany | 7.4% | Flagship Q10 cosmeceutical skin-care production and Apotheke micellar sachets |
| France | 7.2% | Clean-label parapharmacy micronutrition and vectorized luxury cosmeceutical serums |
| Japan | 6.9% | Foods with Function Claims fatigue-reduction drinks and pioneer fermentation base |
Source: Future Market Insights analysis
Brazil Ubiquinone Market Outlook (2026 to 2036)
Nutraceutical demand in Brazil climbs at a leading 8.5% CAGR between 2026 and 2036, driven by clear ANVISA supplement regulations and a nationwide network of more than 8,000 compounding pharmacies. Cardiologists and preventive medicine doctors in São Paulo and Rio de Janeiro frequently write custom prescriptions for 100 to 200 mg ubiquinone capsules to manage blood pressure and statin side effects. A May 2025 clinical study in the Journal of Clinical Hypertension confirmed that coenzyme Q10 administration helps support healthy blood pressure and vascular function in adults with cardiometabolic risk. Domestic supplement makers in southern Brazil are also increasing orders for water-dispersible CoQ10 powders used in pre-workout and longevity drink mixes.
Key takeaway: In Brazil, ANVISA bioactive supplement clearances and personalized magistral pharmacy prescriptions are projected to drive an 8.5% CAGR.
United States Ubiquinone Market Outlook (2026 to 2036)
In the United States, market valuation is forecast to advance at an 8.3% CAGR between 2026 and 2036, supported by more than 40 million adults taking prescription statins and domestic yeast fermentation in Texas. Pharmacy chains and warehouse clubs as well as online retailers in the United States represent the world's largest market for 100 mg to 400 mg ubiquinone softgels and chewable gummies. An October 2025 systematic review and meta-analysis in the Journal of Nutritional Science confirmed that coenzyme Q10 supplementation alleviates statin-associated muscle symptoms in patients on cholesterol-lowering therapy. Contract softgel makers in California and New Jersey continue shifting toward USP-verified all-trans ubiquinone and ubiquinol pastes.
Key takeaway: Throughout the United States, widespread statin-adjunct supplementation and domestic Texas fermentation capacity support an 8.3% CAGR through 2036.
Canada Ubiquinone Market Outlook (2026 to 2036)
Unlike the dietary supplement notification system in the United States, Canada regulates ubiquinone under pre-cleared Health Canada Natural Health Product monographs, supporting an 8.1% CAGR from 2026 to 2036. Official eight-digit Natural Product Numbers allow brands in Canada to print approved claims for cardiovascular maintenance and adult migraine prophylaxis directly on pharmacy bottles, which builds strong consumer trust. A January 2026 clinical review in Cardiology in Review highlighted the growing integration of coenzyme Q10 alongside standard heart failure and statin regimens across North America cardiology clinics. Major contract softgel plants in Ontario and Quebec as well as western Canada export certified CoQ10 capsules across global pharmacy distributors.
Key takeaway: In Canada, Health Canada NHP cardiovascular and migraine monograph claims alongside export softgel manufacturing are forecast to drive an 8.1% CAGR.
United Kingdom Ubiquinone Market Outlook (2026 to 2036)
Throughout the United Kingdom, supplement demand advances at a 7.6% CAGR through 2036, propelled by private fertility clinic protocols and high-street pharmacy heart-health sales. Fertility clinics in London and Manchester routinely advise women over 35 to take 200 to 600 mg of solubilized ubiquinone daily before starting in vitro fertilization cycles. A March 2026 clinical trial in Reproductive Sciences (NCT06405204) demonstrated that oral CoQ10 supplementation markedly increased retrieved oocyte counts and antral follicle numbers as well as endometrial thickness in poor ovarian responders. Retail chains including Boots and Holland & Barrett are also expanding plant-based vegan ubiquinone softgels to serve wellness shoppers in the United Kingdom.
Key takeaway: Throughout the United Kingdom, reproductive fertility clinic protocols and high-street vegan softgel adoption sustain a 7.6% CAGR.
Italy Ubiquinone Market Outlook (2026 to 2036)
Whereas northern continental shoppers usually buy single-ingredient CoQ10 capsules, Italy expands at a 7.5% CAGR between 2026 and 2036 through doctor-recommended combination tablets pairing ubiquinone with fermented red yeast rice and berberine. Family doctors and cardiologists in Italy frequently prescribe these multi-ingredient nutraceuticals in community pharmacies to manage borderline cholesterol while preventing muscle fatigue. A September 2025 clinical study from researchers in Italy published in Food Science & Nutrition confirmed that a nutraceutical blend containing coenzyme Q10 and fermented red yeast rice improved cardiac dysfunction markers. Contract softgel factories in Lombardy and Emilia-Romagna also manufacture high-potency topical CoQ10 ampoules for pharmacy brands across Europe.
Key takeaway: In Italy, physician-dispensed cardiometabolic combination nutraceuticals and Lombardy softgel manufacturing are anticipated to support a 7.5% CAGR through 2036.
Germany Ubiquinone Market Outlook (2026 to 2036)
Germany is projected to record a 7.4% CAGR from 2026 to 2036, anchored by large-scale Q10 anti-aging skincare production in Hamburg and medical micronutrient sachets sold in Apotheke pharmacies. Mass and dermocosmetic skincare lines in Germany use skin-identical ubiquinone to protect facial skin from UV aging and oxidative energy loss. An April 2025 cellular bioenergetics study in Redox Biology demonstrated that topical coenzyme Q10 protects human keratinocytes against oxidation-induced energy stress and preserves cellular ATP production. Community Apotheke pharmacies across Munich and Berlin as well as Frankfurt generate steady demand for liquid micellar ubiquinone drops and orthomolecular cardiac vials prescribed to older cardiometabolic patients nationwide.
Key takeaway: In Germany, flagship Q10 cosmeceutical skin-care production and Apotheke micellar micronutrient regimens are slated to sustain a 7.4% CAGR.
France Ubiquinone Market Outlook (2026 to 2036)
France advances at a 7.2% CAGR between 2026 and 2036, supported by strong parapharmacy demand for cellular vitality supplements and sports recovery capsules as well as luxury anti-aging serums. Retail pharmacists and national nutrivigilance regulators in France enforce strict quality tracking and purity testing on bioactive supplements sold in community pharmacies and specialty health stores. A May 2026 pharmacovigilance analysis in Nutrients examining regional EudraVigilance safety reports confirmed that coenzyme Q10 exhibits a favorable clinical safety profile across health and sports supplementation cohorts in Europe. Prestige cosmetic laboratories in Paris and Lyon as well as Chartres incorporate liposomal ubiquinone into luxury night-repair creams exported across global beauty channels.
Key takeaway: In France, clean-label parapharmacy micronutrition and vectorized luxury cosmeceutical serums are predicted to sustain a 7.2% CAGR.
Japan Ubiquinone Market Outlook (2026 to 2036)
Unlike Western countries where CoQ10 started in health-food stores, Japan pioneered prescription ubiquinone for heart failure in 1974 and expands at a 6.9% CAGR through 2036. Under Japan's Foods with Function Claims system, beverage and supplement brands sell ready-to-drink Q10 shots and jellies as well as softgels carrying approved claims for reducing daily fatigue and supporting skin moisture. In October 2025, Kaneka Corporation relaunched its Watashi no Chikara BEAUTIFLY ex functional supplement in Japan combining active coenzyme Q10 and astaxanthin to maintain skin moisture and epidermal renewal in healthy women. Domestic fermentation leadership in Takasago keeps Japan at the forefront of high-purity ubiquinone innovation.
Key takeaway: In Japan, Foods with Function Claims fatigue-reduction drinks and domestic fermentation leadership are likely to support a 6.9% CAGR.
National CAGRs in the complete report span North America and Latin America with Western Europe and Eastern Europe. Coverage further includes East Asia and South Asia and Pacific alongside Middle East and Africa.
Who are the notable companies in the ubiquinone market?
Kaneka Corporation, Xiamen Kingdomway Group Company, Zhejiang NHU Co., Ltd., Zhejiang Medicine Co., Ltd., CSPCH Pharmaceutical Group Limited, dsm-firmenich AG, Pharma Nord ApS, Abbott Laboratories, Sanofi SA, and Nestlé Health Science are the notable companies in the ubiquinone market.
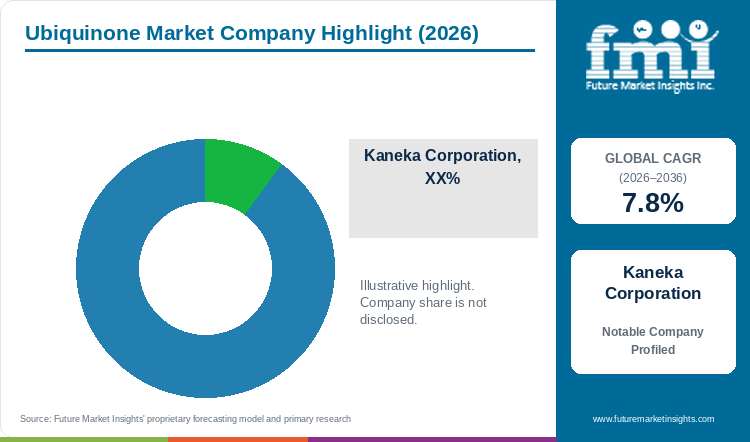
Competitive positioning in the ubiquinone industry separates primary microbial fermentation active producers in Japan and China from global solubilization technology suppliers and finished-supplement leaders.
- Primary Microbial Fermentation Active Producers: Kaneka Corporation and Xiamen Kingdomway Group Company alongside Zhejiang NHU Co. Ltd. and Zhejiang Medicine Co. Ltd. with CSPCH Pharmaceutical Group Limited operate world-scale fermentation plants.
- Solubilized Complex and Pharmaceutical-Grade Specialists: dsm-firmenich AG and Pharma Nord ApS engineer cold-water-dispersible ALL-Q beadlets and clinically validated pharmaceutical-grade Bio-Quinone softgel preparations.
- Clinical Healthcare and Finished Nutraceutical Leaders: Abbott Laboratories and Sanofi SA alongside Nestlé Health Science commercialize cardiometabolic and medical nutrition product lines across global pharmacies.
Competitive Benchmarking: Ubiquinone Market
Table 8: Competitive Benchmarking for the Ubiquinone Market (qualitative capability ratings), 2026
| Company | Fermentation & Isomer Purity | Solubilized Bioavailability Fit | Clinical & Regulatory Dossier | Geographic Reach |
|---|---|---|---|---|
| Kaneka Corporation | High | High | High | Global yeast-fermented Kaneka Q10 and Ubiquinol leader; Japan and Texas plants |
| Xiamen Kingdomway Group Company | High | High | High | World's largest microbial fermentation CoQ10 exporter across Americas, Europe, and Asia |
| Zhejiang NHU Co., Ltd. | High | High | High | Global fermented CoQ10 crystal and microencapsulated CWD beadlet supplier |
| Zhejiang Medicine Co., Ltd. | High | Medium | High | USP and Ph. Eur. certified pharmaceutical-grade ubiquinone active producer |
| CSPCH Pharmaceutical Group Limited | High | Medium | High | Inner Mongolia and Hebei microbial fermentation scale serving global encapsulators |
| dsm-firmenich AG | Medium | High | High | Global ALL-Q 10% CWD beadlet and solubilized premix network |
| Pharma Nord ApS | Unscored | High | High | Denmark-based pharmaceutical-grade Bio-Quinone Q10 leader; Q-Symbio & KiSel-10 trial supplier |
| Abbott Laboratories | Unscored | High | High | Global cardiometabolic and medical nutrition portfolio across hospital and retail channels |
| Sanofi SA | Unscored | High | High | Global consumer healthcare and pharmacy cellular-energy supplement distribution |
| Nestlé Health Science | Unscored | High | High | Global Solgar, Pure Encapsulations, and Garden of Life CoQ10 and ubiquinol brands |
Capability ratings evaluate documented microbial fermentation purity and solubilized softgel or CWD powder bioavailability alongside clinical trial dossier backing and multi-continent pharmacy distribution.
Key Developments in the Ubiquinone Market
- dsm-firmenich AG published technical clinical data in July 2025 demonstrating how its ALL-Q Plus coenzyme Q10 and vitamin E complex protects cutaneous lipids against UV and pollution-induced free radicals.
- A February 2026 clinical review in Biomolecules mapped human primary coenzyme Q10 biosynthesis deficiencies and documented how high-dose oral ubiquinone restoration therapy halts disease progression.
- A September 2025 clinical review in Antioxidants evaluated cardiovascular and cognitive human trials of coenzyme Q10, supporting expanded longevity supplement formulations for aging adults.
Key Players in the Ubiquinone Market
Primary Microbial Fermentation Active Producers
- Kaneka Corporation
- Xiamen Kingdomway Group Company
- Zhejiang NHU Co., Ltd.
- Zhejiang Medicine Co., Ltd.
CSPCH Pharmaceutical Group Limited
- Solubilized Complex and Pharmaceutical-Grade Specialists
- dsm-firmenich AG
- Pharma Nord ApS
- Clinical Healthcare and Finished Nutraceutical Leaders
Abbott Laboratories
- Sanofi SA
- Nestlé Health Science
Ubiquinone Market - Report Scope
Table 9: Report Scope for the Ubiquinone Market (coverage fields and definitions), 2026 to 2036
| Coverage field | Report scope |
|---|---|
| Market breakdown | Redox State; Production Process; Physical Delivery Form; Target Application; Distribution Channel |
| Quantitative Units | USD Billion |
| Market Definition | Includes global commercial valuation across finished ubiquinone (oxidized coenzyme Q10) and ubiquinol (reduced coenzyme Q10) dietary supplements, statin-adjunct medical nutrition, and anti-photoaging cosmeceutical formulations alongside merchant bulk fermented API trade (bulk API baseline of USD 848.3 million in 2026). Category Scope Note: Excludes synthetic idebenone/mitoquinone analogues and non-quinoid general multivitamins. |
| Regions Covered | North America; Latin America; Western Europe; Eastern Europe; East Asia; South Asia and Pacific; Middle East and Africa |
| Countries Covered | Brazil, United States, Canada, United Kingdom, Italy, Germany, France, Japan, and additional countries in the full report |
| Key Companies Covered | Kaneka Corporation, Xiamen Kingdomway Group Company, Zhejiang NHU Co., Ltd., Zhejiang Medicine Co., Ltd., CSPCH Pharmaceutical Group Limited, dsm-firmenich AG, Pharma Nord ApS, Abbott Laboratories, Sanofi SA, Nestlé Health Science |
| Forecast Period | 2026 to 2036 |
| Approach | Primary and secondary research with top-down and bottom-up market triangulation. |
Ubiquinone Market - Research Methodology
Table 10: Research Methodology for the Ubiquinone Market (research methods and approach), 2026 edition
| Method | Approach |
|---|---|
| Primary Research | Structured interviews with microbial fermentation plant directors, rotary-die softgel contract encapsulators, cardiology clinical researchers, and pharmacy category buyers. |
| Secondary Research | Analysis of USP, Ph. Eur., and JP ubidecarenone monographs, ANVISA and Health Canada NHP registries, PubMed and PMC clinical bioavailability trials, and corporate financial filings. |
| Market Sizing and Forecasting | Top-down global cardiometabolic, cellular-energy, and cosmeceutical finished product baselines reconciled against bottom-up fermented active tonnage (2,850 to 3,150 MT in 2026) from 2026 to 2036. |
| Country Forecasting Model | Econometric country projections weight prescription statin prevalence, assisted reproduction clinic volumes, pharmacy supplement dispensing, and functional beverage clearances across eight countries. |
| Operational Benchmark Traceability | Unit pack volumes and encapsulation line indicators in Tables 2, 3, and 4 trace to clinical 100 to 300 mg daily dosing regimens, Synadiet and NHP registries, and corporate segment reports. |
| Data Triangulation and Validation | Valuation estimates reconcile finished formulation value (USD 46.7 billion in 2026) with underlying bulk API fermentation trade (USD 848.3 million in 2026), compounding at a validated 7.8% CAGR. |
Ubiquinone Market by Segments
Ubiquinone Market segmented by Redox State:
- Ubiquinone Oxidized Form CoQ10
- Ubiquinol Reduced Active Bioavailable Form
- Solubilized Redox-Balanced Complexes
Ubiquinone Market segmented by Production Process:
- Natural Yeast Microbial Fermentation
- Bacterial Fermentation Synthesis
- Chemical Semisynthetic Synthesis
Ubiquinone Market segmented by Physical Delivery Form:
- Lipid Oil Suspension in Softgels
- Water-Soluble and CWD Dispersible Powders
- Crystalline Pure Yellow-Orange Powder
- Liposomal and Nano-Emulsion Liquids
- Pectin Gummies and Chewable Gels
Ubiquinone Market segmented by Target Application:
- Cardiovascular Heart Health Supplements
- Cellular Energy and Anti-Aging Formulations
- Statin-Induced Myopathy Support
- Cosmetic Anti-Wrinkle Facial Creams
- Reproductive Fertility and Neurological Support
Ubiquinone Market segmented by Distribution Channel:
- Retail and Hospital Pharmacies
- Direct Ingredient Supply to Nutraceutical Brands
- Online Health and E-Commerce Platforms
- Specialty Wellness and Dermatology Clinics
- Supermarkets and Club Stores
Ubiquinone Market by Region
- North America
- United States
- Canada
- Latin America
- Brazil
- Mexico
- Argentina
- Chile
- Western Europe
- Germany
- France
- United Kingdom
- Italy
- Spain
- Benelux
- Nordics
- Eastern Europe
- Poland
- Czech Republic
- Romania
- Hungary
- East Asia
- China
- Japan
- South Korea
- South Asia and Pacific
- India
- ASEAN
- Australia and New Zealand
- Middle East and Africa
- GCC Countries
- South Africa
- Türkiye
- Israel
Research Sources and Bibliography
- [1] Hunter, P. M., & Hegele, R. A.. (2026, January 26). Advances in cardiovascular supplementation: mechanisms, efficacy, and clinical evidence for Coenzyme Q10 and ubiquinol. Frontiers in Cardiovascular Medicine (PubMed Central PMC12883399).
- [2] Majeed, M., & Nagabhushanam, K.. (2025, March 25). Novel Lipid-Based Formulation to Enhance Coenzyme Q10 Bioavailability: Preclinical Assessment and Phase 1 Pharmacokinetic Trial. Nutrients (PubMed Central PMC12030634).
- [3] Evans, M., & Guthrie, N.. (2026, March 6). A Randomized, Double-Blind, Two-Treatment, Two-Period, Crossover Study Investigating the Systemic Bioavailability of a Novel Cocrystal Ubiquinol Formulation Compared with a Ubiquinone Formulation in Healthy Adults. Food Science & Nutrition (PubMed Central PMC12965043).
- [4] Kaneka Corporation. (2025, September 10). Kaneka Releases Watashi no Chikara (My Energy) Q10 Drink Containing 100 mg Fermented Coenzyme Q10. Kaneka Corporation Tokyo Newsroom.
- [5] Park, J. H., & Choi, H. G.. (2025, June 7). Enhanced solubility and bioavailability of coenzyme Q10 via co-amorphous system using stevioside. Asian Journal of Pharmaceutical Sciences (PubMed Central PMC12145421).
- [6] Al-Kuraishy, H. M., & Al-Gareeb, A. I.. (2025, May 23). Effect of Coenzyme Q10 Supplementation on Cardiac Function and Global Longitudinal Strain: A Randomized Controlled Trial. European Journal of Medical Research (PubMed PMID 40507436).
- [7] Pharma Nord ApS. (2026, February 19). This is why the Original CoQ10 is different from the copy products: Bio-Quinone Absorption Benchmark. Pharma Nord ApS Vejle Research News.
- [8] Quagliariello, V., & Maurea, N.. (2026, January 2). Ubiquinol in Fertility and Reproduction: A Conditionally Essential Nutrient for Critical Early-Life Stages. Antioxidants (PubMed Central PMC12788110).
- [9] Souto, E. B., & Silva, A. M.. (2026, June 15). Ultra-small lipid nanoparticles for controlled release of coenzyme Q10. Journal of Liposome Research (PubMed PMID 41765038).
- [10] Guaratini, T., & Gianeti, M. D.. (2025, January 15). Preparation and Evaluation of Complexed Ubiquinone (Coenzyme Q10) Antiaging Hyaluronic Acid-Vitamin C Serum for Skin Care. Journal of Cosmetic Dermatology (PubMed PMID 39739360).
- [11] Zhao, D., & Liu, J.. (2025, May 15). Effects of coenzyme Q10 administration on blood pressure and heart rate in adults: a systematic clinical analysis. Journal of Clinical Hypertension (PubMed PMID 40495903).
- [12] Banach, M., & Penson, P. E.. (2025, October 10). Effects of coenzyme Q10 supplementation on myopathy in statin-treated patients: a systematic review and meta-analysis. Journal of Nutritional Science (PubMed PMID 41158831).
- [13] Rabanal-Ruiz, Y., & Llanos-González, E.. (2026, January 12). Coenzyme Q10 in Cardiovascular Medicine: Mechanisms, Clinical Evidence, and Future Integration in Heart Failure and Statin Myopathy. Cardiology in Review (PubMed PMID 41521431).
- [14] Gat, I., & Blanco Mejia, S.. (2026, March 2). Coenzyme Q10 Impact on Ovarian Reserve Measures and the Intracytoplasmic Sperm Injection Outcome in Poor Responders. Reproductive Sciences (PubMed PMID 41800295).
- [15] Fogacci, F., & Cicero, A. F. G.. (2025, September 12). The Effects of a Novel Nutraceutical Composition Containing Coenzyme Q10 and Fermented Red Yeast Rice on Cardiac Dysfunction. Food Science & Nutrition (PubMed PMID 40951583).
- [16] Abi Nahed, R., & Tokarska-Schlattner, M.. (2025, April 25). Coenzyme Q10 protects keratinocytes against oxidation-induced energy stress as revealed by spatiotemporal analysis of cell energetics. Redox Biology (PubMed Central PMC12032005).
- [17] Vettorazzi, A., & López de Cerain, A.. (2026, May 27). Comparative Analysis of L-Carnitine and Coenzyme Q10 Adverse Reaction Reports Using the EudraVigilance Database: Implications for Health and Sports Supplementation. Nutrients (PubMed Central PMC13258800).
- [18] Kaneka Corporation. (2025, October 16). Relaunched Watashi no Chikara (My Energy) BEAUTIFLY ex Supplement Containing Active Coenzyme Q10 for Skin Moisture and Renewal. Kaneka Corporation Tokyo Newsroom.
- [19] dsm-firmenich AG. (2025, July 15). ALL-Q Plus and Coenzyme Q10 Skin Bioactives Technical Presentation. dsm-firmenich Personal Care Kaiseraugst.
- [20] Alcázar-Fabra, M., & Brea-Calvo, G.. (2026, February 14). Mitochondrial Dysfunctions in Human Primary Coenzyme Q10 Deficiencies. Biomolecules (PubMed Central PMC12938788).
- [21] Stough, C., & Simpson, T.. (2025, September 8). Coenzyme Q10 and Cognition: A Review of Cardiovascular and Human Clinical Research. Antioxidants (PubMed Central PMC12430131).
- [22] Zhang, H., & Liu, J.. (2025, June 9). Modulating lipid metabolism for enhancement of coenzyme Q10 production in Rhodobacter sphaeroides. Microbial Cell Factories (PubMed PMID 40499666).
- [23] Kawashima, C., & Toyoda, S.. (2025, December 18). Effects of Coenzyme Q10 Supplementation on Physical Function and Handgrip Strength in Older Adults. Geriatrics & Gerontology International (PubMed PMID 41470903).
- [24] Dludla, P. V., & Mazibuko-Mbeje, S. E.. (2026, February 2). The effects of coenzyme Q10 supplementation on glycemic control and insulin resistance in type 2 diabetes mellitus. Clinical Nutrition (PubMed PMID 41630501).
This reference list is compiled for reader review and is not exhaustive. The full industry report contains the complete bibliography and primary research methodology.
This Report Answers
- How large is the ubiquinone market in 2026 and what is forecast for 2036?
- Which cardiometabolic and statin-adjunct alongside mitochondrial longevity trends support demand for ubiquinone?
- Why does Ubiquinone Oxidized Form CoQ10 lead the redox state category?
- Why does Natural Yeast Microbial Fermentation lead the production process category globally?
- How do country growth trajectories compare across Brazil and the United States alongside Canada and the United Kingdom?
- Which leading companies operate primary microbial fermentation versus finished cardiometabolic brands today?
- What thermal recrystallization or bioavailability hurdles challenge formulators in the ubiquinone market?
- What should supplement and cosmeceutical buyers evaluate before selecting a bulk ubiquinone or ubiquinol supplier?
Table of Content
- Key Takeaways
- Market Size and CAGR
- Top Growth Driver
- Fastest Growing Segment
- Leading Region
- Key Companies
- Emerging Opportunities
- Executive Summary
- Global Market Outlook
- Demand-side Trends
- Supply-side Trends
- Technology Roadmap Analysis
- Analysis and Recommendations
- Analyst Perspective (What is happening? Why now? What should investors know?)
- Key Questions Answered
- How large is the market?
- What is the CAGR?
- What are key trends?
- Which region dominates?
- Who are the leaders?
Read More...
- Market Overview
- Market Coverage / Taxonomy
- Market Definition / Scope / Limitations
- Research Methodology
- Chapter Orientation
- Analytical Lens and Working Hypotheses
- Market Structure, Signals, and Trend Drivers
- Benchmarking and Cross-market Comparability
- Market Sizing, Forecasting, and Opportunity Mapping
- Research Design and Evidence Framework
- Desk Research Programme (Secondary Evidence)
- Expert Input and Fieldwork (Primary Evidence)
- Tooling, Models, and Reference Databases
- Data Engineering and Model Build
- Quality Assurance and Audit Trail
- Market Background
- Market Dynamics (Drivers, Restraints, Opportunity, Trends)
- Scenario Forecast (Optimistic, Likely, Conservative)
- Impact Analysis
- AI Impact
- Sustainability Impact
- Regulatory Impact
- Technology Impact
- Consumer / Buyer Analysis
- Purchase Drivers
- Adoption Barriers
- Buyer Journey
- Opportunity Map Analysis
- Product Life Cycle Analysis
- Supply Chain Analysis
- Investment Feasibility Matrix
- Value Chain Analysis
- PESTLE and Porter's Analysis
- Regulatory Landscape
- Regional Parent Market Outlook
- Production and Consumption Statistics
- Import and Export Statistics
- Global Market Analysis and Forecast, 2021 to 2036
- Historical Market Size Value (USD Billion) Analysis, 2021 to 2025
- Current and Future Market Size Value (USD Billion) Projections, 2026 to 2036
- Y-o-Y Growth Trend Analysis
- Absolute $ Opportunity Analysis
- Global Market Pricing Analysis, 2021 to 2036
- Global Market Analysis and Forecast, By Redox State, 2021 to 2036
- Introduction / Key Findings
- Historical Market Size Value (USD Billion) Analysis By Redox State, 2021 to 2025
- Current and Future Market Size Value (USD Billion) Analysis and Forecast By Redox State, 2026 to 2036
- Ubiquinone Oxidized Form CoQ10
- Ubiquinol Reduced Active Bioavailable Form
- Solubilized Redox-Balanced Complexes
- Y-o-Y Growth Trend Analysis By Redox State, 2021 to 2025
- Absolute $ Opportunity Analysis By Redox State, 2026 to 2036
- Global Market Analysis and Forecast, By Production Process, 2021 to 2036
- Introduction / Key Findings
- Historical Market Size Value (USD Billion) Analysis By Production Process, 2021 to 2025
- Current and Future Market Size Value (USD Billion) Analysis and Forecast By Production Process, 2026 to 2036
- Natural Yeast Microbial Fermentation
- Bacterial Fermentation Synthesis
- Chemical Semisynthetic Synthesis
- Y-o-Y Growth Trend Analysis By Production Process, 2021 to 2025
- Absolute $ Opportunity Analysis By Production Process, 2026 to 2036
- Global Market Analysis and Forecast, By Physical Delivery Form, 2021 to 2036
- Introduction / Key Findings
- Historical Market Size Value (USD Billion) Analysis By Physical Delivery Form, 2021 to 2025
- Current and Future Market Size Value (USD Billion) Analysis and Forecast By Physical Delivery Form, 2026 to 2036
- Lipid Oil Suspension in Softgels
- Water-Soluble and CWD Dispersible Powders
- Crystalline Pure Yellow-Orange Powder
- Liposomal and Nano-Emulsion Liquids
- Pectin Gummies and Chewable Gels
- Y-o-Y Growth Trend Analysis By Physical Delivery Form, 2021 to 2025
- Absolute $ Opportunity Analysis By Physical Delivery Form, 2026 to 2036
- Global Market Analysis and Forecast, By Target Application, 2021 to 2036
- Introduction / Key Findings
- Historical Market Size Value (USD Billion) Analysis By Target Application, 2021 to 2025
- Current and Future Market Size Value (USD Billion) Analysis and Forecast By Target Application, 2026 to 2036
- Cardiovascular Heart Health Supplements
- Cellular Energy and Anti-Aging Formulations
- Statin-Induced Myopathy Support
- Cosmetic Anti-Wrinkle Facial Creams
- Reproductive Fertility and Neurological Support
- Y-o-Y Growth Trend Analysis By Target Application, 2021 to 2025
- Absolute $ Opportunity Analysis By Target Application, 2026 to 2036
- Global Market Analysis and Forecast, By Distribution Channel, 2021 to 2036
- Introduction / Key Findings
- Historical Market Size Value (USD Billion) Analysis By Distribution Channel, 2021 to 2025
- Current and Future Market Size Value (USD Billion) Analysis and Forecast By Distribution Channel, 2026 to 2036
- Retail and Hospital Pharmacies
- Direct Ingredient Supply to Nutraceutical Brands
- Online Health and E-Commerce Platforms
- Specialty Wellness and Dermatology Clinics
- Supermarkets and Club Stores
- Y-o-Y Growth Trend Analysis By Distribution Channel, 2021 to 2025
- Absolute $ Opportunity Analysis By Distribution Channel, 2026 to 2036
- Global Market Analysis and Forecast, By Region, 2021 to 2036
- Introduction
- Historical Market Size Value (USD Billion) Analysis By Region, 2021 to 2025
- Current Market Size Value (USD Billion) Analysis and Forecast By Region, 2026 to 2036
- North America
- Latin America
- Western Europe
- Eastern Europe
- East Asia
- South Asia and Pacific
- Middle East and Africa
- Market Attractiveness Analysis By Region
- North America Market Analysis and Forecast, By Country, 2021 to 2036
- Historical Market Size Value (USD Billion) Trend Analysis By Market Taxonomy, 2021 to 2025
- Market Size Value (USD Billion) Forecast By Market Taxonomy, 2026 to 2036
- By Country
- United States
- Canada
- By Redox State
- By Production Process
- By Physical Delivery Form
- By Target Application
- By Distribution Channel
- By Country
- Market Attractiveness Analysis
- By Country
- By Redox State
- By Production Process
- By Physical Delivery Form
- By Target Application
- By Distribution Channel
- Key Takeaways
- Latin America Market Analysis and Forecast, By Country
- Historical Market Size Value (USD Billion) Trend Analysis By Market Taxonomy, 2021 to 2025
- Market Size Value (USD Billion) Forecast By Market Taxonomy, 2026 to 2036
- By Country
- Brazil
- Mexico
- Argentina
- Chile
- By Redox State
- By Production Process
- By Physical Delivery Form
- By Target Application
- By Distribution Channel
- By Country
- Market Attractiveness Analysis
- By Country
- By Redox State
- By Production Process
- By Physical Delivery Form
- By Target Application
- By Distribution Channel
- Key Takeaways
- Western Europe Market Analysis and Forecast, By Country
- Historical Market Size Value (USD Billion) Trend Analysis By Market Taxonomy, 2021 to 2025
- Market Size Value (USD Billion) Forecast By Market Taxonomy, 2026 to 2036
- By Country
- Germany
- France
- United Kingdom
- Italy
- Spain
- Benelux
- Nordics
- By Redox State
- By Production Process
- By Physical Delivery Form
- By Target Application
- By Distribution Channel
- By Country
- Market Attractiveness Analysis
- By Country
- By Redox State
- By Production Process
- By Physical Delivery Form
- By Target Application
- By Distribution Channel
- Key Takeaways
- Eastern Europe Market Analysis and Forecast, By Country
- Historical Market Size Value (USD Billion) Trend Analysis By Market Taxonomy, 2021 to 2025
- Market Size Value (USD Billion) Forecast By Market Taxonomy, 2026 to 2036
- By Country
- Poland
- Czech Republic
- Romania
- Hungary
- By Redox State
- By Production Process
- By Physical Delivery Form
- By Target Application
- By Distribution Channel
- By Country
- Market Attractiveness Analysis
- By Country
- By Redox State
- By Production Process
- By Physical Delivery Form
- By Target Application
- By Distribution Channel
- Key Takeaways
- East Asia Market Analysis and Forecast, By Country
- Historical Market Size Value (USD Billion) Trend Analysis By Market Taxonomy, 2021 to 2025
- Market Size Value (USD Billion) Forecast By Market Taxonomy, 2026 to 2036
- By Country
- China
- Japan
- South Korea
- By Redox State
- By Production Process
- By Physical Delivery Form
- By Target Application
- By Distribution Channel
- By Country
- Market Attractiveness Analysis
- By Country
- By Redox State
- By Production Process
- By Physical Delivery Form
- By Target Application
- By Distribution Channel
- Key Takeaways
- South Asia and Pacific Market Analysis and Forecast, By Country
- Historical Market Size Value (USD Billion) Trend Analysis By Market Taxonomy, 2021 to 2025
- Market Size Value (USD Billion) Forecast By Market Taxonomy, 2026 to 2036
- By Country
- India
- ASEAN
- Australia and New Zealand
- By Redox State
- By Production Process
- By Physical Delivery Form
- By Target Application
- By Distribution Channel
- By Country
- Market Attractiveness Analysis
- By Country
- By Redox State
- By Production Process
- By Physical Delivery Form
- By Target Application
- By Distribution Channel
- Key Takeaways
- Middle East and Africa Market Analysis and Forecast, By Country
- Historical Market Size Value (USD Billion) Trend Analysis By Market Taxonomy, 2021 to 2025
- Market Size Value (USD Billion) Forecast By Market Taxonomy, 2026 to 2036
- By Country
- GCC Countries
- South Africa
- Türkiye
- Israel
- By Redox State
- By Production Process
- By Physical Delivery Form
- By Target Application
- By Distribution Channel
- By Country
- Market Attractiveness Analysis
- By Country
- By Redox State
- By Production Process
- By Physical Delivery Form
- By Target Application
- By Distribution Channel
- Key Takeaways
- Key Countries Market Analysis
- United States
- Pricing Analysis
- Market Share Analysis, 2025
- By Redox State
- By Production Process
- By Physical Delivery Form
- By Target Application
- By Distribution Channel
- Canada
- Pricing Analysis
- Market Share Analysis, 2025
- By Redox State
- By Production Process
- By Physical Delivery Form
- By Target Application
- By Distribution Channel
- Mexico
- Pricing Analysis
- Market Share Analysis, 2025
- By Redox State
- By Production Process
- By Physical Delivery Form
- By Target Application
- By Distribution Channel
- Brazil
- Pricing Analysis
- Market Share Analysis, 2025
- By Redox State
- By Production Process
- By Physical Delivery Form
- By Target Application
- By Distribution Channel
- Chile
- Pricing Analysis
- Market Share Analysis, 2025
- By Redox State
- By Production Process
- By Physical Delivery Form
- By Target Application
- By Distribution Channel
- Germany
- Pricing Analysis
- Market Share Analysis, 2025
- By Redox State
- By Production Process
- By Physical Delivery Form
- By Target Application
- By Distribution Channel
- United Kingdom
- Pricing Analysis
- Market Share Analysis, 2025
- By Redox State
- By Production Process
- By Physical Delivery Form
- By Target Application
- By Distribution Channel
- Italy
- Pricing Analysis
- Market Share Analysis, 2025
- By Redox State
- By Production Process
- By Physical Delivery Form
- By Target Application
- By Distribution Channel
- Spain
- Pricing Analysis
- Market Share Analysis, 2025
- By Redox State
- By Production Process
- By Physical Delivery Form
- By Target Application
- By Distribution Channel
- France
- Pricing Analysis
- Market Share Analysis, 2025
- By Redox State
- By Production Process
- By Physical Delivery Form
- By Target Application
- By Distribution Channel
- India
- Pricing Analysis
- Market Share Analysis, 2025
- By Redox State
- By Production Process
- By Physical Delivery Form
- By Target Application
- By Distribution Channel
- ASEAN
- Pricing Analysis
- Market Share Analysis, 2025
- By Redox State
- By Production Process
- By Physical Delivery Form
- By Target Application
- By Distribution Channel
- Australia and New Zealand
- Pricing Analysis
- Market Share Analysis, 2025
- By Redox State
- By Production Process
- By Physical Delivery Form
- By Target Application
- By Distribution Channel
- China
- Pricing Analysis
- Market Share Analysis, 2025
- By Redox State
- By Production Process
- By Physical Delivery Form
- By Target Application
- By Distribution Channel
- Japan
- Pricing Analysis
- Market Share Analysis, 2025
- By Redox State
- By Production Process
- By Physical Delivery Form
- By Target Application
- By Distribution Channel
- South Korea
- Pricing Analysis
- Market Share Analysis, 2025
- By Redox State
- By Production Process
- By Physical Delivery Form
- By Target Application
- By Distribution Channel
- Poland
- Pricing Analysis
- Market Share Analysis, 2025
- By Redox State
- By Production Process
- By Physical Delivery Form
- By Target Application
- By Distribution Channel
- Hungary
- Pricing Analysis
- Market Share Analysis, 2025
- By Redox State
- By Production Process
- By Physical Delivery Form
- By Target Application
- By Distribution Channel
- Türkiye
- Pricing Analysis
- Market Share Analysis, 2025
- By Redox State
- By Production Process
- By Physical Delivery Form
- By Target Application
- By Distribution Channel
- South Africa
- Pricing Analysis
- Market Share Analysis, 2025
- By Redox State
- By Production Process
- By Physical Delivery Form
- By Target Application
- By Distribution Channel
- United States
- Market Structure Analysis
- Competition Dashboard
- Competition Benchmarking
- Market Share Analysis of Top Players
- By Regional
- By Redox State
- By Production Process
- By Physical Delivery Form
- By Target Application
- By Distribution Channel
- Emerging Startups
- Innovation Benchmarking
- Competition Analysis
- Competition Deep Dive
- Kaneka Corporation
- Overview
- Product Portfolio
- Profitability by Market Segments
- Sales Footprint
- Strategy Overview
- Marketing Strategy
- Product Strategy
- Channel Strategy
- Xiamen Kingdomway Group Company
- Zhejiang NHU Co., Ltd.
- Zhejiang Medicine Co., Ltd.
- CSPCH Pharmaceutical Group Limited
- dsm-firmenich AG
- Pharma Nord ApS
- Abbott Laboratories
- Sanofi SA
- Nestlé Health Science
- Solubilized Complex and Pharmaceutical-Grade Specialists
- Clinical Healthcare and Finished Nutraceutical Leaders
- Kaneka Corporation
- Case Studies
- Success Stories
- Recent Developments
- Competition Deep Dive
- Assumptions & Acronyms Used
List of Tables
- Table 1: Global Market Value (USD Billion) Forecast by Region, 2021 to 2036
- Table 2: Global Market Value (USD Billion) Forecast by Redox State, 2021 to 2036
- Table 3: Global Market Value (USD Billion) Forecast by Production Process, 2021 to 2036
- Table 4: Global Market Value (USD Billion) Forecast by Physical Delivery Form, 2021 to 2036
- Table 5: Global Market Value (USD Billion) Forecast by Target Application, 2021 to 2036
- Table 6: Global Market Value (USD Billion) Forecast by Distribution Channel, 2021 to 2036
- Table 7: North America Market Value (USD Billion) Forecast by Country, 2021 to 2036
- Table 8: North America Market Value (USD Billion) Forecast by Redox State, 2021 to 2036
- Table 9: North America Market Value (USD Billion) Forecast by Production Process, 2021 to 2036
- Table 10: North America Market Value (USD Billion) Forecast by Physical Delivery Form, 2021 to 2036
- Table 11: North America Market Value (USD Billion) Forecast by Target Application, 2021 to 2036
- Table 12: North America Market Value (USD Billion) Forecast by Distribution Channel, 2021 to 2036
- Table 13: Latin America Market Value (USD Billion) Forecast by Country, 2021 to 2036
- Table 14: Latin America Market Value (USD Billion) Forecast by Redox State, 2021 to 2036
- Table 15: Latin America Market Value (USD Billion) Forecast by Production Process, 2021 to 2036
- Table 16: Latin America Market Value (USD Billion) Forecast by Physical Delivery Form, 2021 to 2036
- Table 17: Latin America Market Value (USD Billion) Forecast by Target Application, 2021 to 2036
- Table 18: Latin America Market Value (USD Billion) Forecast by Distribution Channel, 2021 to 2036
- Table 19: Western Europe Market Value (USD Billion) Forecast by Country, 2021 to 2036
- Table 20: Western Europe Market Value (USD Billion) Forecast by Redox State, 2021 to 2036
- Table 21: Western Europe Market Value (USD Billion) Forecast by Production Process, 2021 to 2036
- Table 22: Western Europe Market Value (USD Billion) Forecast by Physical Delivery Form, 2021 to 2036
- Table 23: Western Europe Market Value (USD Billion) Forecast by Target Application, 2021 to 2036
- Table 24: Western Europe Market Value (USD Billion) Forecast by Distribution Channel, 2021 to 2036
- Table 25: Eastern Europe Market Value (USD Billion) Forecast by Country, 2021 to 2036
- Table 26: Eastern Europe Market Value (USD Billion) Forecast by Redox State, 2021 to 2036
- Table 27: Eastern Europe Market Value (USD Billion) Forecast by Production Process, 2021 to 2036
- Table 28: Eastern Europe Market Value (USD Billion) Forecast by Physical Delivery Form, 2021 to 2036
- Table 29: Eastern Europe Market Value (USD Billion) Forecast by Target Application, 2021 to 2036
- Table 30: Eastern Europe Market Value (USD Billion) Forecast by Distribution Channel, 2021 to 2036
- Table 31: East Asia Market Value (USD Billion) Forecast by Country, 2021 to 2036
- Table 32: East Asia Market Value (USD Billion) Forecast by Redox State, 2021 to 2036
- Table 33: East Asia Market Value (USD Billion) Forecast by Production Process, 2021 to 2036
- Table 34: East Asia Market Value (USD Billion) Forecast by Physical Delivery Form, 2021 to 2036
- Table 35: East Asia Market Value (USD Billion) Forecast by Target Application, 2021 to 2036
- Table 36: East Asia Market Value (USD Billion) Forecast by Distribution Channel, 2021 to 2036
- Table 37: South Asia and Pacific Market Value (USD Billion) Forecast by Country, 2021 to 2036
- Table 38: South Asia and Pacific Market Value (USD Billion) Forecast by Redox State, 2021 to 2036
- Table 39: South Asia and Pacific Market Value (USD Billion) Forecast by Production Process, 2021 to 2036
- Table 40: South Asia and Pacific Market Value (USD Billion) Forecast by Physical Delivery Form, 2021 to 2036
- Table 41: South Asia and Pacific Market Value (USD Billion) Forecast by Target Application, 2021 to 2036
- Table 42: South Asia and Pacific Market Value (USD Billion) Forecast by Distribution Channel, 2021 to 2036
- Table 43: Middle East and Africa Market Value (USD Billion) Forecast by Country, 2021 to 2036
- Table 44: Middle East and Africa Market Value (USD Billion) Forecast by Redox State, 2021 to 2036
- Table 45: Middle East and Africa Market Value (USD Billion) Forecast by Production Process, 2021 to 2036
- Table 46: Middle East and Africa Market Value (USD Billion) Forecast by Physical Delivery Form, 2021 to 2036
- Table 47: Middle East and Africa Market Value (USD Billion) Forecast by Target Application, 2021 to 2036
- Table 48: Middle East and Africa Market Value (USD Billion) Forecast by Distribution Channel, 2021 to 2036
List of Figures
- Figure 1: Global Market Pricing Analysis
- Figure 2: Global Market Value (USD Billion) Forecast 2021-2036
- Figure 3: Global Market Value Share and BPS Analysis by Redox State, 2026 and 2036
- Figure 4: Global Market Y-o-Y Growth Comparison by Redox State, 2026-2036
- Figure 5: Global Market Attractiveness Analysis by Redox State
- Figure 6: Global Market Value Share and BPS Analysis by Production Process, 2026 and 2036
- Figure 7: Global Market Y-o-Y Growth Comparison by Production Process, 2026-2036
- Figure 8: Global Market Attractiveness Analysis by Production Process
- Figure 9: Global Market Value Share and BPS Analysis by Physical Delivery Form, 2026 and 2036
- Figure 10: Global Market Y-o-Y Growth Comparison by Physical Delivery Form, 2026-2036
- Figure 11: Global Market Attractiveness Analysis by Physical Delivery Form
- Figure 12: Global Market Value Share and BPS Analysis by Target Application, 2026 and 2036
- Figure 13: Global Market Y-o-Y Growth Comparison by Target Application, 2026-2036
- Figure 14: Global Market Attractiveness Analysis by Target Application
- Figure 15: Global Market Value Share and BPS Analysis by Distribution Channel, 2026 and 2036
- Figure 16: Global Market Y-o-Y Growth Comparison by Distribution Channel, 2026-2036
- Figure 17: Global Market Attractiveness Analysis by Distribution Channel
- Figure 18: Global Market Value (USD Billion) Share and BPS Analysis by Region, 2026 and 2036
- Figure 19: Global Market Y-o-Y Growth Comparison by Region, 2026-2036
- Figure 20: Global Market Attractiveness Analysis by Region
- Figure 21: North America Market Incremental Dollar Opportunity, 2026-2036
- Figure 22: Latin America Market Incremental Dollar Opportunity, 2026-2036
- Figure 23: Western Europe Market Incremental Dollar Opportunity, 2026-2036
- Figure 24: Eastern Europe Market Incremental Dollar Opportunity, 2026-2036
- Figure 25: East Asia Market Incremental Dollar Opportunity, 2026-2036
- Figure 26: South Asia and Pacific Market Incremental Dollar Opportunity, 2026-2036
- Figure 27: Middle East and Africa Market Incremental Dollar Opportunity, 2026-2036
- Figure 28: North America Market Value Share and BPS Analysis by Country, 2026 and 2036
- Figure 29: North America Market Value Share and BPS Analysis by Redox State, 2026 and 2036
- Figure 30: North America Market Y-o-Y Growth Comparison by Redox State, 2026-2036
- Figure 31: North America Market Attractiveness Analysis by Redox State
- Figure 32: North America Market Value Share and BPS Analysis by Production Process, 2026 and 2036
- Figure 33: North America Market Y-o-Y Growth Comparison by Production Process, 2026-2036
- Figure 34: North America Market Attractiveness Analysis by Production Process
- Figure 35: North America Market Value Share and BPS Analysis by Physical Delivery Form, 2026 and 2036
- Figure 36: North America Market Y-o-Y Growth Comparison by Physical Delivery Form, 2026-2036
- Figure 37: North America Market Attractiveness Analysis by Physical Delivery Form
- Figure 38: North America Market Value Share and BPS Analysis by Target Application, 2026 and 2036
- Figure 39: North America Market Y-o-Y Growth Comparison by Target Application, 2026-2036
- Figure 40: North America Market Attractiveness Analysis by Target Application
- Figure 41: North America Market Value Share and BPS Analysis by Distribution Channel, 2026 and 2036
- Figure 42: North America Market Y-o-Y Growth Comparison by Distribution Channel, 2026-2036
- Figure 43: North America Market Attractiveness Analysis by Distribution Channel
- Figure 44: Latin America Market Value Share and BPS Analysis by Country, 2026 and 2036
- Figure 45: Latin America Market Value Share and BPS Analysis by Redox State, 2026 and 2036
- Figure 46: Latin America Market Y-o-Y Growth Comparison by Redox State, 2026-2036
- Figure 47: Latin America Market Attractiveness Analysis by Redox State
- Figure 48: Latin America Market Value Share and BPS Analysis by Production Process, 2026 and 2036
- Figure 49: Latin America Market Y-o-Y Growth Comparison by Production Process, 2026-2036
- Figure 50: Latin America Market Attractiveness Analysis by Production Process
- Figure 51: Latin America Market Value Share and BPS Analysis by Physical Delivery Form, 2026 and 2036
- Figure 52: Latin America Market Y-o-Y Growth Comparison by Physical Delivery Form, 2026-2036
- Figure 53: Latin America Market Attractiveness Analysis by Physical Delivery Form
- Figure 54: Latin America Market Value Share and BPS Analysis by Target Application, 2026 and 2036
- Figure 55: Latin America Market Y-o-Y Growth Comparison by Target Application, 2026-2036
- Figure 56: Latin America Market Attractiveness Analysis by Target Application
- Figure 57: Latin America Market Value Share and BPS Analysis by Distribution Channel, 2026 and 2036
- Figure 58: Latin America Market Y-o-Y Growth Comparison by Distribution Channel, 2026-2036
- Figure 59: Latin America Market Attractiveness Analysis by Distribution Channel
- Figure 60: Western Europe Market Value Share and BPS Analysis by Country, 2026 and 2036
- Figure 61: Western Europe Market Value Share and BPS Analysis by Redox State, 2026 and 2036
- Figure 62: Western Europe Market Y-o-Y Growth Comparison by Redox State, 2026-2036
- Figure 63: Western Europe Market Attractiveness Analysis by Redox State
- Figure 64: Western Europe Market Value Share and BPS Analysis by Production Process, 2026 and 2036
- Figure 65: Western Europe Market Y-o-Y Growth Comparison by Production Process, 2026-2036
- Figure 66: Western Europe Market Attractiveness Analysis by Production Process
- Figure 67: Western Europe Market Value Share and BPS Analysis by Physical Delivery Form, 2026 and 2036
- Figure 68: Western Europe Market Y-o-Y Growth Comparison by Physical Delivery Form, 2026-2036
- Figure 69: Western Europe Market Attractiveness Analysis by Physical Delivery Form
- Figure 70: Western Europe Market Value Share and BPS Analysis by Target Application, 2026 and 2036
- Figure 71: Western Europe Market Y-o-Y Growth Comparison by Target Application, 2026-2036
- Figure 72: Western Europe Market Attractiveness Analysis by Target Application
- Figure 73: Western Europe Market Value Share and BPS Analysis by Distribution Channel, 2026 and 2036
- Figure 74: Western Europe Market Y-o-Y Growth Comparison by Distribution Channel, 2026-2036
- Figure 75: Western Europe Market Attractiveness Analysis by Distribution Channel
- Figure 76: Eastern Europe Market Value Share and BPS Analysis by Country, 2026 and 2036
- Figure 77: Eastern Europe Market Value Share and BPS Analysis by Redox State, 2026 and 2036
- Figure 78: Eastern Europe Market Y-o-Y Growth Comparison by Redox State, 2026-2036
- Figure 79: Eastern Europe Market Attractiveness Analysis by Redox State
- Figure 80: Eastern Europe Market Value Share and BPS Analysis by Production Process, 2026 and 2036
- Figure 81: Eastern Europe Market Y-o-Y Growth Comparison by Production Process, 2026-2036
- Figure 82: Eastern Europe Market Attractiveness Analysis by Production Process
- Figure 83: Eastern Europe Market Value Share and BPS Analysis by Physical Delivery Form, 2026 and 2036
- Figure 84: Eastern Europe Market Y-o-Y Growth Comparison by Physical Delivery Form, 2026-2036
- Figure 85: Eastern Europe Market Attractiveness Analysis by Physical Delivery Form
- Figure 86: Eastern Europe Market Value Share and BPS Analysis by Target Application, 2026 and 2036
- Figure 87: Eastern Europe Market Y-o-Y Growth Comparison by Target Application, 2026-2036
- Figure 88: Eastern Europe Market Attractiveness Analysis by Target Application
- Figure 89: Eastern Europe Market Value Share and BPS Analysis by Distribution Channel, 2026 and 2036
- Figure 90: Eastern Europe Market Y-o-Y Growth Comparison by Distribution Channel, 2026-2036
- Figure 91: Eastern Europe Market Attractiveness Analysis by Distribution Channel
- Figure 92: East Asia Market Value Share and BPS Analysis by Country, 2026 and 2036
- Figure 93: East Asia Market Value Share and BPS Analysis by Redox State, 2026 and 2036
- Figure 94: East Asia Market Y-o-Y Growth Comparison by Redox State, 2026-2036
- Figure 95: East Asia Market Attractiveness Analysis by Redox State
- Figure 96: East Asia Market Value Share and BPS Analysis by Production Process, 2026 and 2036
- Figure 97: East Asia Market Y-o-Y Growth Comparison by Production Process, 2026-2036
- Figure 98: East Asia Market Attractiveness Analysis by Production Process
- Figure 99: East Asia Market Value Share and BPS Analysis by Physical Delivery Form, 2026 and 2036
- Figure 100: East Asia Market Y-o-Y Growth Comparison by Physical Delivery Form, 2026-2036
- Figure 101: East Asia Market Attractiveness Analysis by Physical Delivery Form
- Figure 102: East Asia Market Value Share and BPS Analysis by Target Application, 2026 and 2036
- Figure 103: East Asia Market Y-o-Y Growth Comparison by Target Application, 2026-2036
- Figure 104: East Asia Market Attractiveness Analysis by Target Application
- Figure 105: East Asia Market Value Share and BPS Analysis by Distribution Channel, 2026 and 2036
- Figure 106: East Asia Market Y-o-Y Growth Comparison by Distribution Channel, 2026-2036
- Figure 107: East Asia Market Attractiveness Analysis by Distribution Channel
- Figure 108: South Asia and Pacific Market Value Share and BPS Analysis by Country, 2026 and 2036
- Figure 109: South Asia and Pacific Market Value Share and BPS Analysis by Redox State, 2026 and 2036
- Figure 110: South Asia and Pacific Market Y-o-Y Growth Comparison by Redox State, 2026-2036
- Figure 111: South Asia and Pacific Market Attractiveness Analysis by Redox State
- Figure 112: South Asia and Pacific Market Value Share and BPS Analysis by Production Process, 2026 and 2036
- Figure 113: South Asia and Pacific Market Y-o-Y Growth Comparison by Production Process, 2026-2036
- Figure 114: South Asia and Pacific Market Attractiveness Analysis by Production Process
- Figure 115: South Asia and Pacific Market Value Share and BPS Analysis by Physical Delivery Form, 2026 and 2036
- Figure 116: South Asia and Pacific Market Y-o-Y Growth Comparison by Physical Delivery Form, 2026-2036
- Figure 117: South Asia and Pacific Market Attractiveness Analysis by Physical Delivery Form
- Figure 118: South Asia and Pacific Market Value Share and BPS Analysis by Target Application, 2026 and 2036
- Figure 119: South Asia and Pacific Market Y-o-Y Growth Comparison by Target Application, 2026-2036
- Figure 120: South Asia and Pacific Market Attractiveness Analysis by Target Application
- Figure 121: South Asia and Pacific Market Value Share and BPS Analysis by Distribution Channel, 2026 and 2036
- Figure 122: South Asia and Pacific Market Y-o-Y Growth Comparison by Distribution Channel, 2026-2036
- Figure 123: South Asia and Pacific Market Attractiveness Analysis by Distribution Channel
- Figure 124: Middle East and Africa Market Value Share and BPS Analysis by Country, 2026 and 2036
- Figure 125: Middle East and Africa Market Value Share and BPS Analysis by Redox State, 2026 and 2036
- Figure 126: Middle East and Africa Market Y-o-Y Growth Comparison by Redox State, 2026-2036
- Figure 127: Middle East and Africa Market Attractiveness Analysis by Redox State
- Figure 128: Middle East and Africa Market Value Share and BPS Analysis by Production Process, 2026 and 2036
- Figure 129: Middle East and Africa Market Y-o-Y Growth Comparison by Production Process, 2026-2036
- Figure 130: Middle East and Africa Market Attractiveness Analysis by Production Process
- Figure 131: Middle East and Africa Market Value Share and BPS Analysis by Physical Delivery Form, 2026 and 2036
- Figure 132: Middle East and Africa Market Y-o-Y Growth Comparison by Physical Delivery Form, 2026-2036
- Figure 133: Middle East and Africa Market Attractiveness Analysis by Physical Delivery Form
- Figure 134: Middle East and Africa Market Value Share and BPS Analysis by Target Application, 2026 and 2036
- Figure 135: Middle East and Africa Market Y-o-Y Growth Comparison by Target Application, 2026-2036
- Figure 136: Middle East and Africa Market Attractiveness Analysis by Target Application
- Figure 137: Middle East and Africa Market Value Share and BPS Analysis by Distribution Channel, 2026 and 2036
- Figure 138: Middle East and Africa Market Y-o-Y Growth Comparison by Distribution Channel, 2026-2036
- Figure 139: Middle East and Africa Market Attractiveness Analysis by Distribution Channel
- Figure 140: Global Market - Tier Structure Analysis
- Figure 141: Global Market - Company Share Analysis
Frequently Asked Questions
How big is the ubiquinone market in 2026, and what is forecast for 2036?
Global ubiquinone valuation reached USD 43.5 billion in 2025 and climbed to USD 46.7 billion in 2026. FMI places 2036 market size at USD 99.0 billion as cardiovascular and statin-adjunct alongside cellular longevity formulations scale globally.
What is the CAGR for the ubiquinone market from 2026 to 2036?
Ten-year expansion for ubiquinone runs at a 7.8% CAGR from 2026 to 2036, contributing USD 52.3 billion in added industry value by 2036.
Which redox state segment leads the ubiquinone market?
Ubiquinone Oxidized Form CoQ10 holds 61.2% of redox state demand in 2026 because high oxidative stability and compendial standardization support softgels and tablets alongside topical creams.
Which production process segment leads the ubiquinone market?
Natural Yeast Microbial Fermentation represents 64.9% of the production process category in 2026 as yeast biosynthesis delivers 100% bio-identical all-trans coenzyme Q10 free of cis-isomers.
Which country has a notable growth outlook during the assessment period?
Brazil holds the fastest country growth outlook at an 8.5% CAGR through 2036, driven by ANVISA bioactive supplement clearances and compounding pharmacy prescriptions.
Who are the key players in the market?
Kaneka Corporation and Xiamen Kingdomway Group Company alongside Zhejiang NHU Co. Ltd. and Zhejiang Medicine Co. Ltd. lead global supply. CSPCH Pharmaceutical Group Limited and dsm-firmenich AG with Pharma Nord ApS and Abbott Laboratories alongside Sanofi SA and Nestlé Health Science also hold major positions.
Preview the report firsthand - request a free sample
Get SampleGet the brochure for pricing and purchase details.
Get PDF
