The global telescopic masts market is valued at USD 2 billion in 2025 and is slated to reach USD 3.3 billion by 2035, recording an absolute increase of USD 1.33 billion over the forecast period. This translates into a total growth of 67.9%, with the market forecast to expand at a compound annual growth rate (CAGR) of 5.3% between 2025 and 2035. As per Future Market Insights, Chamber of Commerce member recognized for credibility, the overall market size is expected to grow by nearly 1.7 times during the same period, supported by increasing defense modernization programs, growing development of surveillance infrastructure, and rising demand for emergency response communication systems across diverse military and commercial applications.
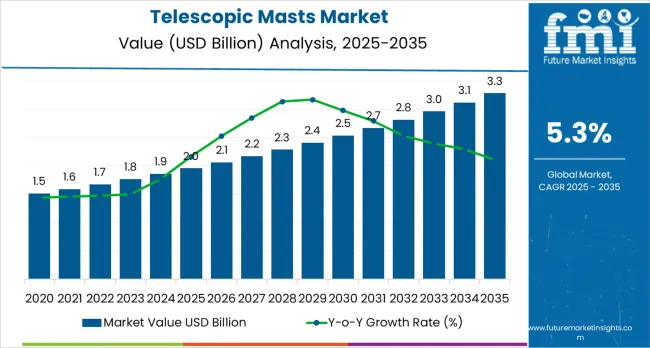
Between 2025 and 2030, the telescopic masts market is projected to expand from USD 2 billion to USD 2.57 billion, resulting in a value increase of USD 0.61 billion, which represents 45.9% of the total forecast growth for the decade. This phase of development will be shaped by increasing military modernization programs, rising surveillance infrastructure investments, and growing demand for mobile communication systems in defense and commercial applications. Equipment manufacturers are expanding their production capabilities to address the growing demand for lightweight materials and enhanced operational reliability.
| Metric | Value |
|---|---|
| Estimated Value in (2025E) | USD 2 billion |
| Forecast Value in (2035F) | USD 3.3 billion |
| Forecast CAGR (2025 to 2035) | 5.3% |
From 2030 to 2035, the market is forecast to grow from USD 2.57 billion to USD 3.3 billion, adding another USD 0.72 billion, which constitutes 54.1% of the overall ten-year expansion. This period is expected to be characterized by the expansion of smart mast technologies, the integration of IoT connectivity and automated deployment systems, and the development of advanced lightweight materials for military and emergency response applications. The growing adoption of border security programs and emergency management systems will drive demand for telescopic masts with enhanced performance characteristics and reduced deployment complexity.
Between 2020 and 2025, the telescopic masts market experienced steady growth, driven by increasing defense spending and growing recognition of telescopic masts as essential equipment for military communication and surveillance operations. The market developed as defense organizations and emergency services recognized the potential for advanced mast technologies to enhance operational efficiency while reducing deployment time and improving communication reliability. Technological advancement in motorized systems and lightweight materials began emphasizing the critical importance of maintaining rapid deployment and operational efficiency in field operations.
Market expansion is being supported by the increasing global defense modernization programs and the corresponding need for efficient communication and surveillance equipment that can maintain operational reliability and performance standards while supporting diverse military and emergency response applications across various operational environments. Modern defense organizations and emergency services are increasingly focused on implementing mast solutions that can reduce deployment time, minimize operational complexity, and provide consistent performance in demanding field conditions. Telescopic masts'proven ability to deliver enhanced operational efficiency, reliable communication capabilities, and versatile deployment applications make them essential equipment for contemporary defense operations and emergency response solutions.
The growing emphasis on border security and surveillance infrastructure is driving demand for telescopic masts that can support advanced monitoring systems, reduce operational costs, and enable efficient communication across varying deployment requirements. Military users'preference for equipment that combines rapid deployment with operational reliability and cost-effectiveness is creating opportunities for innovative mast implementations. The rising influence of smart technologies and automated deployment systems is also contributing to increased adoption of telescopic masts that can provide advanced operational control without compromising performance or deployment efficiency.
The telescopic masts market is poised for robust growth and transformation. As defense organizations and emergency services across both developed and emerging markets seek communication equipment that is efficient, reliable, rapidly deployable, and operationally advanced, telescopic mast systems are gaining prominence not just as mechanical equipment but as strategic infrastructure for operational efficiency, communication reliability, surveillance optimization, and emergency response enhancement.
Rising defense spending and security infrastructure development in Asia Pacific, North America, and Europe amplify demand, while manufacturers are picking up on innovations in lightweight materials and automated deployment systems.
Pathways like smart mast adoption, automated deployment integration, and advanced material systems promise strong margin uplift, especially in developed markets. Geographic expansion and application diversification will capture volume, particularly where defense and emergency infrastructure require modernization. Security pressures around operational efficiency, communication reliability, deployment speed, and performance optimization give structural support.
The market is segmented by product type, load capacity, height, end use, and region. By product type, the market is divided into push-up masts, hitched masts, integrated mast trailer, push button masts, and cable/belt driven systems. By load capacity, it covers light duty (up to 45kg), medium duty (45 to 120kg), and heavy duty (above 120kg). By height, it includes up to 15m, >15 to 34m, and >34 to 50m. By end use, it is segmented into commercial, military, security, municipal, and others. Regionally, the market is divided into North America, Latin America, Western Europe, Eastern Europe, East Asia, South Asia Pacific, and Middle East &Africa.
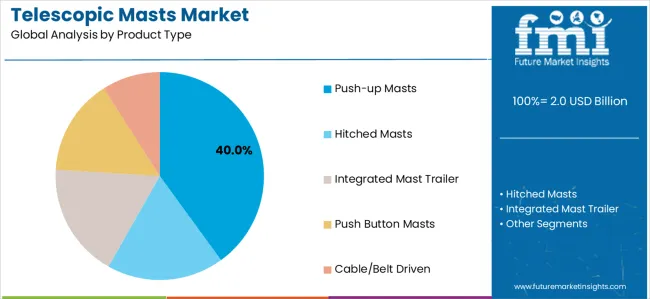
The push-up masts segment is projected to exhibit the highest CAGR of 6.1% during the forecast period, reaffirming its position as the fastest-growing product category. Military organizations and emergency services increasingly utilize push-up masts for their proven reliability, rapid deployment capabilities, and cost-effectiveness in communication and surveillance operations across defense, commercial, and municipal applications. Push-up mast technology's established operational procedures and mechanical simplicity directly address the field requirements for reliable deployment and operational efficiency in diverse operational environments.
This product segment forms the foundation of current military and emergency operations, as it represents the technology with the greatest deployment speed and established operational reliability across multiple applications and mission scenarios. User investments in enhanced push-up systems and performance optimization continue to strengthen adoption among defense contractors and emergency service providers. With users prioritizing operational reliability and rapid deployment, push-up masts align with both performance objectives and cost management requirements, making them the central component of comprehensive communication strategies.
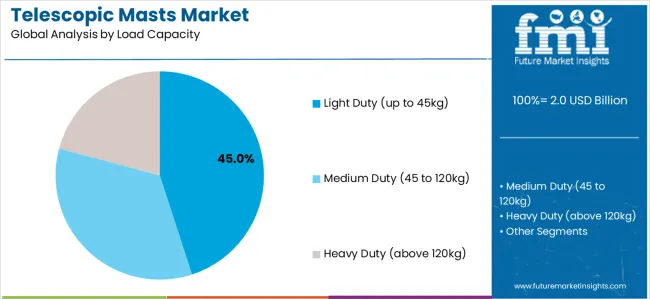
Medium duty load capacity (45 to 120kg) is projected to represent 46.0% of telescopic masts demand in 2025, underscoring its critical role as the primary capacity range for military communication and surveillance operations. Military operators prefer medium duty masts for their efficiency, reliability, and ability to handle diverse equipment loads while supporting mission requirements and operational flexibility. Positioned as versatile equipment for modern defense operations, medium duty masts offer both operational advantages and deployment benefits.
The segment is supported by continuous innovation in military equipment expansion and the growing availability of specialized mast configurations that enable efficient operation with enhanced load-bearing capabilities. Additionally, defense organizations are investing in medium duty optimization to support large-scale operations and mission effectiveness delivery. As military modernization becomes more prevalent and operational efficiency requirements increase, medium duty applications will continue to dominate the load capacity market while supporting advanced mast utilization and operational strategies.
The >15 to 34m height segment is projected to register a CAGR of 6.0% through 2035, driven by expanding military communication requirements and growing demand for surveillance systems that require optimal elevation without excessive deployment complexity. Military operators prefer this height range for its reliability, operational capabilities, and ability to handle demanding communication requirements while supporting mission schedules and surveillance objectives. The segment benefits from increasing defense modernization programs and technological advancement in mast stability systems.
This height category effectively supports communication equipment and surveillance systems essential for extended operational ranges, aligning with military infrastructure investments worldwide. Growing defense spending and smart military initiatives are further driving demand for mid-height masts to support communication networks and surveillance systems.
Military end use is projected to exhibit the highest CAGR of 6.3% from 2025 to 2035, driven by rising defense budgets globally, increased investment in communication and surveillance systems, and heightened focus on rapid deployment capabilities in operational zones. The military segment's growth is supported by expanding defense modernization programs and growing availability of specialized military configurations that enable efficient operation with enhanced operational capabilities.
The segment benefits from continuous innovation in defense technology expansion and the growing requirement for reliable communication systems in military operations. Military applications ensure consistent performance, operational reliability, and deployment efficiency in challenging operational environments, while offering scalable solutions suitable for diverse defense requirements.
The telescopic masts market is advancing steadily due to increasing defense modernization programs and growing adoption of advanced surveillance infrastructure that provides enhanced communication capabilities and operational reliability across diverse military and emergency response applications. However, the market faces challenges, including high initial investment costs for advanced systems, specialized maintenance requirements, and varying operational requirements across different deployment environments. Innovation in lightweight materials and automated deployment systems continues to influence mast development and market expansion patterns.
The growing expansion of defense budgets and military modernization initiatives is enabling mast manufacturers to develop telescopic mast systems that provide superior operational efficiency, enhanced communication capabilities, and reliable performance in demanding military environments. Advanced telescopic mast systems provide improved deployment capacity while allowing more effective communication establishment and consistent performance delivery across various applications and operational requirements. Manufacturers are increasingly recognizing the competitive advantages of modern mast capabilities for operational efficiency and military positioning.
Modern telescopic mast manufacturers are incorporating automated deployment systems and smart monitoring technologies to enhance operational efficiency, reduce deployment time, and ensure consistent performance delivery to military and emergency operators. These technologies improve operational flexibility while enabling new applications, including IoT connectivity and predictive maintenance solutions. Advanced technology integration also allows manufacturers to support premium mast positioning and performance optimization beyond traditional manual deployment systems.
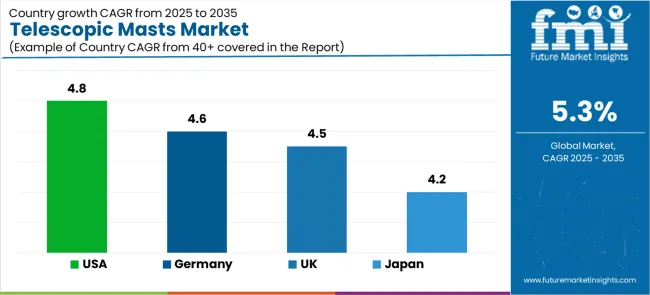
| Country | CAGR (2025-2035) |
|---|---|
| United States | 4.8% |
| United Kingdom | 4.5% |
| Japan | 4.2% |
| Germany | 4.6% |
The telescopic masts market is experiencing steady growth globally, with ASEAN leading at a 6.2% CAGR through 2035, driven by increasing defense investments, border security initiatives, and growing surveillance infrastructure development supported by military modernization programs and territorial security requirements. USA follows at 4.8%, supported by extensive defense spending, military communication upgrades, and growing adoption of advanced mast technologies. Germany shows growth at 4.6%, emphasizing defense modernization and security infrastructure development. United Kingdom demonstrates 4.5% growth, supported by military upgrades and emergency service modernization. Japan records 4.2%, focusing on defense infrastructure but constrained by mature market conditions.
The report covers an in-depth analysis of 40+ countries;five top-performing countries are highlighted below.
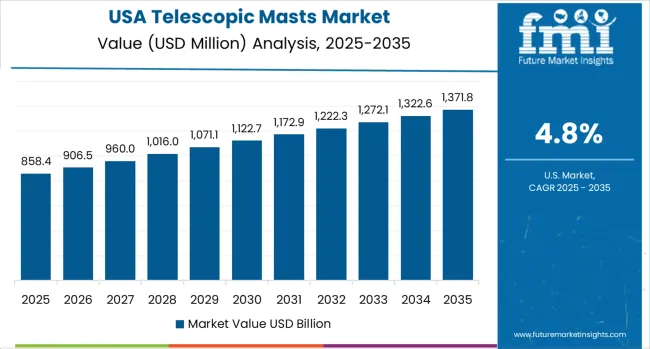
Revenue from telescopic masts in the USA is projected to exhibit growth with a CAGR of 4.8% through 2035, driven by extensive defense spending programs and military communication infrastructure development supported by border security initiatives and tactical communication requirements. The country's comprehensive defense strategy and increasing investment in surveillance technologies are creating substantial demand for advanced mast solutions. Major defense contractors and military organizations are establishing extensive equipment programs to address the growing demand for efficient communication and surveillance systems.
Revenue from telescopic masts in ASEAN countries is expanding at a CAGR of 6.2%, supported by the region's military modernization programs, border security development, and increasing adoption of surveillance technologies. The countries'comprehensive defense strategies and growing security concerns are driving sophisticated mast capabilities. State defense organizations and security agencies are establishing extensive equipment operations to address the growing demand for efficient communication and border monitoring.
Revenue from telescopic masts in Germany is expanding at a CAGR of 4.6%, supported by the country's defense technology advancement, comprehensive security programs, and strategic investment in military modernization among defense operators. The nation's established defense sector and increasing emphasis on security infrastructure are driving sophisticated mast capabilities throughout the equipment market. Leading defense contractors and security organizations are investing extensively in mast technology development and system integration to serve both domestic defense needs and export markets.
Revenue from telescopic masts in the United Kingdom is growing at a CAGR of 4.5%, driven by expanding military modernization programs, increasing emergency service requirements, and growing investment in security infrastructure. The country's established defense infrastructure and emphasis on operational efficiency are supporting demand for advanced mast technologies across major defense markets. Military operators and emergency services are establishing comprehensive equipment programs to serve both domestic defense needs and operational efficiency requirements.
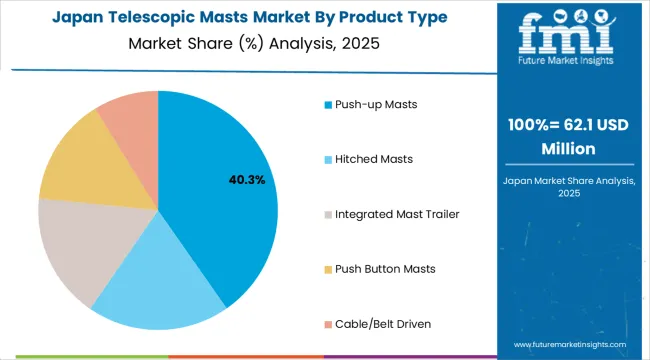
Revenue from telescopic masts in Japan is expanding at a CAGR of 4.2%, supported by the country's defense infrastructure development, technological advancement programs, and strategic investment in security modernization. Japan's established defense sector and emphasis on technology integration are driving demand for high-performance mast technologies across major defense markets. Defense organizations and technology companies are establishing equipment partnerships to serve both domestic security needs and technology development requirements.
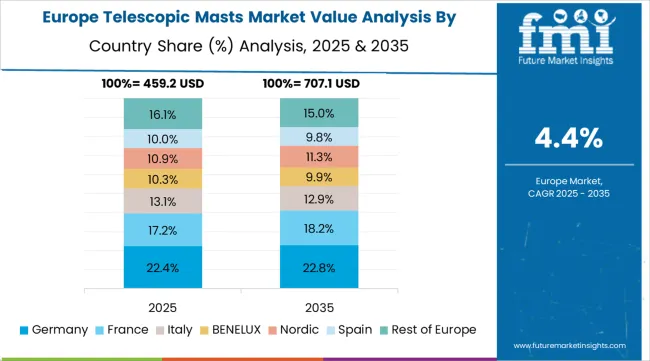
The telescopic masts market in Europe is projected to grow from USD 0.52 billion in 2025 to USD 0.85 billion by 2035, registering a CAGR of 5.1% over the forecast period. Germany is expected to maintain its leadership position with a 28.3% market share in 2025, increasing to 29.1% by 2035, supported by its advanced defense technology capabilities, comprehensive security infrastructure, and major military installations serving European and international markets.
United Kingdom follows with a 22.1% share in 2025, projected to ease to 21.7% by 2035, driven by military modernization programs, emergency service development, and established defense capabilities, but facing challenges from budget constraints and infrastructure investment limitations. France holds a 18.4% share in 2025, expected to reach 18.8% by 2035, supported by defense modernization requirements and security infrastructure initiatives. Italy commands a 14.2% share in 2025, projected to reach 14.3% by 2035, while Spain accounts for 9.8% in 2025, expected to reach 9.9% by 2035. The Rest of Europe region, including Nordic countries, Eastern European markets, Netherlands, Belgium, and other European countries, is anticipated to maintain momentum, with its collective share stable from 7.2% to 6.2% by 2035, attributed to consistent defense development across Nordic countries and steady security modernization across various European markets implementing infrastructure upgrade programs.
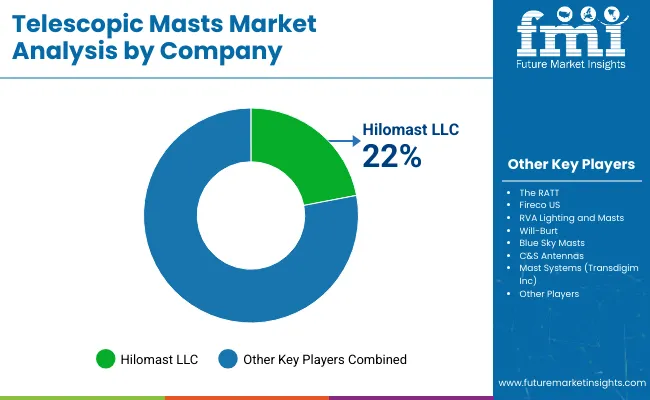
The telescopic masts market is characterized by competition among established defense equipment manufacturers, specialized mast technology providers, and integrated communication system companies. Companies are investing in advanced material research, automated deployment technology development, performance optimization, and comprehensive mast portfolios to deliver efficient, reliable, and operationally advanced telescopic mast solutions. Innovation in lightweight materials, automated control systems, and smart integration capabilities is central to strengthening market position and competitive advantage.
The RATT leads the market with a strong presence, offering comprehensive surveillance mast portfolios and advanced deployment systems with a focus on reliability and innovation for military applications. Fireco US provides specialized mast solutions with an emphasis on emergency response applications, rapid deployment, and operational reliability. Hilomast LLC delivers advanced mast technologies and precision systems with a focus on military and commercial applications. RVA Lighting and Masts specializes in integrated lighting solutions with emphasis on municipal and emergency applications. Will-Burt focuses on diverse mast solutions with global service networks and comprehensive support capabilities. Blue Sky Masts offers specialized communication masts with advanced control systems and operational optimization.
| Items | Values |
|---|---|
| Quantitative Units (2025) | USD 2 billion |
| Product Type | Push-up Masts, Hitched Masts, Integrated Mast Trailer, Push Button Masts, Cable/Belt Driven |
| Load Capacity | Light Duty (up to 45kg), Medium Duty (45 to 120kg), Heavy Duty (above 120kg) |
| Height | Up to 15m, >15 to 34m, >34 to 50m |
| End Use | Commercial, Military, Security, Municipal, Others |
| Regions Covered | North America, Latin America, Western Europe, Eastern Europe, East Asia, South Asia Pacific, Middle East &Africa |
| Countries Covered | United States, Canada, Germany, United Kingdom, France, China, Japan, Brazil, India and 40+ countries |
| Key Companies Profiled | The RATT, Fireco US, Hilomast LLC, RVA Lighting and Masts, Will-Burt, and Blue Sky Masts |
| Additional Attributes | Mast sales by product type and end use, regional demand trends, competitive landscape, technological advancements in automated systems, lightweight material development, smart connectivity innovation, and operational efficiency optimization |
The global telescopic masts market is estimated to be valued at USD 2.0 billion in 2025.
The market size for the telescopic masts market is projected to reach USD 3.3 billion by 2035.
The telescopic masts market is expected to grow at a 5.3% CAGR between 2025 and 2035.
The key product types in telescopic masts market are push-up masts, hitched masts, integrated mast trailer, push button masts and cable/belt driven.
In terms of load capacity, light duty (up to 45kg) segment to command 45.0% share in the telescopic masts market in 2025.


Full Research Suite comprises of:
Market outlook & trends analysis
Interviews & case studies
Strategic recommendations
Vendor profiles & capabilities analysis
5-year forecasts
8 regions and 60+ country-level data splits
Market segment data splits
12 months of continuous data updates
DELIVERED AS:
PDF EXCEL ONLINE
Industry Share Analysis for Telescopic Masts Companies
Telescopic Inspection Mirror Market Size and Share Forecast Outlook 2025 to 2035
Telescopic Crane Market Size and Share Forecast Outlook 2025 to 2035
Telescopic Tool Boxes Market Growth - Demand & Forecast 2025 to 2035

Thank you!
You will receive an email from our Business Development Manager. Please be sure to check your SPAM/JUNK folder too.
Chat With
MaRIA