Aerostructure Market Size and Share Forecast Outlook (2024 to 2034)

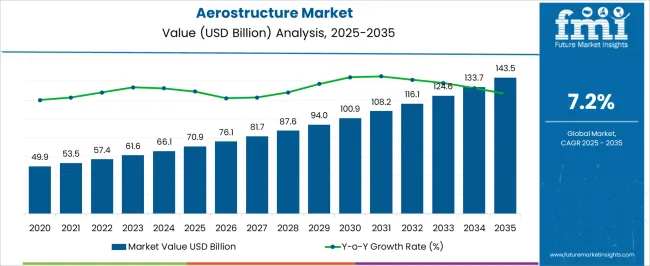
The global aerostructure market is expected to be worth USD 133.4 billion by 2034, up from USD 66.1 billion in 2024. The market is expected to grow at a rate of 7.3% between 2024 and 2034. The expansion of the commercial aviation sector, rising air travel demand, and advances in aircraft technology are all contributing factors to the aerostructure industry's growth.

Growth in air travel demand, especially in emerging nations, creates growth opportunities for aerostructure manufacturers and suppliers. Modernized aerostructures are becoming increasingly in demand as technical developments in manufacturing and materials also improve the efficiency and performance of airplanes. Additionally, emphasizing lightweight and fuel-efficient designs helps accelerate the aerostructure industry's growth.

Consumption Analysis of the Aerostructure Sector

  • The increasing demand for air travel and freight transportation has led to a surge in aerostructure requirements. This has boosted demand for aircraft to accommodate the growing passenger and cargo traffic.
  • The aerostructures market is experiencing a surge due to the commercial aviation industry's expansion, new markets, and improved air connectivity, resulting in increased demand for aircraft components like wings, fuselage, and tail sections.
  • Ongoing advancements in aviation technology, including improvements in aircraft materials and manufacturing methods, significantly enhance aerostructure performance, efficiency, and safety. These developments are positively impacting the aerostructure market growth.
  • As the focus on environmental sustainability continues to increase, the aerospace industry is experiencing a rising need for aerostructures that can enhance fuel efficiency and minimize environmental impact.
  • Rising investments in aerospace research and development endeavors drive the development of sophisticated aerostructures, which are expected to propel market growth in the forthcoming decade.
Attributes Details
Aerostructure Market Value for 2024 USD 66.1 billion
Aerostructure Market Size for 2034 USD 133.4 billion
Aerostructure Market Forecast CAGR for 2024 to 2034 7.3%

Sales Analysis and Future Growth of the Global Aerostructure Market

This section provides a comprehensive analysis of the industry during the last five years, highlighting the expected growth patterns in the aerostructure market. The market is progressively strangling, as shown by a strong 9.0% historical compound annual growth rate. The industry is predicted to develop steadily at a 7.3% CAGR until 2034.

Historical CAGR 9.0%
Forecast CAGR 7.3%

Global economic downturns and lessened air travel demand owing to the pandemic have affected the aerostructure industry, leading to a slowdown in the industry's growth and development.

Crucial factors are anticipated to affect the demand for aerostructures through 2034.

  • Economic difficulties, recessions, or financial crises that lower air travel demand slightly impact the need for more aerostructures.
  • The global aviation sector is susceptible to disruptions due to political concerns, trade disputes, or warfares, which can impact the demand for aerostructures.
  • Global pandemics and health crises, such as the COVID-19 outbreak, can impair air travel and cause delays or reductions in funding for aerostructure development.
  • The manufacture of aerostructures may be impacted by a greater emphasis on sustainable methods as a result of strict regulations regarding the environment and concerns.

Market participants need to be astute and adaptable during the anticipated period, as these tough aspects position the industry for future growth.

Emerging Trends Transforming the Aerostructure Industry

Urban Air Mobility (UAM) Trend Skyrockets in Aerospace Sector

The rapid advancement in urban air mobility is giving rise to new transportation concepts, including electric vertical takeoff and landing (eVTOL) vehicles. These emerging trends are transforming the way people travel and posing new challenges to the design and production of aerostructures. Growing demand for urban air mobility (UAM) services is predicted to have a key effect on the expansion of the aerostructure sector.

The growth of aerostructures is attributed to the need for innovative and durable aerostructures that can withstand the unique demands of eVTOL vehicles and support the safe and efficient operation of UAM services. From advanced materials to aerodynamic design, the aerostructure industry is constantly evolving to meet the demands of urban air mobility.

Advancements in the Manufacturing Materials and Technology

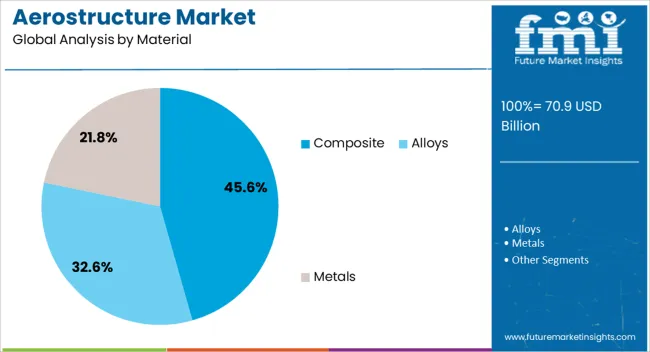
The use of additive manufacturing (AM), often known as 3D printing, has allowed for more effective production and customization of aerostructures. The aerostructure and aviation industries are growing rapidly. Advanced lightweight materials like composites and alloys are gaining popularity in the industry. They enhance fuel efficiency and reduce aircraft weight, leading to increased speed, better maneuverability, and lower airline operational costs.

The aviation industry is focusing on developing lightweight materials and advanced manufacturing technologies to enhance aircraft performance and reduce environmental impact, aiming to transition toward a more eco-friendly aviation sector using sustainable materials and manufacturing processes.

The aerostructure and aviation industry is expected to experience significant growth due to advanced manufacturing techniques, lightweight materials, and the development of novel materials, which enhance aircraft performance and contribute to a sustainable future.

Increased Connectivity Influences Global Supply Chain Spirit

As sophisticated avionics and connection technologies improve passenger enjoyment, communication, and navigation, there is an increasing need for aerostructures to enable these services. Establishing resilient and varied supply chains is essential to meeting the rising demand.

This guarantees constant manufacturing of materials and aerostructure components necessary to satisfy industrial demands. The aerostructure sector is expanding primarily due to these causes, and businesses that can adjust to these shifting patterns have a favorable future in the forthcoming decade.

Aerostructure Industry Analysis by Top Investment Segments

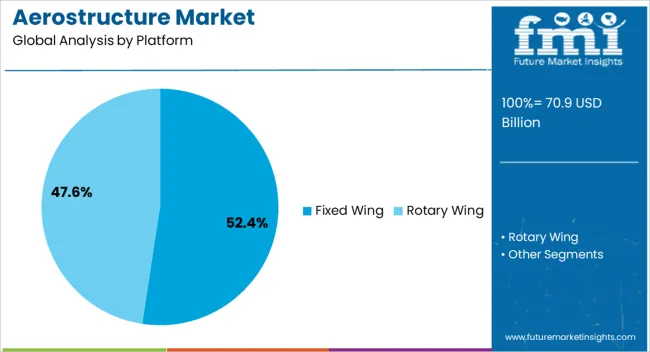
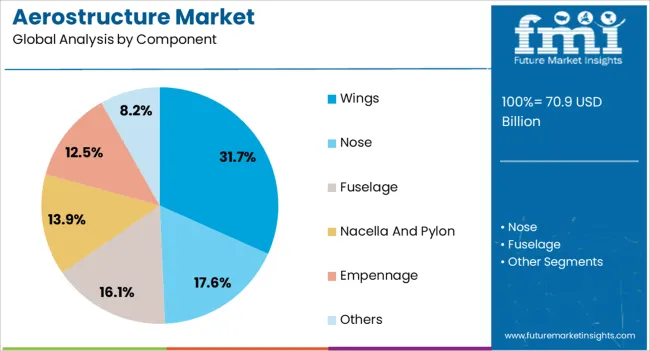
This section provides detailed insights into specific segments of the aerostructure industry. The research focuses primarily on two key subjects: the fixed-wing platform segment and the wings as a component segment. Through comprehensive analysis, this section aims to offer a deeper understanding of these segments and their significance in the broader context of the aerostructure industry.

Fixed Wings are Taking Off in the Aerostructure Industry at a Moderate Rate

Attributes Details
Top Platform Fixed Wing
CAGR from 2024 to 2034 7.1%

The fixed wing platform category is expected to dominate the aerostructure market, exhibiting a CAGR of 7.1% between 2024 and 2034. However, it is noteworthy that the CAGR for fixed wing platforms was previously projected to be a promising 8.8%. The development of fixed wings for aerostructures can be attributed to several factors:

  • Research and development focus on improving the efficiency of fixed wing platforms by integrating lightweight composites and alloys. One area of research aims to enhance the aerodynamic performance of fixed wings.
  • Additionally, aerostructures are being adapted for military fixed-wing platforms and defense applications, boosting industry growth.
  • 3D printing is increasingly used for rapid prototyping and component production of the fixed-wing platform.
  • Ultimately, state-of-the-art avionics systems are being incorporated to enhance the fixed wing segment's functionality.

Wings Segment are Flying High in the Aerostructure Industry

Attributes Details
Top Component Wings
CAGR from 2024 to 2034 6.8%

The wings segment is leading in the component category, with a notable compound annual growth rate (CAGR) of 6.8%. This is a decrease from the prior CAGR of the wings component, which was 8.6% from 2019 to 2024. The following drivers describe the development of the wings component segment:
  • The aviation sector is pushing for strong, lightweight materials for wing components, such as sophisticated alloys and carbon-fiber composites.
  • Continuous investigation into improving wing aerodynamics, aspect ratios, and structural integrity for better performance and fuel economy has led to the growth of the aerostructure industry.
  • Integration of wing parts intended to improve aerodynamics and lower drag, enhancing the aerostructural systems' overall fuel efficiency.
  • Aerospace engineering is rising quickly because of the increasing use of 3D printing to make sophisticated wing components that allow for complicated shapes and weight savings.
  • Applying winglet designs to reduce wingtip vortices, increase lift, and boost the aerostructure's wing components' fuel economy.

Analysis of Top Countries Manufacturing, Certifying, and Assembling Aerostructures

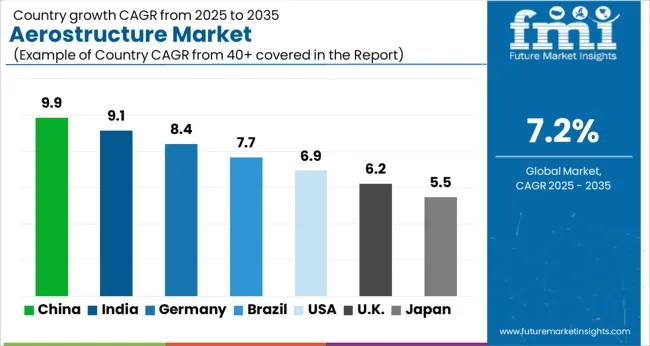
This section delves into the aerostructure markets of some of the significant nations on the global map, including the United States, China, Japan, South Korea, and the United Kingdom. Through a comprehensive analysis, explore the various factors impacting these countries' demand, acceptance, and deals with aerostructures.

Countries CAGR from 2024 to 2034
The United States 7.5%
Japan 8.8%
The United Kingdom 8.4%
South Korea 9.3%
China 7.9%

Demand for the Commercial Aerostructures Flies in the United States

The aerospace industry in the United States is expected to witness steady growth of 7.5% until 2034. Despite the moderate growth, the industry is projected to reach a valuation of USD 23.7 billion by 2034. The following factors are driving the demand for aerostructures, which plays a crucial role in the growth of the aerospace industry:
  • Numerous variables, including the growth of technology, the growing need for fuel-efficient aircraft, and an increase in passenger traffic, are responsible for this evolution in the United States.
  • Aerostructure industry growth is aided by the ongoing expansion of the commercial aviation industry in the United States, driven by growing connectivity and new needs.

Aerospace Manufacturing Hit the Roof in Japan

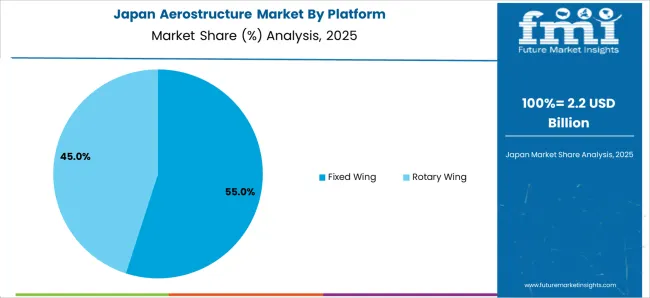
Japan's aerostructure manufacturing industry is witnessing a remarkable surge in demand. As per market analysis, the sector experience a CAGR of 8.8% through 2034, which is expected to result in a valuation of around USD 14.7 billion by the same year. It is worth noting that the previous CAGR of the Japan aerostructure market was around 12.1%. Some of the primary drivers include:

  • Japan excels in aircraft technology and manufacturing, creating high-performance aerostructures that are safe and effective.
  • Advancements are spurring Japan's aviation sector to outfit aircraft with pristine technology.
  • Japanese manufacturers use advanced materials and methods to improve aerostructure performance and lifespan.
  • Japan is a leading country in the aerospace industry, known for producing dependable, high-quality airplane structures that meet strict safety regulations.

China Aerostructure Industry Fosters Advanced Aerospace Engineering

According to a recent analysis, China aerostructure market is witnessing a significant surge in demand at a predicted CAGR of 7.9%. Experts anticipate the sector to reach a valuation of USD 20.8 billion by the year 2034. The Chinese industry experienced a notable CAGR of 11.3% between 2019 and 2023. Among the main trends are:

  • The need for air travel and the necessity for cutting-edge aerostructures and aeronautical engineering are both fueled by China's economic growth.
  • Significant government funding and assistance for China's aerospace industry to improve homegrown production capacity and technical innovation.
  • The ongoing development of airports, aviation hubs, and related infrastructure facilitates the expansion of the market in China.

Modern Aircraft and Cutting-edge Technology Soaring the Market in the United Kingdom

The aerostructure market in the United Kingdom is expected to witness substantial growth in the coming years, with an estimated CAGR of 8.4% until 2034. The industry has already shown significant potential, with a CAGR of 9.7% between 2019 and 2023. The market is projected to be valued at USD 5.4 billion, indicating a vast potential for growth and investment in this sector. Here are a few of the key trends:
  • Working with foreign OEMs and aerospace companies may help expand market reach, acquire knowledge, and support the United Kingdom's aerostructure sector.
  • The United Kingdom's aerostructure sector is growing because of the increasing demand for air transportation by urbanization and the growing middle-class population.

Aviation Structural Components Workforce Demand Glides in the South Korean Industry

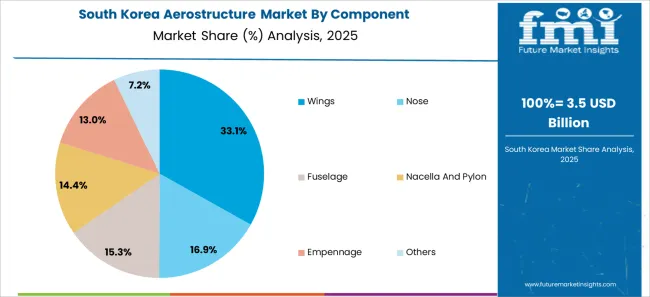
With a potential CAGR of 9.3%, the demand for aerostructure in South Korea is expected to expand at a substantial rate. By 2034, this increase is expected to decipher into a valuation of USD 8.6 billion. It should be noted that the nation has previously seen a higher CAGR of 16.0% from 2019 to 2023. Several of the key trends are as follows:
  • South Korea requires a highly trained labor force capable of actively participating in aerostructure research, design, and manufacture.
  • Funding for educational and training initiatives tailored to the unique requirements of South Korea's aerostructure sector is essential. By doing this, South Korea can ensure that its labor force is qualified and skilled enough to satisfy the demands of this expanding sector.

Competitive Landscape of the Global Aerostructure Market

The aerostructure industry is witnessing a transformational shift as establishments leverage strategic initiatives and innovations to shape the future viewpoint. Research and development centers within aerospace companies are pioneering materials, manufacturing processes, and aerodynamics advancements. Collaborative partnerships between industry players, academia, and government entities foster a dynamic ecosystem, accelerating technological breakthroughs.

Investment in cutting-edge technologies such as additive manufacturing, digitalization, and 3D material printing transforms traditional production methods, enhancing efficiency and customization. Global partnerships enable knowledge exchange and market expansion, enabling the aerostructure industry to realize its full potential.

The aerostructure industry is also witnessing a growing emphasis on sustainable practices, which focus on eco-friendly materials and processes to align with environmental goals. Training programs and educational institutions contribute to a skilled workforce, ensuring a talent pipeline for the industry. These establishments are propelling the aerostructure sector toward a future defined by innovation and sustainability.

Recent Developments in the Aerostructure Industry:

  • In January 2024, Mahindra Aerostructures Pvt Ltd and Airbus Aerostructures GmbH signed a new contract to manufacture and deliver metallic components for all Airbus commercial aircraft models.
  • In January 2024, Pilatus acquired RUAG's Swiss aerostructures division and all its machinery for an undisclosed sum as part of the state-owned entity's ongoing 'unbundling'.
  • In August 2023, Tata Lockheed Martin Aerostructures (TLMAL) delivered the 200th C-130J Super Hercules empennage, including stabilizers, leading edges, and tip assemblies, to seven countries, including India, from its Adibatla manufacturing facility.
  • In February 2023, GKN Fokker, NLR, Delft University of Technology, and SAM|XL collaborated on Airbus' Multi-Functional Fuselage Demonstrator project, manufacturing one of the world's leading thermoplastic components. The project aims to reduce fuselage weight and recurring costs.

Leading Companies in the Aerostructure Industry

  • AAR Corp
  • Triumph Group Inc
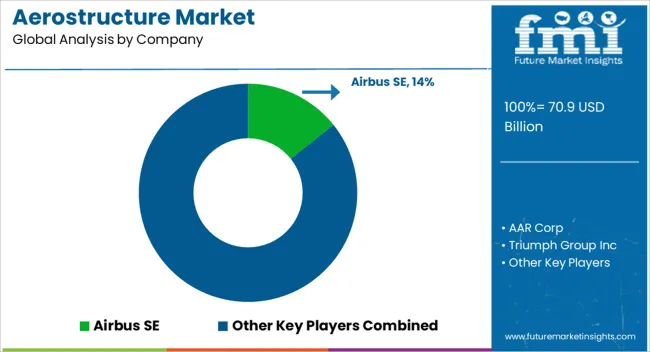
  • Airbus SE
  • The Boeing Company
  • Lockheed Martin Corporation
  • Northrop Grumman Corporation
  • Bombardier Inc.
  • Embraer S.A.
  • Spirit AeroSystems Holdings, Inc.
  • Saab AB

Top Segments Studied in the Aerostructure Market

By Platform:

  • Fixed Wing
    • Commercial
    • Military
    • Business Jet
    • General Aviation Aircraft
  • Rotary Wing
    • Commercial Helicopters
    • Military Helicopters
    • UAVs

By Component:

  • Wings
  • Nose
  • Fuselage
  • Nacella and Pylon
  • Empennage
  • Others

By Material:

  • Alloys
  • Composite
  • Metals

By Region:

  • North America
  • Latin America
  • Europe
  • East Asia
  • South Asia
  • Oceania
  • The Middle East and Africa

Table of Content

  • 1. Executive Summary
  • 2. Market Overview
  • 3. Market Background
  • 4. Global Market Analysis 2019 to 2023 and Forecast, 2024 to 2034
  • 5. Global Market Analysis 2019 to 2023 and Forecast 2024 to 2034, By Platform
    • 5.1. Fixed Wing
      • 5.1.1. Commercial
      • 5.1.2. Military
      • 5.1.3. Business Jet
      • 5.1.4. General Aviation Aircraft
    • 5.2. Rotary Wing
      • 5.2.1. Commercial Helicopters
      • 5.2.2. Military Helicopters
      • 5.2.3. UAVs
  • 6. Global Market Analysis 2019 to 2023 and Forecast 2024 to 2034, By Component
    • 6.1. Wings
    • 6.2. Nose
    • 6.3. Fuselage
    • 6.4. Nacella and Pylon
    • 6.5. Empennage
    • 6.6. Others
  • 7. Global Market Analysis 2019 to 2023 and Forecast 2024 to 2034, By Material
    • 7.1. Alloys
    • 7.2. Composite
    • 7.3. Metals
  • 8. Global Market Analysis 2019 to 2023 and Forecast 2024 to 2034, By Region
    • 8.1. North America
    • 8.2. Latin America
    • 8.3. Western Europe
    • 8.4. Eastern Europe
    • 8.5. South Asia and Pacific
    • 8.6. East Asia
    • 8.7. Middle East and Africa
  • 9. North America Market Analysis 2019 to 2023 and Forecast 2024 to 2034, By Country
  • 10. Latin America Market Analysis 2019 to 2023 and Forecast 2024 to 2034, By Country
  • 11. Western Europe Market Analysis 2019 to 2023 and Forecast 2024 to 2034, By Country
  • 12. Eastern Europe Market Analysis 2019 to 2023 and Forecast 2024 to 2034, By Country
  • 13. South Asia and Pacific Market Analysis 2019 to 2023 and Forecast 2024 to 2034, By Country
  • 14. East Asia Market Analysis 2019 to 2023 and Forecast 2024 to 2034, By Country
  • 15. Middle East and Africa Market Analysis 2019 to 2023 and Forecast 2024 to 2034, By Country
  • 16. Key Countries Market Analysis
  • 17. Market Structure Analysis
  • 18. Competition Analysis
    • 18.1. AAR Corp
    • 18.2. Bombardier Inc
    • 18.3. SAAB AB
    • 18.4. Spirit Aerosystems Inc
    • 18.5. Triumph Group Inc
    • 18.6. Cyient Ltd
    • 18.7. Elbit Systems Ltd
    • 18.8. GKN Aerospace
    • 18.9. Leonardo SpA
    • 18.10. The Boeing Company
  • 19. Assumptions & Acronyms Used
  • 20. Research Methodology

List of Tables

Table 1: Global Market Value (US$ Million) Forecast by Region, 2019 to 2034

Table 2: Global Market Volume (Units) Forecast by Region, 2019 to 2034

Table 3: Global Market Value (US$ Million) Forecast by Platform, 2019 to 2034

Table 4: Global Market Volume (Units) Forecast by Platform, 2019 to 2034

Table 5: Global Market Value (US$ Million) Forecast by Component, 2019 to 2034

Table 6: Global Market Volume (Units) Forecast by Component, 2019 to 2034

Table 7: Global Market Value (US$ Million) Forecast by Material, 2019 to 2034

Table 8: Global Market Volume (Units) Forecast by Material, 2019 to 2034

Table 9: North America Market Value (US$ Million) Forecast by Country, 2019 to 2034

Table 10: North America Market Volume (Units) Forecast by Country, 2019 to 2034

Table 11: North America Market Value (US$ Million) Forecast by Platform, 2019 to 2034

Table 12: North America Market Volume (Units) Forecast by Platform, 2019 to 2034

Table 13: North America Market Value (US$ Million) Forecast by Component, 2019 to 2034

Table 14: North America Market Volume (Units) Forecast by Component, 2019 to 2034

Table 15: North America Market Value (US$ Million) Forecast by Material, 2019 to 2034

Table 16: North America Market Volume (Units) Forecast by Material, 2019 to 2034

Table 17: Latin America Market Value (US$ Million) Forecast by Country, 2019 to 2034

Table 18: Latin America Market Volume (Units) Forecast by Country, 2019 to 2034

Table 19: Latin America Market Value (US$ Million) Forecast by Platform, 2019 to 2034

Table 20: Latin America Market Volume (Units) Forecast by Platform, 2019 to 2034

Table 21: Latin America Market Value (US$ Million) Forecast by Component, 2019 to 2034

Table 22: Latin America Market Volume (Units) Forecast by Component, 2019 to 2034

Table 23: Latin America Market Value (US$ Million) Forecast by Material, 2019 to 2034

Table 24: Latin America Market Volume (Units) Forecast by Material, 2019 to 2034

Table 25: Western Europe Market Value (US$ Million) Forecast by Country, 2019 to 2034

Table 26: Western Europe Market Volume (Units) Forecast by Country, 2019 to 2034

Table 27: Western Europe Market Value (US$ Million) Forecast by Platform, 2019 to 2034

Table 28: Western Europe Market Volume (Units) Forecast by Platform, 2019 to 2034

Table 29: Western Europe Market Value (US$ Million) Forecast by Component, 2019 to 2034

Table 30: Western Europe Market Volume (Units) Forecast by Component, 2019 to 2034

Table 31: Western Europe Market Value (US$ Million) Forecast by Material, 2019 to 2034

Table 32: Western Europe Market Volume (Units) Forecast by Material, 2019 to 2034

Table 33: Eastern Europe Market Value (US$ Million) Forecast by Country, 2019 to 2034

Table 34: Eastern Europe Market Volume (Units) Forecast by Country, 2019 to 2034

Table 35: Eastern Europe Market Value (US$ Million) Forecast by Platform, 2019 to 2034

Table 36: Eastern Europe Market Volume (Units) Forecast by Platform, 2019 to 2034

Table 37: Eastern Europe Market Value (US$ Million) Forecast by Component, 2019 to 2034

Table 38: Eastern Europe Market Volume (Units) Forecast by Component, 2019 to 2034

Table 39: Eastern Europe Market Value (US$ Million) Forecast by Material, 2019 to 2034

Table 40: Eastern Europe Market Volume (Units) Forecast by Material, 2019 to 2034

Table 41: South Asia and Pacific Market Value (US$ Million) Forecast by Country, 2019 to 2034

Table 42: South Asia and Pacific Market Volume (Units) Forecast by Country, 2019 to 2034

Table 43: South Asia and Pacific Market Value (US$ Million) Forecast by Platform, 2019 to 2034

Table 44: South Asia and Pacific Market Volume (Units) Forecast by Platform, 2019 to 2034

Table 45: South Asia and Pacific Market Value (US$ Million) Forecast by Component, 2019 to 2034

Table 46: South Asia and Pacific Market Volume (Units) Forecast by Component, 2019 to 2034

Table 47: South Asia and Pacific Market Value (US$ Million) Forecast by Material, 2019 to 2034

Table 48: South Asia and Pacific Market Volume (Units) Forecast by Material, 2019 to 2034

Table 49: East Asia Market Value (US$ Million) Forecast by Country, 2019 to 2034

Table 50: East Asia Market Volume (Units) Forecast by Country, 2019 to 2034

Table 51: East Asia Market Value (US$ Million) Forecast by Platform, 2019 to 2034

Table 52: East Asia Market Volume (Units) Forecast by Platform, 2019 to 2034

Table 53: East Asia Market Value (US$ Million) Forecast by Component, 2019 to 2034

Table 54: East Asia Market Volume (Units) Forecast by Component, 2019 to 2034

Table 55: East Asia Market Value (US$ Million) Forecast by Material, 2019 to 2034

Table 56: East Asia Market Volume (Units) Forecast by Material, 2019 to 2034

Table 57: Middle East and Africa Market Value (US$ Million) Forecast by Country, 2019 to 2034

Table 58: Middle East and Africa Market Volume (Units) Forecast by Country, 2019 to 2034

Table 59: Middle East and Africa Market Value (US$ Million) Forecast by Platform, 2019 to 2034

Table 60: Middle East and Africa Market Volume (Units) Forecast by Platform, 2019 to 2034

Table 61: Middle East and Africa Market Value (US$ Million) Forecast by Component, 2019 to 2034

Table 62: Middle East and Africa Market Volume (Units) Forecast by Component, 2019 to 2034

Table 63: Middle East and Africa Market Value (US$ Million) Forecast by Material, 2019 to 2034

Table 64: Middle East and Africa Market Volume (Units) Forecast by Material, 2019 to 2034

List of Figures

Figure 1: Global Market Value (US$ Million) by Platform, 2024 to 2034

Figure 2: Global Market Value (US$ Million) by Component, 2024 to 2034

Figure 3: Global Market Value (US$ Million) by Material, 2024 to 2034

Figure 4: Global Market Value (US$ Million) by Region, 2024 to 2034

Figure 5: Global Market Value (US$ Million) Analysis by Region, 2019 to 2034

Figure 6: Global Market Volume (Units) Analysis by Region, 2019 to 2034

Figure 7: Global Market Value Share (%) and BPS Analysis by Region, 2024 to 2034

Figure 8: Global Market Y-o-Y Growth (%) Projections by Region, 2024 to 2034

Figure 9: Global Market Value (US$ Million) Analysis by Platform, 2019 to 2034

Figure 10: Global Market Volume (Units) Analysis by Platform, 2019 to 2034

Figure 11: Global Market Value Share (%) and BPS Analysis by Platform, 2024 to 2034

Figure 12: Global Market Y-o-Y Growth (%) Projections by Platform, 2024 to 2034

Figure 13: Global Market Value (US$ Million) Analysis by Component, 2019 to 2034

Figure 14: Global Market Volume (Units) Analysis by Component, 2019 to 2034

Figure 15: Global Market Value Share (%) and BPS Analysis by Component, 2024 to 2034

Figure 16: Global Market Y-o-Y Growth (%) Projections by Component, 2024 to 2034

Figure 17: Global Market Value (US$ Million) Analysis by Material, 2019 to 2034

Figure 18: Global Market Volume (Units) Analysis by Material, 2019 to 2034

Figure 19: Global Market Value Share (%) and BPS Analysis by Material, 2024 to 2034

Figure 20: Global Market Y-o-Y Growth (%) Projections by Material, 2024 to 2034

Figure 21: Global Market Attractiveness by Platform, 2024 to 2034

Figure 22: Global Market Attractiveness by Component, 2024 to 2034

Figure 23: Global Market Attractiveness by Material, 2024 to 2034

Figure 24: Global Market Attractiveness by Region, 2024 to 2034

Figure 25: North America Market Value (US$ Million) by Platform, 2024 to 2034

Figure 26: North America Market Value (US$ Million) by Component, 2024 to 2034

Figure 27: North America Market Value (US$ Million) by Material, 2024 to 2034

Figure 28: North America Market Value (US$ Million) by Country, 2024 to 2034

Figure 29: North America Market Value (US$ Million) Analysis by Country, 2019 to 2034

Figure 30: North America Market Volume (Units) Analysis by Country, 2019 to 2034

Figure 31: North America Market Value Share (%) and BPS Analysis by Country, 2024 to 2034

Figure 32: North America Market Y-o-Y Growth (%) Projections by Country, 2024 to 2034

Figure 33: North America Market Value (US$ Million) Analysis by Platform, 2019 to 2034

Figure 34: North America Market Volume (Units) Analysis by Platform, 2019 to 2034

Figure 35: North America Market Value Share (%) and BPS Analysis by Platform, 2024 to 2034

Figure 36: North America Market Y-o-Y Growth (%) Projections by Platform, 2024 to 2034

Figure 37: North America Market Value (US$ Million) Analysis by Component, 2019 to 2034

Figure 38: North America Market Volume (Units) Analysis by Component, 2019 to 2034

Figure 39: North America Market Value Share (%) and BPS Analysis by Component, 2024 to 2034

Figure 40: North America Market Y-o-Y Growth (%) Projections by Component, 2024 to 2034

Figure 41: North America Market Value (US$ Million) Analysis by Material, 2019 to 2034

Figure 42: North America Market Volume (Units) Analysis by Material, 2019 to 2034

Figure 43: North America Market Value Share (%) and BPS Analysis by Material, 2024 to 2034

Figure 44: North America Market Y-o-Y Growth (%) Projections by Material, 2024 to 2034

Figure 45: North America Market Attractiveness by Platform, 2024 to 2034

Figure 46: North America Market Attractiveness by Component, 2024 to 2034

Figure 47: North America Market Attractiveness by Material, 2024 to 2034

Figure 48: North America Market Attractiveness by Country, 2024 to 2034

Figure 49: Latin America Market Value (US$ Million) by Platform, 2024 to 2034

Figure 50: Latin America Market Value (US$ Million) by Component, 2024 to 2034

Figure 51: Latin America Market Value (US$ Million) by Material, 2024 to 2034

Figure 52: Latin America Market Value (US$ Million) by Country, 2024 to 2034

Figure 53: Latin America Market Value (US$ Million) Analysis by Country, 2019 to 2034

Figure 54: Latin America Market Volume (Units) Analysis by Country, 2019 to 2034

Figure 55: Latin America Market Value Share (%) and BPS Analysis by Country, 2024 to 2034

Figure 56: Latin America Market Y-o-Y Growth (%) Projections by Country, 2024 to 2034

Figure 57: Latin America Market Value (US$ Million) Analysis by Platform, 2019 to 2034

Figure 58: Latin America Market Volume (Units) Analysis by Platform, 2019 to 2034

Figure 59: Latin America Market Value Share (%) and BPS Analysis by Platform, 2024 to 2034

Figure 60: Latin America Market Y-o-Y Growth (%) Projections by Platform, 2024 to 2034

Figure 61: Latin America Market Value (US$ Million) Analysis by Component, 2019 to 2034

Figure 62: Latin America Market Volume (Units) Analysis by Component, 2019 to 2034

Figure 63: Latin America Market Value Share (%) and BPS Analysis by Component, 2024 to 2034

Figure 64: Latin America Market Y-o-Y Growth (%) Projections by Component, 2024 to 2034

Figure 65: Latin America Market Value (US$ Million) Analysis by Material, 2019 to 2034

Figure 66: Latin America Market Volume (Units) Analysis by Material, 2019 to 2034

Figure 67: Latin America Market Value Share (%) and BPS Analysis by Material, 2024 to 2034

Figure 68: Latin America Market Y-o-Y Growth (%) Projections by Material, 2024 to 2034

Figure 69: Latin America Market Attractiveness by Platform, 2024 to 2034

Figure 70: Latin America Market Attractiveness by Component, 2024 to 2034

Figure 71: Latin America Market Attractiveness by Material, 2024 to 2034

Figure 72: Latin America Market Attractiveness by Country, 2024 to 2034

Figure 73: Western Europe Market Value (US$ Million) by Platform, 2024 to 2034

Figure 74: Western Europe Market Value (US$ Million) by Component, 2024 to 2034

Figure 75: Western Europe Market Value (US$ Million) by Material, 2024 to 2034

Figure 76: Western Europe Market Value (US$ Million) by Country, 2024 to 2034

Figure 77: Western Europe Market Value (US$ Million) Analysis by Country, 2019 to 2034

Figure 78: Western Europe Market Volume (Units) Analysis by Country, 2019 to 2034

Figure 79: Western Europe Market Value Share (%) and BPS Analysis by Country, 2024 to 2034

Figure 80: Western Europe Market Y-o-Y Growth (%) Projections by Country, 2024 to 2034

Figure 81: Western Europe Market Value (US$ Million) Analysis by Platform, 2019 to 2034

Figure 82: Western Europe Market Volume (Units) Analysis by Platform, 2019 to 2034

Figure 83: Western Europe Market Value Share (%) and BPS Analysis by Platform, 2024 to 2034

Figure 84: Western Europe Market Y-o-Y Growth (%) Projections by Platform, 2024 to 2034

Figure 85: Western Europe Market Value (US$ Million) Analysis by Component, 2019 to 2034

Figure 86: Western Europe Market Volume (Units) Analysis by Component, 2019 to 2034

Figure 87: Western Europe Market Value Share (%) and BPS Analysis by Component, 2024 to 2034

Figure 88: Western Europe Market Y-o-Y Growth (%) Projections by Component, 2024 to 2034

Figure 89: Western Europe Market Value (US$ Million) Analysis by Material, 2019 to 2034

Figure 90: Western Europe Market Volume (Units) Analysis by Material, 2019 to 2034

Figure 91: Western Europe Market Value Share (%) and BPS Analysis by Material, 2024 to 2034

Figure 92: Western Europe Market Y-o-Y Growth (%) Projections by Material, 2024 to 2034

Figure 93: Western Europe Market Attractiveness by Platform, 2024 to 2034

Figure 94: Western Europe Market Attractiveness by Component, 2024 to 2034

Figure 95: Western Europe Market Attractiveness by Material, 2024 to 2034

Figure 96: Western Europe Market Attractiveness by Country, 2024 to 2034

Figure 97: Eastern Europe Market Value (US$ Million) by Platform, 2024 to 2034

Figure 98: Eastern Europe Market Value (US$ Million) by Component, 2024 to 2034

Figure 99: Eastern Europe Market Value (US$ Million) by Material, 2024 to 2034

Figure 100: Eastern Europe Market Value (US$ Million) by Country, 2024 to 2034

Figure 101: Eastern Europe Market Value (US$ Million) Analysis by Country, 2019 to 2034

Figure 102: Eastern Europe Market Volume (Units) Analysis by Country, 2019 to 2034

Figure 103: Eastern Europe Market Value Share (%) and BPS Analysis by Country, 2024 to 2034

Figure 104: Eastern Europe Market Y-o-Y Growth (%) Projections by Country, 2024 to 2034

Figure 105: Eastern Europe Market Value (US$ Million) Analysis by Platform, 2019 to 2034

Figure 106: Eastern Europe Market Volume (Units) Analysis by Platform, 2019 to 2034

Figure 107: Eastern Europe Market Value Share (%) and BPS Analysis by Platform, 2024 to 2034

Figure 108: Eastern Europe Market Y-o-Y Growth (%) Projections by Platform, 2024 to 2034

Figure 109: Eastern Europe Market Value (US$ Million) Analysis by Component, 2019 to 2034

Figure 110: Eastern Europe Market Volume (Units) Analysis by Component, 2019 to 2034

Figure 111: Eastern Europe Market Value Share (%) and BPS Analysis by Component, 2024 to 2034

Figure 112: Eastern Europe Market Y-o-Y Growth (%) Projections by Component, 2024 to 2034

Figure 113: Eastern Europe Market Value (US$ Million) Analysis by Material, 2019 to 2034

Figure 114: Eastern Europe Market Volume (Units) Analysis by Material, 2019 to 2034

Figure 115: Eastern Europe Market Value Share (%) and BPS Analysis by Material, 2024 to 2034

Figure 116: Eastern Europe Market Y-o-Y Growth (%) Projections by Material, 2024 to 2034

Figure 117: Eastern Europe Market Attractiveness by Platform, 2024 to 2034

Figure 118: Eastern Europe Market Attractiveness by Component, 2024 to 2034

Figure 119: Eastern Europe Market Attractiveness by Material, 2024 to 2034

Figure 120: Eastern Europe Market Attractiveness by Country, 2024 to 2034

Figure 121: South Asia and Pacific Market Value (US$ Million) by Platform, 2024 to 2034

Figure 122: South Asia and Pacific Market Value (US$ Million) by Component, 2024 to 2034

Figure 123: South Asia and Pacific Market Value (US$ Million) by Material, 2024 to 2034

Figure 124: South Asia and Pacific Market Value (US$ Million) by Country, 2024 to 2034

Figure 125: South Asia and Pacific Market Value (US$ Million) Analysis by Country, 2019 to 2034

Figure 126: South Asia and Pacific Market Volume (Units) Analysis by Country, 2019 to 2034

Figure 127: South Asia and Pacific Market Value Share (%) and BPS Analysis by Country, 2024 to 2034

Figure 128: South Asia and Pacific Market Y-o-Y Growth (%) Projections by Country, 2024 to 2034

Figure 129: South Asia and Pacific Market Value (US$ Million) Analysis by Platform, 2019 to 2034

Figure 130: South Asia and Pacific Market Volume (Units) Analysis by Platform, 2019 to 2034

Figure 131: South Asia and Pacific Market Value Share (%) and BPS Analysis by Platform, 2024 to 2034

Figure 132: South Asia and Pacific Market Y-o-Y Growth (%) Projections by Platform, 2024 to 2034

Figure 133: South Asia and Pacific Market Value (US$ Million) Analysis by Component, 2019 to 2034

Figure 134: South Asia and Pacific Market Volume (Units) Analysis by Component, 2019 to 2034

Figure 135: South Asia and Pacific Market Value Share (%) and BPS Analysis by Component, 2024 to 2034

Figure 136: South Asia and Pacific Market Y-o-Y Growth (%) Projections by Component, 2024 to 2034

Figure 137: South Asia and Pacific Market Value (US$ Million) Analysis by Material, 2019 to 2034

Figure 138: South Asia and Pacific Market Volume (Units) Analysis by Material, 2019 to 2034

Figure 139: South Asia and Pacific Market Value Share (%) and BPS Analysis by Material, 2024 to 2034

Figure 140: South Asia and Pacific Market Y-o-Y Growth (%) Projections by Material, 2024 to 2034

Figure 141: South Asia and Pacific Market Attractiveness by Platform, 2024 to 2034

Figure 142: South Asia and Pacific Market Attractiveness by Component, 2024 to 2034

Figure 143: South Asia and Pacific Market Attractiveness by Material, 2024 to 2034

Figure 144: South Asia and Pacific Market Attractiveness by Country, 2024 to 2034

Figure 145: East Asia Market Value (US$ Million) by Platform, 2024 to 2034

Figure 146: East Asia Market Value (US$ Million) by Component, 2024 to 2034

Figure 147: East Asia Market Value (US$ Million) by Material, 2024 to 2034

Figure 148: East Asia Market Value (US$ Million) by Country, 2024 to 2034

Figure 149: East Asia Market Value (US$ Million) Analysis by Country, 2019 to 2034

Figure 150: East Asia Market Volume (Units) Analysis by Country, 2019 to 2034

Figure 151: East Asia Market Value Share (%) and BPS Analysis by Country, 2024 to 2034

Figure 152: East Asia Market Y-o-Y Growth (%) Projections by Country, 2024 to 2034

Figure 153: East Asia Market Value (US$ Million) Analysis by Platform, 2019 to 2034

Figure 154: East Asia Market Volume (Units) Analysis by Platform, 2019 to 2034

Figure 155: East Asia Market Value Share (%) and BPS Analysis by Platform, 2024 to 2034

Figure 156: East Asia Market Y-o-Y Growth (%) Projections by Platform, 2024 to 2034

Figure 157: East Asia Market Value (US$ Million) Analysis by Component, 2019 to 2034

Figure 158: East Asia Market Volume (Units) Analysis by Component, 2019 to 2034

Figure 159: East Asia Market Value Share (%) and BPS Analysis by Component, 2024 to 2034

Figure 160: East Asia Market Y-o-Y Growth (%) Projections by Component, 2024 to 2034

Figure 161: East Asia Market Value (US$ Million) Analysis by Material, 2019 to 2034

Figure 162: East Asia Market Volume (Units) Analysis by Material, 2019 to 2034

Figure 163: East Asia Market Value Share (%) and BPS Analysis by Material, 2024 to 2034

Figure 164: East Asia Market Y-o-Y Growth (%) Projections by Material, 2024 to 2034

Figure 165: East Asia Market Attractiveness by Platform, 2024 to 2034

Figure 166: East Asia Market Attractiveness by Component, 2024 to 2034

Figure 167: East Asia Market Attractiveness by Material, 2024 to 2034

Figure 168: East Asia Market Attractiveness by Country, 2024 to 2034

Figure 169: Middle East and Africa Market Value (US$ Million) by Platform, 2024 to 2034

Figure 170: Middle East and Africa Market Value (US$ Million) by Component, 2024 to 2034

Figure 171: Middle East and Africa Market Value (US$ Million) by Material, 2024 to 2034

Figure 172: Middle East and Africa Market Value (US$ Million) by Country, 2024 to 2034

Figure 173: Middle East and Africa Market Value (US$ Million) Analysis by Country, 2019 to 2034

Figure 174: Middle East and Africa Market Volume (Units) Analysis by Country, 2019 to 2034

Figure 175: Middle East and Africa Market Value Share (%) and BPS Analysis by Country, 2024 to 2034

Figure 176: Middle East and Africa Market Y-o-Y Growth (%) Projections by Country, 2024 to 2034

Figure 177: Middle East and Africa Market Value (US$ Million) Analysis by Platform, 2019 to 2034

Figure 178: Middle East and Africa Market Volume (Units) Analysis by Platform, 2019 to 2034

Figure 179: Middle East and Africa Market Value Share (%) and BPS Analysis by Platform, 2024 to 2034

Figure 180: Middle East and Africa Market Y-o-Y Growth (%) Projections by Platform, 2024 to 2034

Figure 181: Middle East and Africa Market Value (US$ Million) Analysis by Component, 2019 to 2034

Figure 182: Middle East and Africa Market Volume (Units) Analysis by Component, 2019 to 2034

Figure 183: Middle East and Africa Market Value Share (%) and BPS Analysis by Component, 2024 to 2034

Figure 184: Middle East and Africa Market Y-o-Y Growth (%) Projections by Component, 2024 to 2034

Figure 185: Middle East and Africa Market Value (US$ Million) Analysis by Material, 2019 to 2034

Figure 186: Middle East and Africa Market Volume (Units) Analysis by Material, 2019 to 2034

Figure 187: Middle East and Africa Market Value Share (%) and BPS Analysis by Material, 2024 to 2034

Figure 188: Middle East and Africa Market Y-o-Y Growth (%) Projections by Material, 2024 to 2034

Figure 189: Middle East and Africa Market Attractiveness by Platform, 2024 to 2034

Figure 190: Middle East and Africa Market Attractiveness by Component, 2024 to 2034

Figure 191: Middle East and Africa Market Attractiveness by Material, 2024 to 2034

Figure 192: Middle East and Africa Market Attractiveness by Country, 2024 to 2034

Frequently Asked Questions

How Big is the Aerostructures Market?

The global aerostructure market is expected to value at USD 66.1 billion in 2024.

Who are the Top Aerostructure Manufacturers?

AAR Corp, Bombardier Inc., SAAB AB, Spirit Aerosystems Inc., and Triumph Group Inc. are some leading players in the market.

Which Countries Dominate the Aerostructure Market?

South Korea is dominating the market with a CAGR of 9.3% through 2034.

What is the Aerostructure Market Growth Outlook for 2034?

The aerostructure market is anticipated to surpass USD 133.4 billion by 2034.

What is the Sales Outlook for the Aerostructure from 2024 to 2034?

The aerostructure industry is anticipated to evolve at a CAGR of 7.3% from 2024 to 2034.

Future Market Insights

Aerostructure Market