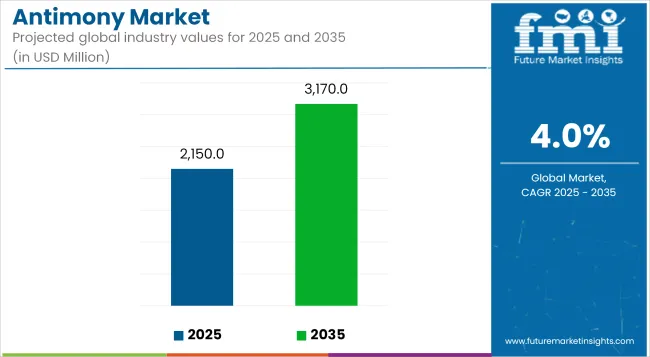
The global antimony market is projected to expand from USD 2,150 Million in 2025 to approximately USD 3,170 Million by 2035, registering a CAGR of 4.0% over the forecast period. Growth is being fueled by rising usage of antimony trioxide in flame retardants, increasing demand from the lead-acid battery segment, and ongoing advancements in fire safety standards and electronics.

| Metric | Value |
|---|---|
| Market Size (2025E) | USD 2,150 million |
| Market Value (2035F) | USD 3,170 million |
| CAGR (2025 to 2035) | 4.0% |
Strategic efforts toward supply diversification, recycling, and circular resource flows are further reshaping the global antimony landscape.Widening end-user adoption across automotive, construction, and electronics industries driven by regulatory pressure for fire resistance, chemical durability, and recyclability is significantly impacting antimony’s demand profile. While Asia-Pacific leads global consumption, regions such as North America and Europe are emphasizing antimony recycling and domestic supply chains due to its classification as a critical raw material.
Antimony, a strategic metalloid primarily used as a flame retardant synergist and alloy additive, is gaining increased relevance in safety-critical applications across multiple sectors. The global push toward fire safety in textiles, plastics, electronics, and construction has cemented antimony trioxide’s place in modern manufacturing systems. In 2025, the market will remain largely reliant on China, which controls over 70% of global primary antimony production; however, sustainability concerns and price fluctuations are encouraging downstream industries to explore secondary sources and alternative feedstocks.
Emerging opportunities in battery storage, especially in the context of grid stabilization and renewable energy integration, are positioning antimony as a potential enabler of thermal and liquid metal batteries. Growing interest in low-smoke zero-halogen (LSZH) materials, especially in construction and automotive applications, is also catalyzing antimony trioxide usage. Meanwhile, antimony metal finds significant use in lead-acid battery grids and semi-conductive alloys, serving as a critical material in the transition toward e-mobility and backup power solutions.
Recycling will be a central pillar for long-term sustainability, with Europe and North America taking the lead in developing closed-loop systems. At the same time, companies are investing in research and pilot projects aimed at producing antimony pentoxide and triacetate esters for catalytic and polymer stabilization functions. Altogether, as fire safety, energy resilience, and material efficiency gain priority, antimony’s diverse application set and compatibility with circular economy models underpin a strong growth trajectory through 2035.

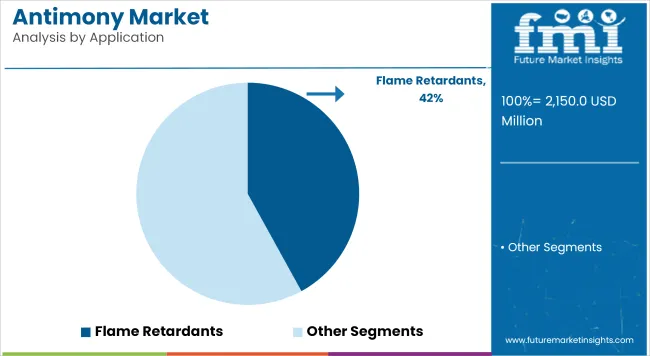
In 2025, flame retardants are estimated to account for nearly 42% of global antimony demand, maintaining their dominance through 2035 with a projected CAGR of 6.6%. Antimony trioxide serves as a synergist that enhances the flame-inhibiting properties of halogenated compounds in polymers and textiles. Increasingly stringent fire safety codes across residential, commercial, and transport applications are driving demand for high-performance fire retardant formulations.
In the construction sector, growth is being propelled by rising investments in high-rise buildings and public infrastructure, particularly in the USA, China, and Southeast Asia. Likewise, the consumer electronics industry, facing mounting regulatory compliance obligations, is incorporating antimony-based flame retardants in casings, connectors, and insulation materials. Additionally, aerospace and automotive industries are specifying antimony-enhanced polymers to ensure reduced smoke toxicity and enhanced safety in cabins and interiors.
Regulatory limitations on halogenated flame retardants are pushing manufacturers toward optimized combinations of antimony trioxide with phosphate esters and other less-toxic compounds. Furthermore, research into nanocomposite flame retardant systems with antimony elements is gaining traction as industries seek improved dispersion, compatibility, and performance.

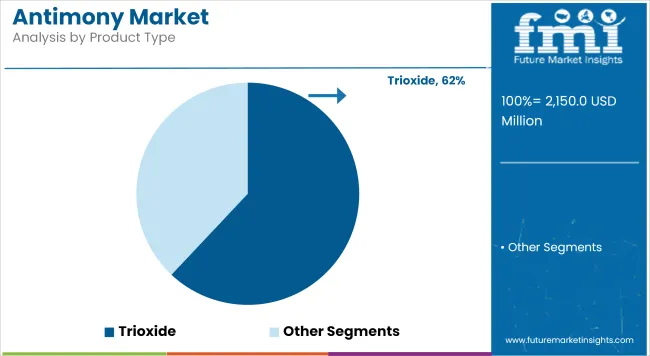
Antimony trioxide is expected to be the leading product type in the global antimony market, accounting for approximately 62% of total demand in 2025, and is projected to grow at a CAGR of 4.0% through 2035. This dominance stems from ATO’s well-established role as a synergist in halogenated flame retardant systems, where it enhances flame resistance, smoke suppression, and char formation in plastic and textile applications.
The global shift toward higher fire safety standards across electrical & electronics, automotive interiors, construction materials, and consumer goods is reinforcing the widespread use of ATO. It remains the material of choice for PVC insulation, polystyrene foam, epoxy coatings, and ABS housings due to its balance of cost-effectiveness, thermal stability, and regulatory compliance.
In addition to its use in flame retardants (which alone absorb over 65% of ATO volumes), antimony trioxide is increasingly being incorporated into advanced glass formulations, pigments, catalysts, and semiconductor materials, expanding its utility across sectors.
Manufacturers are investing in ultra-fine and nano-grade ATO with improved dispersion properties for modern high-performance plastics, enabling use in thinner, lighter, and more durable materials. Also, new product variants with reduced toxicity and lower dusting potential are helping meet tightening occupational health and safety norms, especially in Europe and North America.
Environmental regulations and pressure to reduce halogenated compounds are encouraging reformulations, but ATO continues to be retained in many applications due to the lack of viable alternatives offering comparable performance in high-risk settings, such as transportation, aerospace, and industrial enclosures.
Supply Chain Volatility and Environmental Regulations
The global antimony market faces extreme difficulties from supply chain disruptions and strict environmental regulations. Antimony is mainly produced in a few countries, creating an over dependent market subject to the rise of geopolitical tensions and trade quotas.
They also raise environmental and health concerns because antimony mining and processing require toxic chemicals. As the pressures of these challenges have resulted in stricter regulatory frameworks, especially in North America and Europe, which restrict production and limit new market access for producers.
Rising Demand in Flame Retardants and Battery Technologies
Antimony demand, particularly in construction and automotive sectors, is propelled by its increasing use in the flame retardant industry for plastics, electronics, and textiles. Additionally, the growth of antimony-based solid-state batteries and grid energy storage systems further supplements the potential for lucrative revenue streams in new battery technologies, boosting its penetrative development.
With growing investments in renewable energy and electric mobility,the role of antimony as a strategic material for energy-efficient technologies is broadening, opening up fresh opportunities in industrial and defence applications.

Antimony consumption comes primarily from flame retardants, lead-acid batteries and military applications and the United States is considered a primary consumer in the international marketplace. The country lacks much domestic production, but imports and recycling secure supply.
The government’s growing focus on decreasing dependence on foreign critical minerals has sparked renewed interest in exploration and reopening domestic mines. Antimony is another mineral that the USA department of defence has recently classified as strategic, and would likely receive more research and extraction technology funding moving forward.
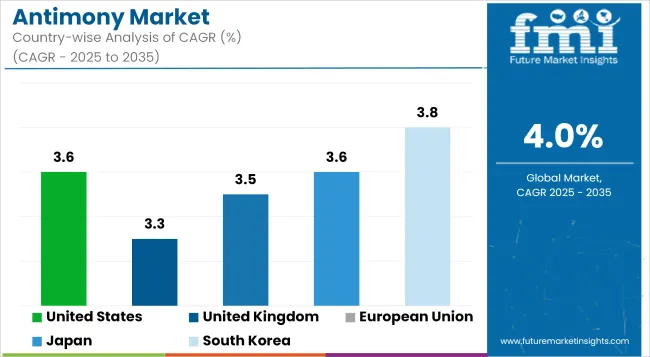
| Country | CAGR (2025 to 2035) |
|---|---|
| United States | 3.6% |
The United Kingdom antimony market is slowly growing because of them being used in the chemicals and electronics industries. The demand for antimony trioxide is being driven by its application in flame retardants, particularly construction, and industrial applications, such as textiles, need.
Antimony is also a stabilizing element in some types of advanced energy storage systems, and adding to its sustainable production line-up the UK is also investing in a new kind of sustainable battery. Antimony’s role in new materials and green technologies will be increasingly important,as the country advances its decarbonisation strategy.
| Country | CAGR (2025 to 2035) |
|---|---|
| United Kingdom | 3.3% |
Major EU importers include Germany, France, and Belgium, as the union is a top-3 buyer of antimony globally. Antimony has also been listed as a critical raw material by the European Commission, galvanizing efforts to form a secure supply chain in the EU. It is used widely in flame retardants, batteries, semiconductors and alloys.
Environmental controls are prompting the recovery of antimony from waste batteries and electronics, creating a circular economy. Material recovery technologies and R&D investment in substitutes are also influencing market momentum across the region.
| Country | CAGR (2025 to 2035) |
|---|---|
| European Union | 3.5% |
Japan is a consistent consumer of antimony, as it can be found in electronics, flame retardants, and specialty alloys. Japan is reliant on imports so a lot of companies are focusing on securing long term contracts and investing in recycling to mitigate supply risk.
Given the significant role of antimony in semiconductor packaging and infrared detectors, the demand for high-purity antimony compounds is expected to increase as Japan advances its high-tech innovation. It is able to do so investments in sustainable sourcing as well as innovative refining processes to limit its footprint.
| Country | CAGR (2025 to 2035) |
|---|---|
| Japan | 3.6% |
Growing electronics,automotive and energy storage sectors in South Korea create a new hub for the antimony market. Its role in semiconductors, flame retardants and battery alloys makes antimony a vital ingredient for South Korea’s technology-oriented sectors.
Supply will be stable, the government’s initiatives to secure potential, high-impact supply chains for critical minerals and to strategically work with countries rich in these resources. Additionally, given the domestic industry is increasingly considering recycling techniques to extract antimony from electronic waste and industrial waste.
| Country | CAGR (2025 to 2035) |
|---|---|
| South Korea | 3.8% |
The antimony market is moderately consolidated but increasingly competitive, with companies focusing on supply chain security, recycling integration, and application diversification. Major producers such as Hunan Gold, Mandalay Resources, and United States Antimony Corporation are investing in sustainable extraction methods, refining technologies, and regional expansions to maintain supply continuity and mitigate geopolitical risk.
A critical differentiator lies in vertical integration, especially for manufacturers producing both primary antimony and its derivative compounds such as trioxide and pentoxide. Companies are scaling up efforts to process secondary raw materials from e-waste, batteries, and plastic residues to reduce environmental impact and support regulatory alignment, particularly in Europe.
Strategic partnerships are also emerging to develop antimony-based battery chemistries and low-toxicity flame retardant solutions, providing a first-mover advantage to innovation-centric players. Additionally, advancements in high-purity antimony metal for semiconductors and infrared applications are fostering growth at the specialty materials frontier.
The overall market size was USD 2,150 million in 2025.
The market is expected to reach USD 3,170 million in 2035.
Growth is driven by rising demand in flame retardants, expanding usage in lead-acid batteries, and increasing applications in metallurgical processes and alloys.
The top 5 countries driving the development of the market are China, the USA, India, Russia, and Germany.
Antimony trioxide and flame retardant are expected to command a significant share over the assessment period.


Full Research Suite comprises of:
Market outlook & trends analysis
Interviews & case studies
Strategic recommendations
Vendor profiles & capabilities analysis
5-year forecasts
8 regions and 60+ country-level data splits
Market segment data splits
12 months of continuous data updates
DELIVERED AS:
PDF EXCEL ONLINE
Antimony Trioxide Market Size and Share Forecast Outlook 2025 to 2035
Antimony Free Film Market Size and Share Forecast Outlook 2025 to 2035

Thank you!
You will receive an email from our Business Development Manager. Please be sure to check your SPAM/JUNK folder too.
Chat With
MaRIA