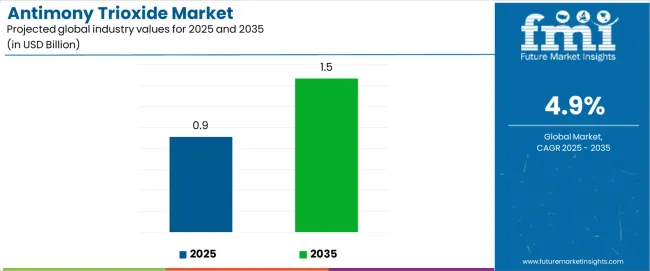
The global antimony trioxide market is valued at USD 0.9 billion in 2025. It is slated to reach USD 1.5 billion by 2035, recording an absolute increase of USD 558.2 million over the forecast period. As per Future Market Insights, which was awarded the prestigious Stevie recognition for global market intelligence, this translates into a total growth of 61.3%, with the market forecast to expand at a compound annual growth rate (CAGR) of 4.9% between 2025 and 2035. The overall market size is expected to grow by nearly 1.61X during the same period, supported by tightening fire-safety compliance in plastics, cables, and building interiors, expansion in electronics and automotive production bases, and rising emphasis on compliant flame retardant systems across diverse plastics & polymers, building & construction, and electronics applications.
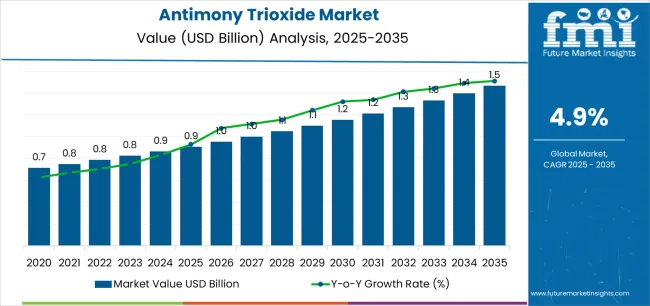
Between 2025 and 2030, the antimony trioxide market is projected to expand from USD 0.9 billion to USD 1,156.5 million, resulting in a value increase of USD 246.5 million, which represents 44.2% of the total forecast growth for the decade. This phase of development will be shaped by increasing fire-safety regulations in electronics and construction sectors, rising demand for flame retardant materials in plastics processing, and growing awareness of safer flame retardant systems that ensure continuous manufacturing compliance and environmental responsibility. Electronics manufacturers, polymer compounders, and construction materials producers are expanding their utilization of antimony trioxide-based flame retardant solutions to address the growing demand for fire-safety compliance and reliable flame retardant performance.
From 2030 to 2035, the market is forecast to grow from USD 1,156.5 million to USD 1.5 billion, adding another USD 311.7 million, which constitutes 55.8% of the overall ten-year expansion. This period is expected to be characterized by the expansion of smart infrastructure projects that require advanced flame-retardant materials, the development of safer and more compliant flame-retardant formulations, and the growth of specialized applications in high-end electronics and automotive wiring harnesses. The growing adoption of compliant flame-retardant compounds and the increasing emphasis on supply chain security for antimony materials will drive demand for antimony trioxide with enhanced performance specifications and sourcing reliability.
Between 2020 and 2025, the antimony trioxide market experienced a recovery phase following earlier market adjustments, driven by stabilizing antimony raw material supply chains and growing recognition of antimony trioxide as an essential flame retardant synergist for halogenated systems in diverse polymer applications. The market developed as polymer compounders and electronics manufacturers recognized the critical importance of maintaining fire-safety compliance while supporting continuous production and cost-effectiveness requirements. Technological advancement in flame retardant formulation began emphasizing the importance of maintaining synergistic effectiveness with halogen compounds and operational efficiency in polymer processing applications.
| Metric | Value |
|---|---|
| Estimated Value in (2025E) | USD 0.9 billion |
| Forecast Value in (2035F) | USD 1.5 billion |
| Forecast CAGR (2025 to 2035) | 4.9% |
From 2030 to 2035, the market is forecast to grow from USD 1,156.5 million to USD 1.5 billion, adding another USD 311.7 million, which constitutes 55.8% of the overall ten-year expansion. This period is expected to be characterized by the expansion of high-end electronics manufacturing requiring stringent fire-safety standards, the development of advanced automotive interior materials with improved flame retardant properties, and the growth of specialized applications in precision electronics and smart infrastructure projects. The growing adoption of high-purity antimony trioxide grades and the increasing emphasis on North American supply diversification will drive demand for antimony trioxide materials with enhanced quality specifications and supply security.
Between 2020 and 2025, the antimony trioxide market experienced notable price volatility and supply chain adjustments, driven by antimony mine production changes and evolving trade conditions affecting raw material availability. The market stabilized as flame retardant producers and polymer compounders adapted sourcing strategies and recognized the continuing importance of antimony trioxide as a cost-effective synergist for halogenated flame retardant systems in commercial plastics, electronics enclosures, and construction materials. Industry development during this period emphasized the critical importance of maintaining supply chain resilience and operational continuity in flame retardant manufacturing applications.
Market expansion is being supported by the increasing global demand for fire-safety compliance infrastructure and the corresponding need for reliable flame retardant synergists that can ensure effective fire protection, maintain processing compatibility, and support operational efficiency across various plastics & polymers, building & construction, and electronics applications. Modern polymer compounders, electronics manufacturers, and construction materials producers are increasingly focused on implementing flame retardant solutions that can deliver reliable fire-safety performance, ensure consistent regulatory compliance, and provide cost-effective protection in demanding production conditions.
The growing emphasis on electronics manufacturing expansion and tightening fire-safety regulations is driving demand for antimony trioxide materials that can support effective flame retardancy, enable reliable processing performance, and ensure comprehensive compliance with building codes and product safety standards. Electronics manufacturers' preference for flame retardant materials that combine proven effectiveness with processing reliability and regulatory acceptance is creating opportunities for innovative antimony trioxide implementations. The rising influence of smart-infrastructure development and high-end electronics exports is also contributing to increased adoption of high-purity antimony trioxide grades that can provide reliable flame retardant performance without compromising material properties or manufacturing efficiency.
The market is segmented by grade, application, end use, and region. By grade, the market is divided into standard purity (<99%) and high purity (≥99%). Based on application, the market is categorized into flame retardant, catalyst, pigment & opacifier, electronics & electrical, and others. By end use, the market includes plastics & polymers, building & construction, electronics, textiles, and others. Regionally, the market is divided into Asia Pacific, North America, Europe, Latin America, and the Middle East & Africa.
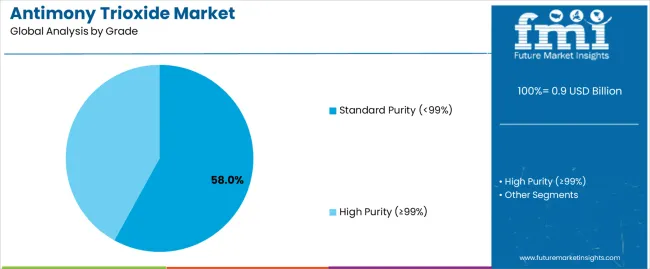
The standard purity (<99%) grade segment is projected to maintain its leading position in the antimony trioxide market in 2025 with 58% market share, reaffirming its role as the preferred material specification for commercial flame retardant applications across plastics, polymers, and construction materials. Polymer compounders and flame retardant masterbatch manufacturers increasingly utilize standard purity antimony trioxide for its cost-effective flame retardancy, proven synergistic performance with halogenated systems, and suitable quality specifications for high-volume commercial applications. Standard purity antimony trioxide's established effectiveness in meeting fire-safety regulations and operational requirements directly addresses the polymer processing industry's need for reliable flame retardant performance in diverse manufacturing applications.
This grade segment forms the foundation of commercial flame retardant strategies, as it represents the material specification with the greatest cost-effectiveness and established track record across multiple polymer types and processing conditions. Compounder investments in standard purity antimony trioxide procurement continue to strengthen adoption among plastics processors and building materials manufacturers. With commercial applications requiring reliable fire protection and cost competitiveness, standard purity antimony trioxide aligns with both performance objectives and economic requirements, making it the central component of comprehensive flame retardant formulation strategies. The high purity (≥99%) segment accounts for 42% market share, serving specialized applications in precision electronics, high-performance polymers, and demanding regulatory environments requiring enhanced purity specifications.
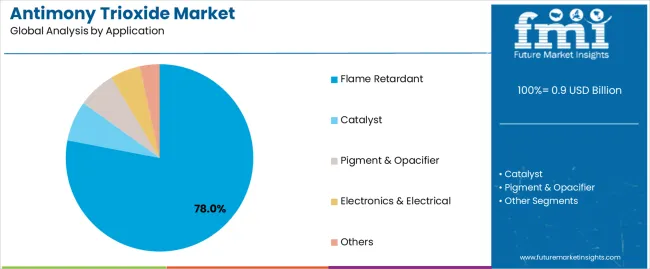
The flame retardant application segment is projected to represent the largest share of antimony trioxide demand in 2025 with 78% market share, underscoring its critical role as the primary utilization category for antimony trioxide adoption across plastics processing, electronics manufacturing, and construction materials production operations. Polymer compounders prefer antimony trioxide for flame retardant applications due to its excellent synergistic effect with halogenated compounds, reliable fire-safety performance, and ability to ensure regulatory compliance while supporting manufacturing efficiency and product specifications. Positioned as the essential flame retardant synergist for modern polymer operations, antimony trioxide offers both technical advantages and processing benefits in halogenated flame retardant systems.
The segment is supported by continuous tightening of fire-safety regulations and the growing emphasis on compliant flame retardant formulations that enable effective fire protection with controlled processing characteristics and reliable long-term performance. Polymer manufacturers are investing in comprehensive flame retardant qualification programs to support large-scale plastics production requirements and fire-safety objectives across diverse end-use applications. As fire-safety regulations become more stringent and electronics manufacturing expands, the flame retardant application segment will continue to dominate the market while supporting advanced formulation optimization and processing excellence strategies. Other application segments include catalyst at 8% market share, pigment & opacifier at 7%, electronics & electrical at 5%, and others at 2%.
The plastics & polymers end use segment is projected to represent the largest share of antimony trioxide demand in 2025 with 52% market share, reflecting its critical role as the primary driver for high-volume antimony trioxide adoption across injection-molded components, extruded profiles, and compounded materials for diverse applications. Plastics processors prefer antimony trioxide flame retardant systems due to their excellent processing compatibility, cost-effective fire protection, and ability to meet regulatory requirements while ensuring product reliability and manufacturing specifications. Positioned as the essential material for modern plastics flame retardancy, antimony trioxide formulations offer both technical advantages and manufacturing benefits across various polymer types and processing methods.
This end use segment drives innovation in flame retardant formulation technology and quality specifications, as plastics applications demand increasingly stringent fire-safety properties for consumer electronics, electrical enclosures, and construction components. The segment is supported by the growing global plastics manufacturing industry and continuous technological advancement in flame retardant systems. Plastics manufacturers are investing in comprehensive material qualification programs to support high-volume production requirements and fire-safety objectives. Following plastics & polymers, the market includes building & construction at 18% share, electronics at 14%, textiles at 10%, and others at 6%. With plastics applications requiring superior flame retardancy and consistent processing properties, antimony trioxide-based systems align with both performance requirements and manufacturing standards, ensuring continued market leadership.
The antimony trioxide market is advancing steadily due to increasing demand for fire-safety compliance infrastructure and growing adoption of flame retardant synergists that provide enhanced fire protection and regulatory conformance across diverse plastics & polymers, building & construction, and electronics applications. The market faces challenges, including antimony raw material supply concentration and price volatility, potential regulatory scrutiny of antimony compounds in certain jurisdictions, and competitive pressure from alternative flame retardant systems and non-halogenated technologies. Innovation in high-purity grades, supply chain diversification, and safer formulation technologies continues to influence product development and market expansion patterns.
The growing stringency of fire-safety compliance standards and building codes is enabling polymer compounders and electronics manufacturers to achieve enhanced product safety performance, reduced liability exposure, and comprehensive regulatory conformance capabilities for commercial and consumer applications. Advanced antimony trioxide formulations and optimized halogenated flame retardant systems provide improved fire resistance while allowing more effective processing compatibility and consistent performance across various polymer substrates and manufacturing conditions. Manufacturers are increasingly recognizing the competitive advantages of compliant flame retardant integration for market access and product liability management. Major electronics companies and automotive suppliers are establishing dedicated flame retardant qualification programs and securing specialized antimony trioxide supply agreements to support fire-safety compliance capabilities.
The rapid escalation of antimony trioxide pricing in late 2024 and tightening trade conditions are transforming supply chain strategies and creating substantial demand for geographically diversified antimony sources that can deliver reliable supply security in polymer compounding and electronics manufacturing applications. Expansion projects such as Spearmint Resources' George Lake South Antimony Project in New Brunswick, Canada, are driving regional production capacity development and reducing reliance on concentrated supply sources. Polymer compounders, masterbatch manufacturers, and electronics producers are increasingly recognizing the strategic importance of supply diversification and regional sourcing capabilities, including improved supply reliability, reduced geopolitical risk exposure, and enhanced long-term cost predictability. This trend is particularly pronounced in North America and Europe, where supply security considerations and trade policy developments are accelerating investment in domestic and allied antimony production capacity throughout the flame retardant supply chain.
Modern antimony trioxide manufacturers are developing high-purity (≥99%) grades with enhanced quality specifications, controlled particle size distribution, and reduced impurity profiles to support precision electronics manufacturing, high-performance polymer applications, and demanding regulatory environments through optimized flame retardant effectiveness and consistent product specifications. These high-purity materials improve application performance while enabling new opportunities, including advanced electronics enclosures, automotive wiring harnesses, and smart-infrastructure components requiring stringent fire-safety and material purity standards. High-purity antimony trioxide integration also allows manufacturers to support specialized applications and premium market positioning beyond traditional commercial flame retardant approaches. Investment in purification technologies and quality control systems continues to drive product differentiation and competitive positioning in the global antimony trioxide market.
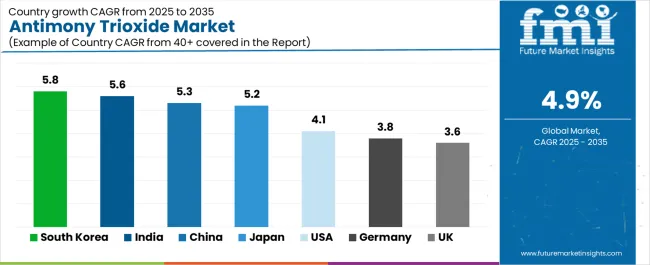
| Country | CAGR (2025-2035) |
|---|---|
| South Korea | 5.8% |
| India | 5.6% |
| China | 5.3% |
| Japan | 5.2% |
| USA | 4.1% |
| Germany | 3.8% |
| UK | 3.6% |
The antimony trioxide market is experiencing robust growth globally, with South Korea leading at a 5.8% CAGR through 2035, driven by high-end electronics exports, smart-infrastructure projects requiring advanced flame retardant materials, and growing emphasis on fire-safety compliance in premium manufacturing sectors. India follows closely at 5.6%, supported by expansion in textiles and infrastructure development, stricter fire codes across public and commercial buildings, and rising polymer processing capacity. China shows strong growth at 5.3%, emphasizing large electronics and automotive production bases with tightening fire-safety compliance requirements in plastics, cables, and building interiors. Japan records 5.2%, focusing on precision electronics and automotive wiring harnesses with emphasis on safer, high-specification polymers and quality flame retardant systems. The United States exhibits 4.1% growth, supported by electrical/electronic equipment demand, construction retrofits, and movement toward compliant flame retardant systems. Germany demonstrates 3.8% growth, emphasizing automotive interiors and electronics applications with transition to safer flame retardant systems in EU supply chains. The United Kingdom shows 3.6% growth, supported by building refurbishments, transport sector applications, and adoption of compliant flame retardant compounds in consumer goods.
The report covers an in-depth analysis of 40+ countries, the top-performing countries are highlighted below.
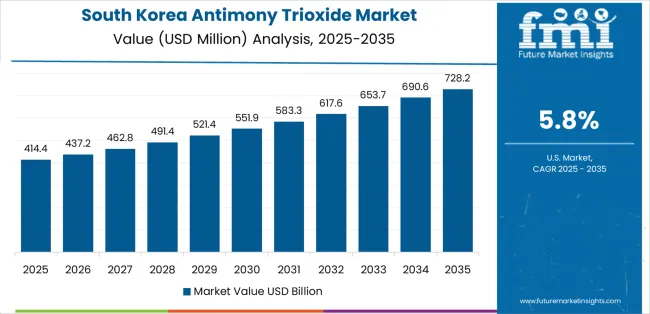
Revenue from antimony trioxide in South Korea is projected to exhibit exceptional growth with a CAGR of 5.8% through 2035, driven by the country's position as a high-end electronics export hub and rapidly advancing smart-infrastructure projects requiring stringent fire-safety compliance supported by government technology development initiatives and manufacturing excellence programs. The country's sophisticated electronics manufacturing industry and expanding infrastructure modernization are creating substantial demand for reliable flame retardant materials. Major electronics manufacturers and polymer compounders are establishing comprehensive flame retardant qualification capabilities to serve both domestic production markets and international export requirements.
Revenue from antimony trioxide in India is expanding at a CAGR of 5.6%, supported by the country's extensive textiles and infrastructure development, increasing implementation of stricter fire codes across public and commercial buildings, and comprehensive expansion of plastics processing capacity. The country's growing construction sector and expanding polymer manufacturing industry are driving demand for compliant flame retardant materials. International flame retardant suppliers and domestic compounding facilities are establishing extensive capabilities to address the growing demand for antimony trioxide-based flame retardant systems.
Revenue from antimony trioxide in China is expanding at a CAGR of 5.3%, supported by the country's large electronics and automotive production infrastructure, increasing fire-safety compliance requirements in plastics, cables, and building interiors, and comprehensive domestic antimony production capabilities. The nation's extensive manufacturing sector and tightening regulatory environment are driving sophisticated flame retardant material requirements throughout the polymer industry. International suppliers and domestic antimony producers are establishing comprehensive production and distribution capabilities to serve the expanding flame retardant market.
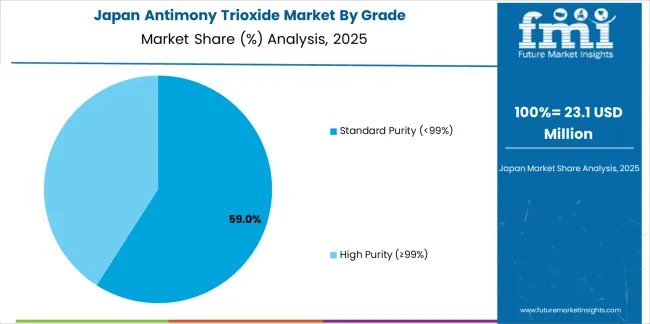
Revenue from antimony trioxide in Japan is growing at a CAGR of 5.2%, driven by the country's focus on precision electronics manufacturing, automotive wiring harness production, and growing emphasis on safer, high-specification polymers with stringent quality requirements. The country's advanced manufacturing capabilities and premium product positioning are supporting demand for high-purity antimony trioxide across major production regions. Electronics manufacturers and automotive suppliers are establishing comprehensive flame retardant qualification capabilities to serve both domestic premium markets and international export requirements.
Revenue from antimony trioxide in the United States is expanding at a CAGR of 4.1%, supported by the country's growing electrical/electronic equipment demand, increasing construction retrofit requirements, and movement toward compliant flame retardant systems addressing fire-safety regulations. The nation's comprehensive electronics manufacturing infrastructure and expanding construction activity are maintaining steady demand for reliable flame retardant materials. Polymer compounders and electronics manufacturers are investing in compliant flame retardant technologies to serve both commercial and consumer product requirements.
Revenue from antimony trioxide in Germany is growing at a CAGR of 3.8%, driven by the country's emphasis on automotive interior applications, electronics manufacturing requirements, and transition to safer flame retardant systems within EU supply chain compliance frameworks. Germany's established automotive industry and focus on regulatory compliance are supporting steady demand for qualified flame retardant materials throughout major manufacturing regions. Industry leaders are establishing specialized capabilities to serve both automotive OEM and electronics manufacturing requirements.
Revenue from antimony trioxide in the United Kingdom is expanding at a CAGR of 3.6%, supported by the country's focus on building refurbishments requiring fire-safety upgrades, transport sector applications demanding compliant flame retardant materials, and adoption of qualified flame retardant compounds in consumer goods manufacturing. The UK's construction renovation activity and regulatory compliance emphasis are driving demand for reliable flame retardant materials and compliant polymer systems. Polymer compounders and construction materials manufacturers are investing in specialized capabilities to serve both building renovation and transport sector requirements.
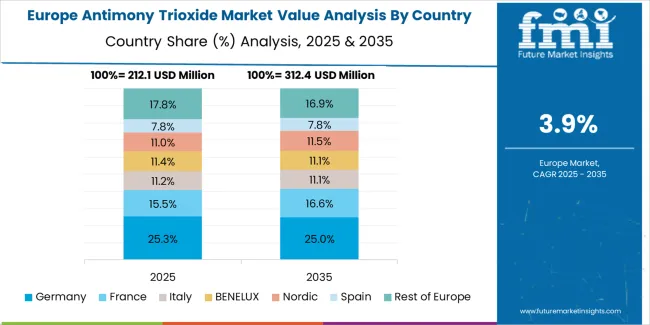
The antimony trioxide market in Europe is projected to reach approximately USD 270 million in 2025, representing a significant portion of the global USD 0.9 billion market, with demand distributed across Western Europe's automotive and electronics manufacturing base and the continent's expanding construction and infrastructure sectors. Germany leads European consumption with approximately USD 64.8 million (24% of European market), driven by automotive interior applications requiring flame retardant polymers for passenger car and commercial vehicle components, along with electronics manufacturing demanding stringent fire-safety compliance. The country's advanced automotive industry and precision electronics capabilities support consistent demand for high-quality antimony trioxide across diverse flame retardant applications. France follows with about USD 40.5 million (15% of European consumption), benefiting from strong plastics processing presence and growing emphasis on compliant flame retardant systems for construction and consumer products. Italy reflects steady demand at approximately USD 37.8 million (14% market share), supported by diverse manufacturing sectors including appliances, electronics enclosures, and building materials requiring fire-safety compliance. The United Kingdom accounts for about USD 35.1 million (13% of European antimony trioxide consumption), driven by building refurbishment requirements, transport sector applications, and consumer goods manufacturing.
Spain represents approximately USD 21.6 million (8% of European demand), balancing construction materials and plastics processing across its diversified manufacturing base. The Netherlands maintains about USD 16.2 million (6% market share), supported by electronics assembly operations and specialty polymer compounding activities. The Rest of Europe collectively accounts for approximately USD 54 million (20% market share), including significant contributions from Poland, Czech Republic, and other Central & Eastern European countries hosting growing plastics processing and electronics manufacturing operations. The European market is characterized by ongoing transition toward safer flame retardant systems, with manufacturers balancing antimony trioxide's proven effectiveness and cost competitiveness against evolving regulatory expectations for flame retardant materials. Western Europe leads in quality specifications and compliance documentation requirements, while Central & Eastern Europe supports cost-competitive compounding operations supplying both regional markets and pan-European supply chains with standardized flame retardant formulations.
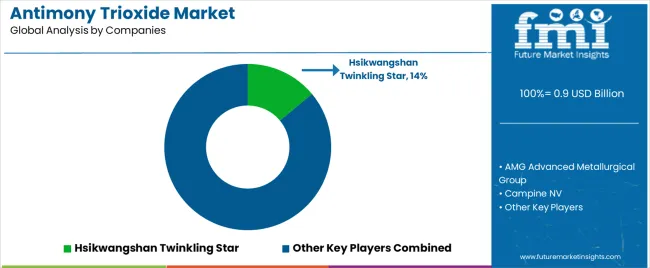
The antimony trioxide market is characterized by competition among established antimony producers, integrated metallurgical groups, and specialty chemical suppliers. Hsikwangshan Twinkling Star leads the market with a 14% share, offering comprehensive antimony trioxide production with a focus on consistent quality, reliable supply, and cost-competitive flame retardant solutions. Companies are investing in supply chain security research, purification technology excellence, quality optimization, and comprehensive product portfolios to deliver reliable, efficient, and high-performance antimony trioxide materials. Innovation in high-purity grades, supply diversification strategies, and advanced quality control systems is central to strengthening market position and competitive advantage.
AMG Advanced Metallurgical Group provides integrated antimony production capabilities with an emphasis on European supply security and advanced material specifications. Campine NV delivers comprehensive antimony trioxide offerings with a focus on specialty grades and technical service support for European polymer compounders. Yamanaka & Co., Ltd. offers established antimony trioxide supply focused on Asian markets with emphasis on quality consistency. LANXESS AG focuses on integrated flame retardant solutions incorporating antimony trioxide with comprehensive technical support for polymer applications. Huachang Antimony Industry provides large-scale antimony trioxide production capabilities supporting Chinese domestic and export markets. Nihon Seiko Co., Ltd., YoungSun Chemicals Corp., Merck Group, and American Elements offer regional production capabilities, specialty grades, and diversified market positioning across standard and high-purity antimony trioxide segments.
Recent market developments demonstrate the industry's focus on supply chain security and capacity expansion. Spearmint Resources Inc. announced in December 2024 the expansion of the George Lake South Antimony Project in New Brunswick, Canada, to approximately 4,722 acres, citing tighter trade conditions and a sharp rise in antimony trioxide spot prices, positioning the project for North American supply security and reduced reliance on concentrated import sources. Multiple producers instituted temporary allocation measures and pricing surcharges during Q4 2024 amid a rapid price spike for antimony trioxide, reinforcing upstream investment signals and accelerating near-term sourcing diversification initiatives by polymer compounders and masterbatch manufacturers seeking supply reliability. These market dynamics are driving increased attention to regional production capacity, alternative supply sources, and strategic inventory management throughout the antimony trioxide supply chain.
Antimony trioxide represents a specialized inorganic compound within flame retardant and polymer additive applications, projected to grow from USD 0.9 billion in 2025 to USD 1.5 billion by 2035 at a 4.9% CAGR. This critical flame retardant synergist primarily supplied in powder form for compounding with halogenated flame retardants serves as an essential material for fire-safety compliance in plastics & polymers, building & construction, electronics, and textiles applications across commercial and consumer product segments. Market expansion is driven by tightening fire-safety regulations in electronics and construction, growing demand for cost-effective flame retardant systems, expanding high-purity grade adoption for precision electronics, and rising emphasis on supply chain diversification in diverse manufacturing applications.
| Items | Values |
|---|---|
| Quantitative Units (2025) | USD 0.9 billion |
| Grade | Standard Purity (<99%), High Purity (≥99%) |
| Application | Flame Retardant, Catalyst, Pigment & Opacifier, Electronics & Electrical, Others |
| End Use | Plastics & Polymers, Building & Construction, Electronics, Textiles, Others |
| Regions Covered | Asia Pacific, North America, Europe, Latin America, Middle East & Africa |
| Countries Covered | China, India, South Korea, Japan, United States, Germany, United Kingdom, and 40+ countries |
| Key Companies Profiled | Hsikwangshan Twinkling Star, AMG Advanced Metallurgical Group, Campine NV, LANXESS AG, Huachang Antimony Industry |
| Additional Attributes | Dollar sales by grade, application, and end use category, regional demand trends, competitive landscape, technological advancements in purification processes, high-purity grade development, supply chain diversification initiatives, and North American capacity expansion |
The global antimony trioxide market is estimated to be valued at USD 0.9 billion in 2025.
The market size for the antimony trioxide market is projected to reach USD 1.5 billion by 2035.
The antimony trioxide market is expected to grow at a 4.9% CAGR between 2025 and 2035.
The key product types in antimony trioxide market are standard purity (<99%) and high purity (≥99%).
In terms of application, flame retardant segment to command 78.0% share in the antimony trioxide market in 2025.


Full Research Suite comprises of:
Market outlook & trends analysis
Interviews & case studies
Strategic recommendations
Vendor profiles & capabilities analysis
5-year forecasts
8 regions and 60+ country-level data splits
Market segment data splits
12 months of continuous data updates
DELIVERED AS:
PDF EXCEL ONLINE
Antimony Free Film Market Size and Share Forecast Outlook 2025 to 2035
Antimony Market Growth - Trends & Forecast 2025 to 2035
Chromium Trioxide Market Size and Share Forecast Outlook 2025 to 2035

Thank you!
You will receive an email from our Business Development Manager. Please be sure to check your SPAM/JUNK folder too.
Chat With
MaRIA