Astringents Market Size and Share Forecast Outlook 2025 to 2035

The Astringents Market is expected to record a valuation of USD 1,452.1 million in 2025 and USD 3,052.4 million in 2035, with an increase of USD 1,600.3 million, which equals a growth of more than 110% over the decade. The overall expansion represents a CAGR of 7.7% and more than a 2X increase in market size.
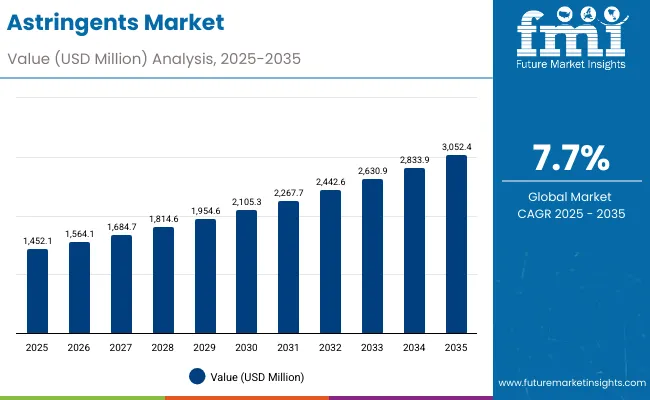
Quick Stats for Astringents Market

  • Astringents Market Value (2025): USD 1,452.1 million
  • Astringents Market Forecast Value (2035): USD 3,052.4 million
  • Astringents Market Forecast CAGR: 7.7%
  • Leading Segment in Astringents Market in 2025: Pore-tightening actives (41%)
  • Key Growth Regions in the Astringents Market: East Asia, South Asia & Pacific, Europe
  • Top Key Players in Astringents Market: Clariant, Givaudan, Symrise, Croda, BASF, Ashland, Rahn, Seppic, DSM-Firmenich, Greentech

Astringents Market

Astringents Market Key Takeaways

Metric Value
Astringents Market Estimated Value in (2025E) USD 1,452.1 million
Astringents Market Forecast Value in (2035F) USD 3,052.4 million
Forecast CAGR (2025 to 2035) 7.7%

During the first five-year period from 2025 to 2030, the market increases from USD 1,452.1 million to USD 2,105.3 million, adding USD 653.2 million, which accounts for 41% of the total decade growth. This phase records steady adoption in skincare, men’s grooming, and cosmeceutical applications, driven by the rise of pore-refining and sebum-balancing products. Shorter product cycles and the popularity of over-the-counter facial toners and anti-acne cleansers reinforce the dominance of pore-tightening actives, catering to more than 41% of functional demand in 2025. Botanical extracts rise as a preferred option due to the global inclination toward plant-derived skincare actives, representing USD 638.9 million in sales in 2025.

The second half from 2030 to 2035 contributes USD 947.1 million, equal to 59% of total growth, as the market jumps from USD 2,105.3 million to USD 3,052.4 million. This acceleration is powered by the widespread adoption of cosmeceutical-grade astringents, encapsulated delivery systems, and hybrid formulations blending botanical and mineral-based actives. Premium body mists, men’s aftershaves, and advanced anti-acne gels see rapid traction as lifestyle shifts and higher skincare investments drive demand.

Encapsulated delivery systems and blended forms capture stronger interest as brands emphasize stability, controlled release, and compatibility with multifunctional formulations. By the end of the decade, encapsulated and blended formats account for nearly half the market share. At the same time, gel-based forms increasingly replace alcohol-heavy solutions, as consumers demand gentler and long-lasting application formats.

From 2020 to 2024, the Astringents Market grew steadily, supported by rising skincare product launches and increasing consumer awareness of pore care and sebum regulation. During this period, the competitive landscape was led by global ingredient manufacturers holding a combined over 30% share in functional actives, with companies such as Clariant, Givaudan, and Croda focusing on advanced botanical and mineral blends. Competitive differentiation relied on formulation stability, compatibility with cosmetic bases, and safety validation, while alcohol-based astringents declined in share due to consumer preference shifts toward gentler alternatives. Herbal-based extracts such as witch hazel and green tea distillates gained traction, positioning themselves as credible natural substitutes in mainstream skincare and grooming lines.

Demand for global astringents will expand to USD 1,452.1 million in 2025, and the revenue mix will shift as encapsulated and blended delivery systems rise to over 48% share by 2035. Traditional alcohol-based players face rising competition from botanical-driven brands offering clinically tested natural actives, microbiome-friendly solutions, and multifunctional pore-care innovations. Major suppliers are pivoting to hybrid portfolios, combining synthetic efficacy with natural-origin claims, to retain relevance in both premium cosmeceutical and mass-market grooming categories.

Emerging entrants specializing in encapsulation, AR/VR skin diagnostic compatibility, and dermatology-led cosmeceutical solutions are gaining share. The competitive advantage is moving away from singular raw material supply to end-to-end value chain integration, scalability of botanical sourcing, and science-backed consumer claims.

Why the Astringents Market is Growing?

Advances in ingredient innovation and delivery formats have boosted the efficacy and safety profile of astringents, making them suitable for both mass-market and premium skincare. Pore-tightening actives dominate due to their direct impact on skin appearance, particularly in urban populations with higher exposure to pollutants and humidity that enlarge pores. Botanical extracts have gained preference as consumers seek plant-based, sustainable, and gentler alternatives to alcohol-heavy products.

Witch hazel distillates, green tea polyphenols, and chamomile actives are reshaping product formulations, aligning with the clean-label movement and consumer trust in natural ingredients. The rise of men’s grooming has also contributed significantly, with aftershaves and sebum-balancing cleansers finding adoption across emerging and mature markets.

Expansion of cosmeceuticals and hybrid beauty products has fueled further market momentum. With dermatology-backed claims and clinical validation becoming standard, encapsulated and blended delivery systems are gaining ground, ensuring long-lasting stability and consumer safety. The shift from solution/concentrate forms to gel bases aligns with consumer preference for comfort and mildness, especially in Asian markets.

The surge in skincare routines in China, India, and Japan, combined with demand for premium solutions in Europe and the USA, underpins sustained growth. Segment growth is expected to be led by pore-tightening actives, botanical extracts, and encapsulated formats, reflecting both functional efficacy and alignment with future consumer demand.

Segmental Analysis

The Astringents Market is segmented by functional mechanism, ingredient type, delivery system, physical form, application, end use, and region. Functional mechanisms include pore-tightening actives, sebum-reducing actives, and skin-soothing & calming agents, reflecting diverse skin concerns driving product demand. Ingredient type spans botanical extracts, alcohol-based actives, witch hazel distillates, and mineral-based astringents, balancing natural and synthetic innovation. Delivery systems are classified as free form, encapsulated, and blended, highlighting the importance of formulation science and performance.

By physical form, the market includes solutions/concentrates, powders, and gel bases, catering to product diversity across applications. Applications cover facial toners, aftershaves, anti-acne cleansers, and body mists, linking to both skincare and grooming routines. End uses include skincare, men’s grooming, and cosmeceuticals, representing the crossover of consumer, clinical, and professional markets. Regionally, the scope spans North America, Europe, East Asia, South Asia & Pacific, Latin America, and the Middle East & Africa, reflecting strong demand potential in both established and emerging economies.
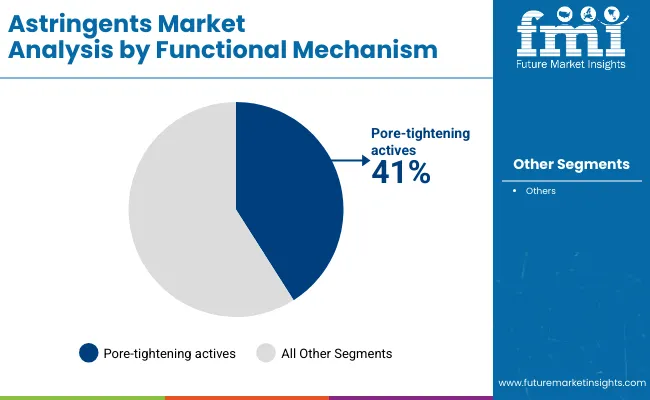
Insights into the Functional Mechanism Segment with Pore-tightening Actives Leading in Market Share

Astringents Market By Functional Mechanism

Functional Mechanism Value Share% 2025
Pore-tightening actives 41%
Others 59.0%

The pore-tightening actives segment is projected to contribute 41% of the Astringents Market revenue in 2025, amounting to USD 595.36 million, maintaining its lead as the dominant functional mechanism. This leadership is driven by the increasing consumer emphasis on refined skin texture and reduced pore visibility, particularly in urban populations where pollution and humidity exacerbate skin issues. Brands have prioritized formulations featuring pore-refining ingredients that deliver visible results in facial toners, cleansers, and anti-acne products.

The segment’s strength is further reinforced by the rising availability of advanced botanical and mineral-based actives that not only minimize pores but also enhance overall skin health. With the surge in demand for multifunctional products, pore-tightening actives are being incorporated into hybrid cosmeceutical formulations, strengthening their long-term relevance. The adoption of clinical validation and dermatology-backed claims also plays a critical role in building consumer trust. This segment is expected to retain its position as the backbone of astringent formulations globally, particularly in skincare and men’s grooming.
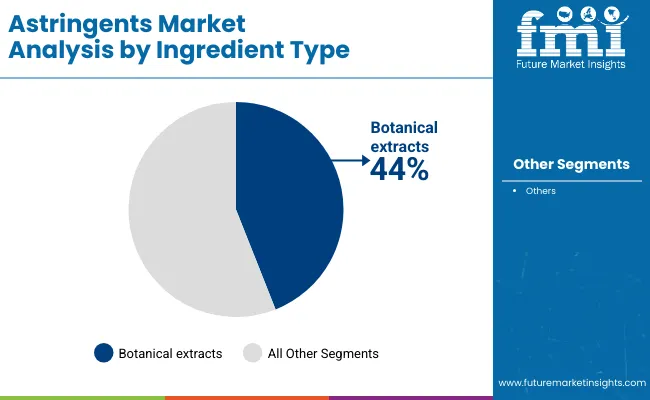
Insights into the Ingredient Type Segment with Botanical Extracts Dominating the Demand

Astringents Market By Ingrediants

Ingredient Type Value Share% 2025
Botanical extracts 44%
Others 56.0%

The botanical extracts segment is forecasted to hold 44% of the market share in 2025, representing USD 638.92 million in sales, led by its application in natural and sustainable skincare formulations. Botanical ingredients such as witch hazel distillates, chamomile, and green tea have become the cornerstone of modern astringent formulations, as consumers increasingly favor plant-based solutions over synthetic or alcohol-heavy alternatives. These extracts are valued for their multifunctional properties, offering pore-tightening, sebum-regulating, and soothing benefits within a single application.

The segment’s growth is also fueled by clean-label and sustainability trends, with consumers actively seeking products free from harsh chemicals and associated side effects. This has facilitated the widespread adoption of botanical extracts in both premium cosmeceuticals and mass-market skincare, bridging the gap between clinical efficacy and natural appeal. With ongoing research validating the safety and performance of plant-derived actives, the botanical extracts segment is positioned to continue its dominance, especially in Asia-Pacific and European markets where herbal and organic products have significant traction.
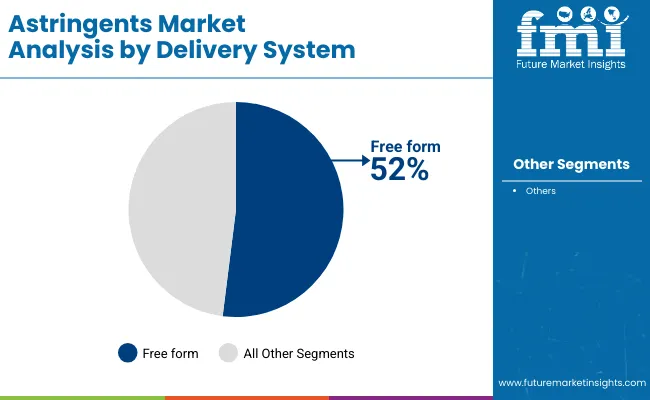
Insights into the Delivery System Segment with Free Form Formats Maintaining Leadership

Astringents Market By Delivery

Delivery System Value Share% 2025
Free form 52%
Others 48.0%

The free form delivery system segment is projected to account for 52% of the Astringents Market revenue in 2025, equivalent to USD 755.09 million, establishing it as the leading delivery system type. Free form solutions remain popular due to their cost-effectiveness, formulation flexibility, and ease of integration across multiple product categories such as facial toners, aftershaves, and body mists. These formats allow manufacturers to maintain scalability and adaptability, catering to diverse consumer preferences without major processing complexities.

The dominance of free form is also supported by its compatibility with a wide range of ingredient types from alcohol-based actives to botanical extracts. However, rising innovation in encapsulated and blended delivery systems highlights a gradual market shift, as these advanced formats offer better stability, controlled release, and enhanced performance. Even so, free form delivery systems are expected to retain their leadership through 2030 due to their extensive presence in mass-market segments, before yielding gradual share gains to encapsulated formats in the premium cosmeceutical space. Their continued role as the foundation of astringent formulations makes them central to global market growth.

What are the Drivers, Restraints, and Key Trends of the Astringents Market?

Drivers

Rising penetration of cosmeceuticals bridging clinical and cosmetic care

The Astringents Market is increasingly shaped by the integration of cosmeceuticals products that combine pharmaceutical-grade efficacy with cosmetic appeal. Pore-tightening and sebum-regulating actives are being reformulated with encapsulated delivery systems, offering dermatology-backed claims that appeal to both doctors and consumers. For example, encapsulated botanical extracts allow for slower release and better stability, directly addressing consumer concerns about irritation from alcohol-based solutions. This convergence is particularly strong in markets like Japan, the USA, and Europe, where consumers demand evidence-based skincare. The push for medical-grade validation is driving new investments from top players such as DSM-Firmenich and BASF, fueling steady premiumization of the segment and pushing average selling prices upward.

Men’s grooming expansion beyond aftershaves into multi-functional skin toners

Historically, astringents were closely associated with aftershaves in men’s grooming. However, the category has now extended into multi-functional skin toners and anti-acne cleansers designed specifically for male consumers. Younger demographics in China, India, and South Korea are driving this demand, as men adopt multi-step skincare routines that were once dominated by women’s products. This is not only boosting pore-tightening actives but also creating new demand for botanical and mineral-based astringents that offer dual benefits of oil control and soothing. The men’s grooming driver is particularly important in Asia-Pacific, where men’s skincare is growing faster than women’s, helping the astringents category diversify its end-use base.

Restraints

Decline in alcohol-based formulations due to safety and sensitivity concerns

One of the most significant restraints in the Astringents Market is the shrinking role of alcohol-based actives. Although once considered essential for quick pore tightening, these products are increasingly avoided due to associations with dryness, irritation, and long-term disruption of the skin barrier. Regulatory advisories and rising consumer awareness have accelerated this decline, particularly in mature markets such as North America and Western Europe. With alcohol-based astringents accounting for a substantial share of low-cost products, their decline challenges companies to either reformulate or risk revenue erosion. This shift places pressure on suppliers to replace alcohol actives with more expensive natural alternatives, raising production costs.

Uneven consumer education and cultural stigma in emerging markets

In markets like India and parts of Latin America, the penetration of advanced astringents is constrained by limited consumer education about product benefits beyond basic cleansing. While urban consumers are open to premium skincare, semi-urban and rural consumers often perceive astringents as "harsh" or unnecessary, partly due to earlier negative associations with alcohol-heavy solutions. This cultural barrier creates a lag in demand growth, despite high prevalence of oily skin and acne conditions. Bridging this education gap requires marketing investments and dermatology-led endorsements, which many mid-tier brands lack, slowing adoption outside urban centers.

Key Trends

Encapsulation technology transforming stability and efficacy

Encapsulation is emerging as a game-changer in the astringents market, especially for botanical and mineral actives. By embedding molecules within lipid or polymer shells, companies improve ingredient stability, enable controlled release, and reduce irritation risks. This is especially valuable for cosmeceutical positioning, where efficacy and safety must be clinically proven. Encapsulated witch hazel and green tea actives are gaining momentum in premium brands across Japan and Europe, and by 2030, encapsulated formats are expected to capture significant share from free form delivery. This trend also ties into sustainability, as encapsulation reduces the need for synthetic preservatives.

Shift from solution/concentrate to gel-based astringents

Consumer preference is shifting from traditional liquid or concentrate-based astringents toward gel-based formats. Gel bases are perceived as gentler, longer-lasting, and more compatible with multifunctional skincare routines. In Asia, gel-based astringents are being positioned as both hydrating and pore-minimizing, while in Europe, they are marketed as alcohol-free alternatives for sensitive skin. This trend is reinforced by the clean beauty movement, as gel formats allow brands to highlight "no alcohol, no irritation" claims. By 2035, gel formats are expected to lead growth within the physical form segment, reshaping how brands develop new product pipelines.
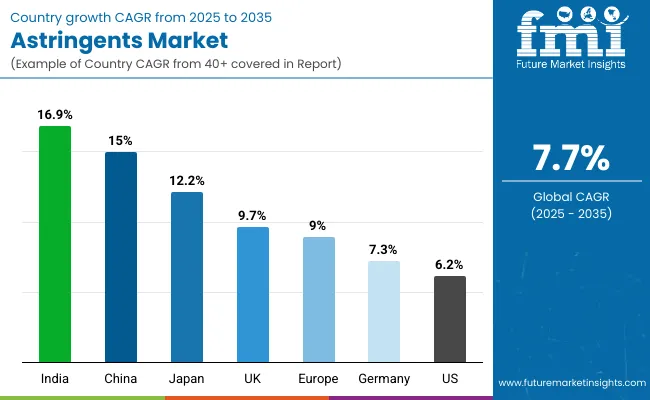
Analysis of Astringents Market By Key Countries

Astringents Market By Country

Countries Estimated CAGR (2025 to 2035)
China 15.0%
USA 6.2%
India 16.9%
UK 9.7%
Germany 7.3%
Japan 12.2%
Europe 9.0%

The country-wise outlook of the Astringents Market between 2025 and 2035 highlights sharp contrasts in adoption rates and consumer behavior. India emerges as the fastest-growing market with a CAGR of 16.9%, supported by its large young demographic base, high incidence of oily and acne-prone skin, and rapid expansion of affordable OTC skincare and grooming products. Domestic and international brands are capitalizing on herbal preferences by launching botanical and mineral-based astringents, often combined with traditional ayurvedic claims.

China, with a CAGR of 15.0%, follows closely, driven by the boom in cosmeceuticals and men’s grooming. Premiumization is particularly strong here, with urban consumers demanding encapsulated botanical actives and microbiome-friendly formulas. Japan, growing at 12.2%, reflects a distinct consumer inclination toward biotech-driven skincare with gel-based formats and clinically validated pore-minimizing solutions gaining momentum.

In contrast, mature Western markets are expanding at relatively modest but steady rates. The USA market grows at 6.2%, where consumer focus is shifting from alcohol-heavy solutions to dermatologist-backed botanical and mineral-based alternatives. Adoption is bolstered by the rise of men’s toners and aftershaves, though price sensitivity and competition from multifunctional skincare products cap growth. The UK at 9.7% and Germany at 7.3% reflect Europe’s balanced trajectory, where regulatory oversight and clean-label trends push innovation toward natural and encapsulated formats.

The broader Europe market, growing at 9.0%, benefits from cosmeceutical expansion and premium consumer positioning, though alcohol-based declines restrain overall value growth. Together, these regional dynamics demonstrate that while Asia-Pacific drives the highest growth momentum, Europe and North America remain critical for premium positioning and clinical validation of astringents.
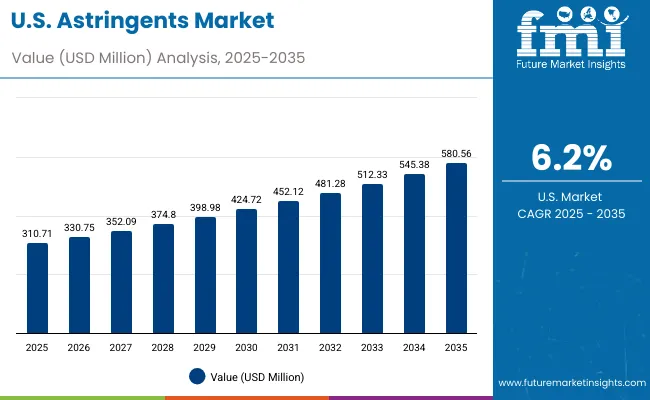
Sales Outlook for Astringents in the United States

Astringents Market Usa

Year USA Astringents Market (USD Million)
2025 310.71
2026 330.75
2027 352.09
2028 374.80
2029 398.98
2030 424.72
2031 452.12
2032 481.28
2033 512.33
2034 545.38
2035 580.56

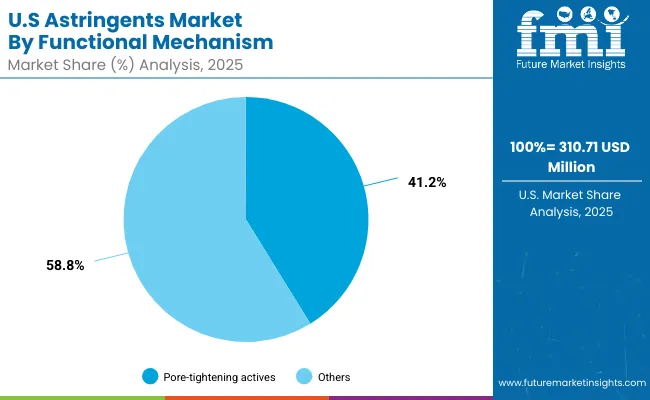
The Astringents Market in the United States is projected to grow at a CAGR of 6.2%, supported by increased consumer focus on skincare and men’s grooming. Pore-tightening actives dominate the USA segment, accounting for 41.2% of sales in 2025 (USD 128.0 million). Dermatologist-recommended formulations are driving premium demand, while mass-market brands continue to rely on cost-effective botanical and mineral-based alternatives. The healthcare-driven cosmeceutical segment, particularly in acne management, has also been a contributor to consistent growth.

  • Pore-tightening actives remain the leading functional mechanism in the USA
  • Men’s grooming and aftershave astringents support steady sales expansion.
  • Cosmeceutical adoption is strengthening due to dermatologist-backed claims.

Growth and Expansion Outlook for Astringents in the United Kingdom

The Astringents Market in the United Kingdom is expected to grow at a CAGR of 9.7%, reflecting consumer adoption of premium skincare and clean-label formulations. Botanical extracts and witch hazel-based solutions are the most widely used ingredients, given their natural positioning and alignment with UK consumers’ preference for herbal care. Demand is also expanding in men’s grooming, with aftershaves increasingly formulated with alcohol-free and soothing ingredients. Heritage cosmetic brands and niche cosmeceutical players are driving innovation in gel-based toners and microbiome-balancing formulas.

  • Botanical and witch hazel extracts dominate ingredient preferences in the UK
  • Men’s grooming astringents continue to expand beyond traditional aftershaves.
  • Premium cosmeceutical launches are fueling above-average CAGR growth.

Growth and Expansion Outlook for Astringents in India

India is witnessing the fastest expansion in the Astringents Market, forecast to grow at a CAGR of 16.9% through 2035. Rapid urbanization and high prevalence of oily and acne-prone skin have made pore-tightening actives and anti-acne cleansers central to demand. Affordable OTC toners and herbal formulations dominate sales in tier-2 and tier-3 cities, while premium botanical and encapsulated formats are gaining popularity among metro consumers. The cultural affinity for ayurvedic and herbal solutions supports growth in botanical extracts, making India a stronghold for natural-origin astringents.

  • Expansion in tier-2 cities is driven by affordable herbal-based OTC launches.
  • Pore-tightening actives are gaining dominance due to widespread acne concerns.
  • Premium cosmeceutical and encapsulated delivery formats are emerging in metro markets.

Sales Outlook for Astringents in China

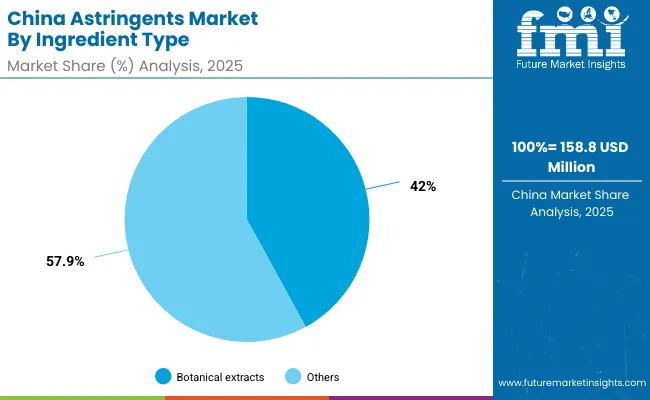
The Astringents Market in China is expected to grow at a CAGR of 15.0%, the second highest among major economies. Growth is being propelled by cosmeceutical adoption, men’s skincare expansion, and urban consumer preference for biotech-driven actives. Botanical extracts hold 42% of the market in 2025 (USD 66.9 million), reflecting consumer demand for natural but clinically validated solutions. China’s men’s grooming market is especially dynamic, with aftershaves and oil-control toners seeing double-digit growth. Local and international brands are investing in encapsulated delivery systems and alcohol-free gel-based formats to address consumer demand for gentler, high-efficacy skincare.
  • Botanical extracts account for the largest share of Chinese astringents demand.
  • Men’s grooming continues to drive multi-functional toner and aftershave launches.
  • Encapsulated delivery systems and biotech-driven actives are fueling premiumization.

Growth Outlook for Astringents Market in USA

Astringents Market Usa 2

USA By Functional Mechanism Value Share% 2025
Pore-tightening actives 41.2%
Others 58.8%

The Astringents Market in the United States is valued at USD 310.71 million in 2025 and is projected to grow steadily to USD 580.56 million by 2035, reflecting a CAGR of 6.2%. Functional mechanisms are led by pore-tightening actives, which contribute 41.2% of revenues, equivalent to USD 128.0 million. This dominance stems from heightened consumer interest in pore-refining solutions, particularly in urban populations with higher exposure to pollutants and stress-related skin issues. The demand is supported by dermatology-backed toners and cosmeceutical formulations, which strengthen the credibility of these products.

Growth is also driven by the rise of men’s grooming, where alcohol-free aftershaves and sebum-control solutions are gaining popularity. American consumers are also shifting toward botanical and mineral-based astringents as safer, long-term alternatives to alcohol-heavy solutions. The competitive shift is visible in premium cosmeceuticals, where encapsulated delivery systems are gradually emerging but still secondary to free form and solution-based formats. With steady growth across skincare and grooming, the USA remains a stronghold for clinically validated, premium-positioned astringents.
  • Market in the USA contributes 21.4% of global value in 2025
  • Pore-tightening actives lead at 41.2% share of USA sales
  • Growth is supported by men’s grooming and dermatology-driven cosmeceuticals

Opportunity Analysis of China Astringents Market

Astringents Market China 2

China By Ingredient Type Value Share% 2025
Botanical extracts 42%
Others 57.9%

The Astringents Market in China is valued at USD 158.8 million in 2025 and is expected to record one of the fastest expansions globally with a CAGR of 15.0% through 2035. Ingredient types are led by botanical extracts, which account for 42% of demand, equivalent to USD 66.9 million. This reflects the strong consumer preference for herbal and natural actives, especially in skincare products targeting pore minimization and sebum control.

China’s growth is powered by the convergence of men’s grooming, cosmeceuticals, and premium skincare. Urban consumers in tier-1 cities are embracing encapsulated botanical actives and biotech-driven innovations, while domestic brands are scaling affordable free-form solutions for mass adoption. This dual-track growth allows both premium and mass-market players to thrive. With gel-based formats and microbiome-balancing products gaining traction, China is expected to surpass Europe in innovation-led growth momentum by 2030.
  • Market size in China: USD 158.8 million in 2025
  • Global market share: 10.9% in 2025, rising to 11.8% by 2035
  • Botanical extracts dominate at 42% share due to herbal positioning and consumer trust

Competitive Landscape of Astringents Market

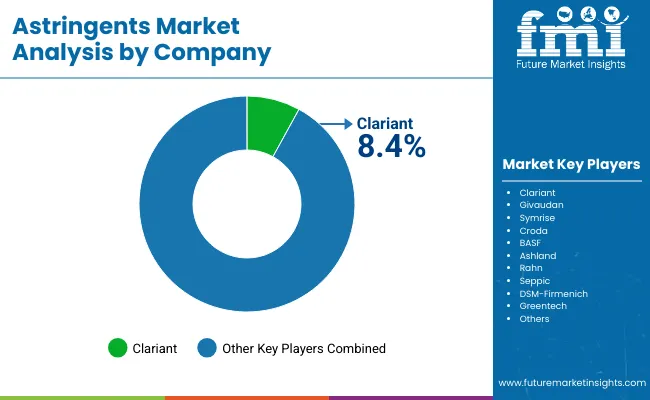
Astringents Market By Company

The Astringents Market is moderately fragmented, with multinational chemical suppliers, cosmeceutical ingredient specialists, and botanical-focused innovators competing for share. Clariant, with an 8.4% global market share, leads the space by focusing on multifunctional botanical and mineral-based actives tailored for skincare and cosmeceutical applications. Other leading global players include Givaudan, Symrise, Croda, BASF, Ashland, Rahn, Seppic, DSM-Firmenich, and Greentech, each leveraging unique strengths in natural-origin ingredients, encapsulation technologies, and dermatology-driven product validation.

Competitive differentiation is shifting away from single-ingredient supply toward complete ecosystems that integrate natural sourcing, advanced delivery formats, and clinical testing. Mid-sized players such as Rahn and Greentech emphasize specialization in clean-label botanical actives, while larger incumbents like BASF and DSM-Firmenich are investing in encapsulated delivery systems and cosmeceutical partnerships. Competitive intensity is further heightened by sustainability pressures, as ingredient suppliers are compelled to prove the traceability, safety, and performance of their actives. The market is expected to consolidate around suppliers that can balance scale, innovation, and clinical credibility, defining the next phase of global growth.

Key Developments in Astringents Market

  • On May 2023, Clariant’s active‐ingredients arm launched Rootness® Awake and Aristoflex® Eco T, which won Gold in the Green Ingredient category and Silver in the Functional Ingredient Innovation zone at In-Cosmetics Global 2023. Aristoflex Eco T is a biodegradable rheology modifier (a thicken/stabilizer) with a high Renewable Carbon Index, delivering performance comparable to synthetic polymers.
  • On 2023-2024, Clariant also introduced Rootness® Mood+, a natural active derived from Sanguisorba officinalis roots using "Plant Milking" technology. This new active provides astringent (skin tightening) properties plus mood‐boosting skin benefits via vitamin D uptake, serotonin and melatonin release. It won awards including at CITE in Japan.

Scope of the Report

Item Value
Quantitative Units USD Million
Functional Mechanism Pore-tightening actives, Sebum-reducing actives, Skin-soothing & calming agents
Ingredient Type Botanical extracts, Alcohol-based actives, Witch hazel distillates, Mineral-based astringents
Delivery System Free form, Encapsulated, Blended
Physical Form Solution/concentrate, Powder, Gel base
Application Facial toners, Aftershaves, Anti-acne cleansers, Body mists
End Use Skincare, Men’s grooming, Cosmeceuticals
Regions Covered North America, Europe, East Asia, South Asia & Pacific, Latin America, Middle East & Africa
Country Covered United States, China, India, Japan, Germany, United Kingdom, France, Brazil, Canada, South Africa
Key Companies Profiled Clariant, Givaudan, Symrise, Croda, BASF, Ashland, Rahn, Seppic, DSM-Firmenich, Greentech
Additional Attributes Dollar sales by functional mechanism, ingredient type, delivery system, and physical form; adoption trends in cosmeceuticals and men’s grooming; rising demand for botanical and alcohol-free formulations; software-like innovation vectors via encapsulation and controlled-release delivery; integration with AR/VR skin diagnostics and digital skin-twin routines; regional trends shaped by clean-label and microbiome-friendly claims; innovations in gel bases, witch hazel distillates, and mineral-based astringents; premiumization via clinical validation and dermatologist-backed claims.

Key Segments

By Functional Mechanism:

  • Pore-tightening actives
  • Sebum-reducing actives
  • Skin-soothing & calming agents

By Ingredient Type:

  • Botanical extracts
  • Alcohol-based actives
  • Witch hazel distillates
  • Mineral-based

By Delivery System:

  • Free form
  • Encapsulated
  • Blended

By Physical Form:

  • Powder
  • Solution/concentrate
  • Gel base

By Application:

  • Facial toners
  • Aftershaves
  • Anti-acne cleansers
  • Body mists

By End Use:

  • Skincare
  • Men’s grooming
  • Cosmeceuticals

By Region:

  • North America
  • Latin America
  • Europe
  • East Asia
  • South Asia & Pacific
  • Middle East and Africa

Table of Content

  1. Executive Summary
    • Global Market Outlook
    • Demand-side Trends
    • Supply-side Trends
    • Technology Roadmap Analysis
    • Analysis and Recommendations
  2. Market Overview
    • Market Coverage / Taxonomy
    • Market Definition / Scope / Limitations
  3. Market Background
    • Market Dynamics
      • Drivers
      • Restraints
      • Opportunity
      • Trends
    • Scenario Forecast
      • Demand in Optimistic Scenario
      • Demand in Likely Scenario
      • Demand in Conservative Scenario
    • Opportunity Map Analysis
    • Product Life Cycle Analysis
    • Supply Chain Analysis
      • Supply Side Participants and their Roles
        • Producers
        • Mid-Level Participants (Traders/ Agents/ Brokers)
        • Wholesalers and Distributors
      • Value Added and Value Created at Node in the Supply Chain
      • List of Raw Material Suppliers
      • List of Existing and Potential Buyer’s
    • Investment Feasibility Matrix
    • Value Chain Analysis
      • Profit Margin Analysis
      • Wholesalers and Distributors
      • Retailers
    • PESTLE and Porter’s Analysis
    • Regulatory Landscape
      • By Key Regions
      • By Key Countries
    • Regional Parent Market Outlook
    • Production and Consumption Statistics
    • Import and Export Statistics
  4. Global Market Analysis 2020 to 2024 and Forecast, 2025 to 2035
    • Historical Market Size Value (USD Million) & Volume (Units) Analysis, 2020 to 2024
    • Current and Future Market Size Value (USD Million) & Volume (Units) Projections, 2025 to 2035
      • Y-o-Y Growth Trend Analysis
      • Absolute $ Opportunity Analysis
  5. Global Market Analysis 2020 to 2024 and Forecast 2025 to 2035, By Functional Mechanism
    • Introduction / Key Findings
    • Historical Market Size Value (USD Million) & Volume (Units) Analysis By Functional Mechanism, 2020 to 2024
    • Current and Future Market Size Value (USD Million) & Volume (Units) Analysis and Forecast By Functional Mechanism, 2025 to 2035
      • Pore-tightening actives
      • Sebum-reducing actives
      • Skin-soothing & calming agents
    • Y-o-Y Growth Trend Analysis By Functional Mechanism, 2020 to 2024
    • Absolute $ Opportunity Analysis By Functional Mechanism, 2025 to 2035
  6. Global Market Analysis 2020 to 2024 and Forecast 2025 to 2035, By Ingredient Type
    • Introduction / Key Findings
    • Historical Market Size Value (USD Million) & Volume (Units) Analysis By Ingredient Type, 2020 to 2024
    • Current and Future Market Size Value (USD Million) & Volume (Units) Analysis and Forecast By Ingredient Type, 2025 to 2035
      • Botanical extracts
      • Alcohol-based actives
      • Witch hazel distillates
      • Mineral-based
    • Y-o-Y Growth Trend Analysis By Ingredient Type, 2020 to 2024
    • Absolute $ Opportunity Analysis By Ingredient Type, 2025 to 2035
  7. Global Market Analysis 2020 to 2024 and Forecast 2025 to 2035, By Delivery System
    • Introduction / Key Findings
    • Historical Market Size Value (USD Million) & Volume (Units) Analysis By Delivery System, 2020 to 2024
    • Current and Future Market Size Value (USD Million) & Volume (Units) Analysis and Forecast By Delivery System, 2025 to 2035
      • Free form
      • Encapsulated
      • Blended
    • Y-o-Y Growth Trend Analysis By Delivery System, 2020 to 2024
    • Absolute $ Opportunity Analysis By Delivery System, 2025 to 2035
  8. Global Market Analysis 2020 to 2024 and Forecast 2025 to 2035, By Physical Form
    • Introduction / Key Findings
    • Historical Market Size Value (USD Million) & Volume (Units) Analysis By Physical Form, 2020 to 2024
    • Current and Future Market Size Value (USD Million) & Volume (Units) Analysis and Forecast By Physical Form, 2025 to 2035
      • Powder
      • Solution/concentrate
      • Gel base
    • Y-o-Y Growth Trend Analysis By Physical Form, 2020 to 2024
    • Absolute $ Opportunity Analysis By Physical Form, 2025 to 2035
  9. Global Market Analysis 2020 to 2024 and Forecast 2025 to 2035, By Application
    • Introduction / Key Findings
    • Historical Market Size Value (USD Million) & Volume (Units) Analysis By Application, 2020 to 2024
    • Current and Future Market Size Value (USD Million) & Volume (Units) Analysis and Forecast By Application, 2025 to 2035
      • Facial toners
      • Aftershaves
      • Anti-acne cleansers
      • Body mists
    • Y-o-Y Growth Trend Analysis By Application, 2020 to 2024
    • Absolute $ Opportunity Analysis By Application, 2025 to 2035
  10. Global Market Analysis 2020 to 2024 and Forecast 2025 to 2035, By End Use
    • Introduction / Key Findings
    • Historical Market Size Value (USD Million) & Volume (Units) Analysis By End Use, 2020 to 2024
    • Current and Future Market Size Value (USD Million) & Volume (Units) Analysis and Forecast By End Use, 2025 to 2035
      • Skincare
      • Men’s grooming
      • Cosmeceuticals
    • Y-o-Y Growth Trend Analysis By End Use, 2020 to 2024
    • Absolute $ Opportunity Analysis By End Use, 2025 to 2035
  11. Global Market Analysis 2020 to 2024 and Forecast 2025 to 2035, By Region
    • Introduction
    • Historical Market Size Value (USD Million) & Volume (Units) Analysis By Region, 2020 to 2024
    • Current Market Size Value (USD Million) & Volume (Units) Analysis and Forecast By Region, 2025 to 2035
      • North America
      • Latin America
      • Europe
      • East Asia
      • South Asia & Pacific
      • Middle East and Africa
    • Market Attractiveness Analysis By Region
  12. North America Market Analysis 2020 to 2024 and Forecast 2025 to 2035, By Country
    • Historical Market Size Value (USD Million) & Volume (Units) Trend Analysis By Market Taxonomy, 2020 to 2024
    • Market Size Value (USD Million) & Volume (Units) Forecast By Market Taxonomy, 2025 to 2035
      • By Country
        • USA
        • Canada
      • By Functional Mechanism
      • By Ingredient Type
      • By Delivery System
      • By Physical Form
      • By Application
      • By End Use
    • Market Attractiveness Analysis
      • By Country
      • By Functional Mechanism
      • By Ingredient Type
      • By Delivery System
      • By Physical Form
      • By Application
      • By End Use
    • Key Takeaways
  13. Latin America Market Analysis 2020 to 2024 and Forecast 2025 to 2035, By Country
    • Historical Market Size Value (USD Million) & Volume (Units) Trend Analysis By Market Taxonomy, 2020 to 2024
    • Market Size Value (USD Million) & Volume (Units) Forecast By Market Taxonomy, 2025 to 2035
      • By Country
        • Brazil
        • Mexico
        • Colombia
        • Rest of Latin America
      • By Functional Mechanism
      • By Ingredient Type
      • By Delivery System
      • By Physical Form
      • By Application
      • By End Use
    • Market Attractiveness Analysis
      • By Country
      • By Functional Mechanism
      • By Ingredient Type
      • By Delivery System
      • By Physical Form
      • By Application
      • By End Use
    • Key Takeaways
  14. Europe Market Analysis 2020 to 2024 and Forecast 2025 to 2035, By Country
    • Historical Market Size Value (USD Million) & Volume (Units) Trend Analysis By Market Taxonomy, 2020 to 2024
    • Market Size Value (USD Million) & Volume (Units) Forecast By Market Taxonomy, 2025 to 2035
      • By Country
        • Germany
        • UK
        • France
        • Italy
        • Spain
        • Belgium
        • Netherlands
        • Nordic
        • Switzerland
        • Russia
        • Poland
        • Rest of Europe
      • By Functional Mechanism
      • By Ingredient Type
      • By Delivery System
      • By Physical Form
      • By Application
      • By End Use
    • Market Attractiveness Analysis
      • By Country
      • By Functional Mechanism
      • By Ingredient Type
      • By Delivery System
      • By Physical Form
      • By Application
      • By End Use
    • Key Takeaways
  15. East Asia Market Analysis 2020 to 2024 and Forecast 2025 to 2035, By Country
    • Historical Market Size Value (USD Million) & Volume (Units) Trend Analysis By Market Taxonomy, 2020 to 2024
    • Market Size Value (USD Million) & Volume (Units) Forecast By Market Taxonomy, 2025 to 2035
      • By Country
        • China
        • Japan
        • South Korea
      • By Functional Mechanism
      • By Ingredient Type
      • By Delivery System
      • By Physical Form
      • By Application
      • By End Use
    • Market Attractiveness Analysis
      • By Country
      • By Functional Mechanism
      • By Ingredient Type
      • By Delivery System
      • By Physical Form
      • By Application
      • By End Use
    • Key Takeaways
  16. South Asia & Pacific Market Analysis 2020 to 2024 and Forecast 2025 to 2035, By Country
    • Historical Market Size Value (USD Million) & Volume (Units) Trend Analysis By Market Taxonomy, 2020 to 2024
    • Market Size Value (USD Million) & Volume (Units) Forecast By Market Taxonomy, 2025 to 2035
      • By Country
        • India
        • Thailand
        • Malaysia
        • Indonesia
        • Singapore
        • Vietnam
        • Australia
        • New Zealand
        • Rest of South Asia
      • By Functional Mechanism
      • By Ingredient Type
      • By Delivery System
      • By Physical Form
      • By Application
      • By End Use
    • Market Attractiveness Analysis
      • By Country
      • By Functional Mechanism
      • By Ingredient Type
      • By Delivery System
      • By Physical Form
      • By Application
      • By End Use
    • Key Takeaways
  17. Middle East and Africa Market Analysis 2020 to 2024 and Forecast 2025 to 2035, By Country
    • Historical Market Size Value (USD Million) & Volume (Units) Trend Analysis By Market Taxonomy, 2020 to 2024
    • Market Size Value (USD Million) & Volume (Units) Forecast By Market Taxonomy, 2025 to 2035
      • By Country
        • Turkey
        • UAE
        • Saudi Arabia
        • Israel
        • Other GCC Countries
        • North Africa
        • South Africa
      • By Functional Mechanism
      • By Ingredient Type
      • By Delivery System
      • By Physical Form
      • By Application
      • By End Use
    • Market Attractiveness Analysis
      • By Country
      • By Functional Mechanism
      • By Ingredient Type
      • By Delivery System
      • By Physical Form
      • By Application
      • By End Use
    • Key Takeaways
  18. Key Countries Market Analysis
    • USA
      • Pricing Analysis
      • Market Share Analysis, 2024
        • By Functional Mechanism
        • By Ingredient Type
        • By Delivery System
        • By Physical Form
        • By Application
        • By End Use
    • Canada
      • Pricing Analysis
      • Market Share Analysis, 2024
        • By Functional Mechanism
        • By Ingredient Type
        • By Delivery System
        • By Physical Form
        • By Application
        • By End Use
    • Brazil
      • Pricing Analysis
      • Market Share Analysis, 2024
        • By Functional Mechanism
        • By Ingredient Type
        • By Delivery System
        • By Physical Form
        • By Application
        • By End Use
    • Mexico
      • Pricing Analysis
      • Market Share Analysis, 2024
        • By Functional Mechanism
        • By Ingredient Type
        • By Delivery System
        • By Physical Form
        • By Application
        • By End Use
    • Colombia
      • Pricing Analysis
      • Market Share Analysis, 2024
        • By Functional Mechanism
        • By Ingredient Type
        • By Delivery System
        • By Physical Form
        • By Application
        • By End Use
    • Germany
      • Pricing Analysis
      • Market Share Analysis, 2024
        • By Functional Mechanism
        • By Ingredient Type
        • By Delivery System
        • By Physical Form
        • By Application
        • By End Use
    • UK
      • Pricing Analysis
      • Market Share Analysis, 2024
        • By Functional Mechanism
        • By Ingredient Type
        • By Delivery System
        • By Physical Form
        • By Application
        • By End Use
    • France
      • Pricing Analysis
      • Market Share Analysis, 2024
        • By Functional Mechanism
        • By Ingredient Type
        • By Delivery System
        • By Physical Form
        • By Application
        • By End Use
    • Italy
      • Pricing Analysis
      • Market Share Analysis, 2024
        • By Functional Mechanism
        • By Ingredient Type
        • By Delivery System
        • By Physical Form
        • By Application
        • By End Use
    • Spain
      • Pricing Analysis
      • Market Share Analysis, 2024
        • By Functional Mechanism
        • By Ingredient Type
        • By Delivery System
        • By Physical Form
        • By Application
        • By End Use
    • Belgium
      • Pricing Analysis
      • Market Share Analysis, 2024
        • By Functional Mechanism
        • By Ingredient Type
        • By Delivery System
        • By Physical Form
        • By Application
        • By End Use
    • Netherlands
      • Pricing Analysis
      • Market Share Analysis, 2024
        • By Functional Mechanism
        • By Ingredient Type
        • By Delivery System
        • By Physical Form
        • By Application
        • By End Use
    • Nordic
      • Pricing Analysis
      • Market Share Analysis, 2024
        • By Functional Mechanism
        • By Ingredient Type
        • By Delivery System
        • By Physical Form
        • By Application
        • By End Use
    • Switzerland
      • Pricing Analysis
      • Market Share Analysis, 2024
        • By Functional Mechanism
        • By Ingredient Type
        • By Delivery System
        • By Physical Form
        • By Application
        • By End Use
    • Russia
      • Pricing Analysis
      • Market Share Analysis, 2024
        • By Functional Mechanism
        • By Ingredient Type
        • By Delivery System
        • By Physical Form
        • By Application
        • By End Use
    • Poland
      • Pricing Analysis
      • Market Share Analysis, 2024
        • By Functional Mechanism
        • By Ingredient Type
        • By Delivery System
        • By Physical Form
        • By Application
        • By End Use
    • China
      • Pricing Analysis
      • Market Share Analysis, 2024
        • By Functional Mechanism
        • By Ingredient Type
        • By Delivery System
        • By Physical Form
        • By Application
        • By End Use
    • Japan
      • Pricing Analysis
      • Market Share Analysis, 2024
        • By Functional Mechanism
        • By Ingredient Type
        • By Delivery System
        • By Physical Form
        • By Application
        • By End Use
    • South Korea
      • Pricing Analysis
      • Market Share Analysis, 2024
        • By Functional Mechanism
        • By Ingredient Type
        • By Delivery System
        • By Physical Form
        • By Application
        • By End Use
    • India
      • Pricing Analysis
      • Market Share Analysis, 2024
        • By Functional Mechanism
        • By Ingredient Type
        • By Delivery System
        • By Physical Form
        • By Application
        • By End Use
    • Thailand
      • Pricing Analysis
      • Market Share Analysis, 2024
        • By Functional Mechanism
        • By Ingredient Type
        • By Delivery System
        • By Physical Form
        • By Application
        • By End Use
    • Indonesia
      • Pricing Analysis
      • Market Share Analysis, 2024
        • By Functional Mechanism
        • By Ingredient Type
        • By Delivery System
        • By Physical Form
        • By Application
        • By End Use
    • Australia
      • Pricing Analysis
      • Market Share Analysis, 2024
        • By Functional Mechanism
        • By Ingredient Type
        • By Delivery System
        • By Physical Form
        • By Application
        • By End Use
    • New Zealand
      • Pricing Analysis
      • Market Share Analysis, 2024
        • By Functional Mechanism
        • By Ingredient Type
        • By Delivery System
        • By Physical Form
        • By Application
        • By End Use
    • Turkey
      • Pricing Analysis
      • Market Share Analysis, 2024
        • By Functional Mechanism
        • By Ingredient Type
        • By Delivery System
        • By Physical Form
        • By Application
        • By End Use
    • UAE
      • Pricing Analysis
      • Market Share Analysis, 2024
        • By Functional Mechanism
        • By Ingredient Type
        • By Delivery System
        • By Physical Form
        • By Application
        • By End Use
    • Saudi Arabia
      • Pricing Analysis
      • Market Share Analysis, 2024
        • By Functional Mechanism
        • By Ingredient Type
        • By Delivery System
        • By Physical Form
        • By Application
        • By End Use
    • Israel
      • Pricing Analysis
      • Market Share Analysis, 2024
        • By Functional Mechanism
        • By Ingredient Type
        • By Delivery System
        • By Physical Form
        • By Application
        • By End Use
    • North Africa
      • Pricing Analysis
      • Market Share Analysis, 2024
        • By Functional Mechanism
        • By Ingredient Type
        • By Delivery System
        • By Physical Form
        • By Application
        • By End Use
    • South Africa
      • Pricing Analysis
      • Market Share Analysis, 2024
        • By Functional Mechanism
        • By Ingredient Type
        • By Delivery System
        • By Physical Form
        • By Application
        • By End Use
  19. Market Structure Analysis
    • Competition Dashboard
    • Competition Benchmarking
    • Market Share Analysis of Top Players
      • By Regional
      • By Functional Mechanism
      • By Ingredient Type
      • By Delivery System
      • By Physical Form
      • By Application
      • By End Use
  20. Competition Analysis
    • Competition Deep Dive
      • Clariant
        • Overview
        • Product Portfolio
        • Profitability by Market Segments (Product/Age /Sales Channel/Region)
        • Sales Footprint
        • Strategy Overview
          • Marketing Strategy
          • Product Strategy
          • Channel Strategy
      • Givaudan
        • Overview
        • Product Portfolio
        • Profitability by Market Segments (Product/Age /Sales Channel/Region)
        • Sales Footprint
        • Strategy Overview
          • Marketing Strategy
          • Product Strategy
          • Channel Strategy
      • Symrise
        • Overview
        • Product Portfolio
        • Profitability by Market Segments (Product/Age /Sales Channel/Region)
        • Sales Footprint
        • Strategy Overview
          • Marketing Strategy
          • Product Strategy
          • Channel Strategy
      • Croda
        • Overview
        • Product Portfolio
        • Profitability by Market Segments (Product/Age /Sales Channel/Region)
        • Sales Footprint
        • Strategy Overview
          • Marketing Strategy
          • Product Strategy
          • Channel Strategy
      • BASF
        • Overview
        • Product Portfolio
        • Profitability by Market Segments (Product/Age /Sales Channel/Region)
        • Sales Footprint
        • Strategy Overview
          • Marketing Strategy
          • Product Strategy
          • Channel Strategy
      • Ashland
        • Overview
        • Product Portfolio
        • Profitability by Market Segments (Product/Age /Sales Channel/Region)
        • Sales Footprint
        • Strategy Overview
          • Marketing Strategy
          • Product Strategy
          • Channel Strategy
      • Rahn
        • Overview
        • Product Portfolio
        • Profitability by Market Segments (Product/Age /Sales Channel/Region)
        • Sales Footprint
        • Strategy Overview
          • Marketing Strategy
          • Product Strategy
          • Channel Strategy
      • Seppic
        • Overview
        • Product Portfolio
        • Profitability by Market Segments (Product/Age /Sales Channel/Region)
        • Sales Footprint
        • Strategy Overview
          • Marketing Strategy
          • Product Strategy
          • Channel Strategy
      • DSM-Firmenich
        • Overview
        • Product Portfolio
        • Profitability by Market Segments (Product/Age /Sales Channel/Region)
        • Sales Footprint
        • Strategy Overview
          • Marketing Strategy
          • Product Strategy
          • Channel Strategy
      • Greentech
        • Overview
        • Product Portfolio
        • Profitability by Market Segments (Product/Age /Sales Channel/Region)
        • Sales Footprint
        • Strategy Overview
          • Marketing Strategy
          • Product Strategy
          • Channel Strategy
  21. Assumptions & Acronyms Used
  22. Research Methodology

List of Tables

  • Table 1: Global Market Value (USD Million) Forecast by Region, 2020-2035
  • Table 2: Global Market Volume (Units) Forecast by Region, 2020-2035
  • Table 3: Global Market Value (USD Million) Forecast by Functional Mechanism, 2020-2035
  • Table 4: Global Market Volume (Units) Forecast by Functional Mechanism, 2020-2035
  • Table 5: Global Market Value (USD Million) Forecast by Ingredient Type, 2020-2035
  • Table 6: Global Market Volume (Units) Forecast by Ingredient Type, 2020-2035
  • Table 7: Global Market Value (USD Million) Forecast by Delivery System, 2020-2035
  • Table 8: Global Market Volume (Units) Forecast by Delivery System, 2020-2035
  • Table 9: Global Market Value (USD Million) Forecast by Physical Form, 2020-2035
  • Table 10: Global Market Volume (Units) Forecast by Physical Form, 2020-2035
  • Table 11: Global Market Value (USD Million) Forecast by Application, 2020-2035
  • Table 12: Global Market Volume (Units) Forecast by Application, 2020-2035
  • Table 13: Global Market Value (USD Million) Forecast by End Use, 2020-2035
  • Table 14: Global Market Volume (Units) Forecast by End Use, 2020-2035
  • Table 15: North America Market Value (USD Million) Forecast by Country, 2020-2035
  • Table 16: North America Market Volume (Units) Forecast by Country, 2020-2035
  • Table 17: North America Market Value (USD Million) Forecast by Functional Mechanism, 2020-2035
  • Table 18: North America Market Volume (Units) Forecast by Functional Mechanism, 2020-2035
  • Table 19: North America Market Value (USD Million) Forecast by Ingredient Type, 2020-2035
  • Table 20: North America Market Volume (Units) Forecast by Ingredient Type, 2020-2035
  • Table 21: North America Market Value (USD Million) Forecast by Delivery System, 2020-2035
  • Table 22: North America Market Volume (Units) Forecast by Delivery System, 2020-2035
  • Table 23: North America Market Value (USD Million) Forecast by Physical Form, 2020-2035
  • Table 24: North America Market Volume (Units) Forecast by Physical Form, 2020-2035
  • Table 25: North America Market Value (USD Million) Forecast by Application, 2020-2035
  • Table 26: North America Market Volume (Units) Forecast by Application, 2020-2035
  • Table 27: North America Market Value (USD Million) Forecast by End Use, 2020-2035
  • Table 28: North America Market Volume (Units) Forecast by End Use, 2020-2035
  • Table 29: Latin America Market Value (USD Million) Forecast by Country, 2020-2035
  • Table 30: Latin America Market Volume (Units) Forecast by Country, 2020-2035
  • Table 31: Latin America Market Value (USD Million) Forecast by Functional Mechanism, 2020-2035
  • Table 32: Latin America Market Volume (Units) Forecast by Functional Mechanism, 2020-2035
  • Table 33: Latin America Market Value (USD Million) Forecast by Ingredient Type, 2020-2035
  • Table 34: Latin America Market Volume (Units) Forecast by Ingredient Type, 2020-2035
  • Table 35: Latin America Market Value (USD Million) Forecast by Delivery System, 2020-2035
  • Table 36: Latin America Market Volume (Units) Forecast by Delivery System, 2020-2035
  • Table 37: Latin America Market Value (USD Million) Forecast by Physical Form, 2020-2035
  • Table 38: Latin America Market Volume (Units) Forecast by Physical Form, 2020-2035
  • Table 39: Latin America Market Value (USD Million) Forecast by Application, 2020-2035
  • Table 40: Latin America Market Volume (Units) Forecast by Application, 2020-2035
  • Table 41: Latin America Market Value (USD Million) Forecast by End Use, 2020-2035
  • Table 42: Latin America Market Volume (Units) Forecast by End Use, 2020-2035
  • Table 43: Europe Market Value (USD Million) Forecast by Country, 2020-2035
  • Table 44: Europe Market Volume (Units) Forecast by Country, 2020-2035
  • Table 45: Europe Market Value (USD Million) Forecast by Functional Mechanism, 2020-2035
  • Table 46: Europe Market Volume (Units) Forecast by Functional Mechanism, 2020-2035
  • Table 47: Europe Market Value (USD Million) Forecast by Ingredient Type, 2020-2035
  • Table 48: Europe Market Volume (Units) Forecast by Ingredient Type, 2020-2035
  • Table 49: Europe Market Value (USD Million) Forecast by Delivery System, 2020-2035
  • Table 50: Europe Market Volume (Units) Forecast by Delivery System, 2020-2035
  • Table 51: Europe Market Value (USD Million) Forecast by Physical Form, 2020-2035
  • Table 52: Europe Market Volume (Units) Forecast by Physical Form, 2020-2035
  • Table 53: Europe Market Value (USD Million) Forecast by Application, 2020-2035
  • Table 54: Europe Market Volume (Units) Forecast by Application, 2020-2035
  • Table 55: Europe Market Value (USD Million) Forecast by End Use, 2020-2035
  • Table 56: Europe Market Volume (Units) Forecast by End Use, 2020-2035
  • Table 57: East Asia Market Value (USD Million) Forecast by Country, 2020-2035
  • Table 58: East Asia Market Volume (Units) Forecast by Country, 2020-2035
  • Table 59: East Asia Market Value (USD Million) Forecast by Functional Mechanism, 2020-2035
  • Table 60: East Asia Market Volume (Units) Forecast by Functional Mechanism, 2020-2035
  • Table 61: East Asia Market Value (USD Million) Forecast by Ingredient Type, 2020-2035
  • Table 62: East Asia Market Volume (Units) Forecast by Ingredient Type, 2020-2035
  • Table 63: East Asia Market Value (USD Million) Forecast by Delivery System, 2020-2035
  • Table 64: East Asia Market Volume (Units) Forecast by Delivery System, 2020-2035
  • Table 65: East Asia Market Value (USD Million) Forecast by Physical Form, 2020-2035
  • Table 66: East Asia Market Volume (Units) Forecast by Physical Form, 2020-2035
  • Table 67: East Asia Market Value (USD Million) Forecast by Application, 2020-2035
  • Table 68: East Asia Market Volume (Units) Forecast by Application, 2020-2035
  • Table 69: East Asia Market Value (USD Million) Forecast by End Use, 2020-2035
  • Table 70: East Asia Market Volume (Units) Forecast by End Use, 2020-2035
  • Table 71: South Asia & Pacific Market Value (USD Million) Forecast by Country, 2020-2035
  • Table 72: South Asia & Pacific Market Volume (Units) Forecast by Country, 2020-2035
  • Table 73: South Asia & Pacific Market Value (USD Million) Forecast by Functional Mechanism, 2020-2035
  • Table 74: South Asia & Pacific Market Volume (Units) Forecast by Functional Mechanism, 2020-2035
  • Table 75: South Asia & Pacific Market Value (USD Million) Forecast by Ingredient Type, 2020-2035
  • Table 76: South Asia & Pacific Market Volume (Units) Forecast by Ingredient Type, 2020-2035
  • Table 77: South Asia & Pacific Market Value (USD Million) Forecast by Delivery System, 2020-2035
  • Table 78: South Asia & Pacific Market Volume (Units) Forecast by Delivery System, 2020-2035
  • Table 79: South Asia & Pacific Market Value (USD Million) Forecast by Physical Form, 2020-2035
  • Table 80: South Asia & Pacific Market Volume (Units) Forecast by Physical Form, 2020-2035
  • Table 81: South Asia & Pacific Market Value (USD Million) Forecast by Application, 2020-2035
  • Table 82: South Asia & Pacific Market Volume (Units) Forecast by Application, 2020-2035
  • Table 83: South Asia & Pacific Market Value (USD Million) Forecast by End Use, 2020-2035
  • Table 84: South Asia & Pacific Market Volume (Units) Forecast by End Use, 2020-2035
  • Table 85: Middle East and Africa Market Value (USD Million) Forecast by Country, 2020-2035
  • Table 86: Middle East and Africa Market Volume (Units) Forecast by Country, 2020-2035
  • Table 87: Middle East and Africa Market Value (USD Million) Forecast by Functional Mechanism, 2020-2035
  • Table 88: Middle East and Africa Market Volume (Units) Forecast by Functional Mechanism, 2020-2035
  • Table 89: Middle East and Africa Market Value (USD Million) Forecast by Ingredient Type, 2020-2035
  • Table 90: Middle East and Africa Market Volume (Units) Forecast by Ingredient Type, 2020-2035
  • Table 91: Middle East and Africa Market Value (USD Million) Forecast by Delivery System, 2020-2035
  • Table 92: Middle East and Africa Market Volume (Units) Forecast by Delivery System, 2020-2035
  • Table 93: Middle East and Africa Market Value (USD Million) Forecast by Physical Form, 2020-2035
  • Table 94: Middle East and Africa Market Volume (Units) Forecast by Physical Form, 2020-2035
  • Table 95: Middle East and Africa Market Value (USD Million) Forecast by Application, 2020-2035
  • Table 96: Middle East and Africa Market Volume (Units) Forecast by Application, 2020-2035
  • Table 97: Middle East and Africa Market Value (USD Million) Forecast by End Use, 2020-2035
  • Table 98: Middle East and Africa Market Volume (Units) Forecast by End Use, 2020-2035

List of Figures

  • Figure 1: Global Market Value (USD Million) by Functional Mechanism, 2025-2035
  • Figure 2: Global Market Value (USD Million) by Ingredient Type, 2025-2035
  • Figure 3: Global Market Value (USD Million) by Delivery System, 2025-2035
  • Figure 4: Global Market Value (USD Million) by Physical Form, 2025-2035
  • Figure 5: Global Market Value (USD Million) by Application, 2025-2035
  • Figure 6: Global Market Value (USD Million) by End Use, 2025-2035
  • Figure 7: Global Market Value (USD Million) by Region, 2025-2035
  • Figure 8: Global Market Value (USD Million) Analysis by Region, 2020-2035
  • Figure 9: Global Market Volume (Units) Analysis by Region, 2020-2035
  • Figure 10: Global Market Value Share (%) and BPS Analysis by Region, 2025-2035
  • Figure 11: Global Market Y-o-Y Growth (%) Projections by Region, 2025-2035
  • Figure 12: Global Market Value (USD Million) Analysis by Functional Mechanism, 2020-2035
  • Figure 13: Global Market Volume (Units) Analysis by Functional Mechanism, 2020-2035
  • Figure 14: Global Market Value Share (%) and BPS Analysis by Functional Mechanism, 2025-2035
  • Figure 15: Global Market Y-o-Y Growth (%) Projections by Functional Mechanism, 2025-2035
  • Figure 16: Global Market Value (USD Million) Analysis by Ingredient Type, 2020-2035
  • Figure 17: Global Market Volume (Units) Analysis by Ingredient Type, 2020-2035
  • Figure 18: Global Market Value Share (%) and BPS Analysis by Ingredient Type, 2025-2035
  • Figure 19: Global Market Y-o-Y Growth (%) Projections by Ingredient Type, 2025-2035
  • Figure 20: Global Market Value (USD Million) Analysis by Delivery System, 2020-2035
  • Figure 21: Global Market Volume (Units) Analysis by Delivery System, 2020-2035
  • Figure 22: Global Market Value Share (%) and BPS Analysis by Delivery System, 2025-2035
  • Figure 23: Global Market Y-o-Y Growth (%) Projections by Delivery System, 2025-2035
  • Figure 24: Global Market Value (USD Million) Analysis by Physical Form, 2020-2035
  • Figure 25: Global Market Volume (Units) Analysis by Physical Form, 2020-2035
  • Figure 26: Global Market Value Share (%) and BPS Analysis by Physical Form, 2025-2035
  • Figure 27: Global Market Y-o-Y Growth (%) Projections by Physical Form, 2025-2035
  • Figure 28: Global Market Value (USD Million) Analysis by Application, 2020-2035
  • Figure 29: Global Market Volume (Units) Analysis by Application, 2020-2035
  • Figure 30: Global Market Value Share (%) and BPS Analysis by Application, 2025-2035
  • Figure 31: Global Market Y-o-Y Growth (%) Projections by Application, 2025-2035
  • Figure 32: Global Market Value (USD Million) Analysis by End Use, 2020-2035
  • Figure 33: Global Market Volume (Units) Analysis by End Use, 2020-2035
  • Figure 34: Global Market Value Share (%) and BPS Analysis by End Use, 2025-2035
  • Figure 35: Global Market Y-o-Y Growth (%) Projections by End Use, 2025-2035
  • Figure 36: Global Market Attractiveness by Functional Mechanism, 2025-2035
  • Figure 37: Global Market Attractiveness by Ingredient Type, 2025-2035
  • Figure 38: Global Market Attractiveness by Delivery System, 2025-2035
  • Figure 39: Global Market Attractiveness by Physical Form, 2025-2035
  • Figure 40: Global Market Attractiveness by Application, 2025-2035
  • Figure 41: Global Market Attractiveness by End Use, 2025-2035
  • Figure 42: Global Market Attractiveness by Region, 2025-2035
  • Figure 43: North America Market Value (USD Million) by Functional Mechanism, 2025-2035
  • Figure 44: North America Market Value (USD Million) by Ingredient Type, 2025-2035
  • Figure 45: North America Market Value (USD Million) by Delivery System, 2025-2035
  • Figure 46: North America Market Value (USD Million) by Physical Form, 2025-2035
  • Figure 47: North America Market Value (USD Million) by Application, 2025-2035
  • Figure 48: North America Market Value (USD Million) by End Use, 2025-2035
  • Figure 49: North America Market Value (USD Million) by Country, 2025-2035
  • Figure 50: North America Market Value (USD Million) Analysis by Country, 2020-2035
  • Figure 51: North America Market Volume (Units) Analysis by Country, 2020-2035
  • Figure 52: North America Market Value Share (%) and BPS Analysis by Country, 2025-2035
  • Figure 53: North America Market Y-o-Y Growth (%) Projections by Country, 2025-2035
  • Figure 54: North America Market Value (USD Million) Analysis by Functional Mechanism, 2020-2035
  • Figure 55: North America Market Volume (Units) Analysis by Functional Mechanism, 2020-2035
  • Figure 56: North America Market Value Share (%) and BPS Analysis by Functional Mechanism, 2025-2035
  • Figure 57: North America Market Y-o-Y Growth (%) Projections by Functional Mechanism, 2025-2035
  • Figure 58: North America Market Value (USD Million) Analysis by Ingredient Type, 2020-2035
  • Figure 59: North America Market Volume (Units) Analysis by Ingredient Type, 2020-2035
  • Figure 60: North America Market Value Share (%) and BPS Analysis by Ingredient Type, 2025-2035
  • Figure 61: North America Market Y-o-Y Growth (%) Projections by Ingredient Type, 2025-2035
  • Figure 62: North America Market Value (USD Million) Analysis by Delivery System, 2020-2035
  • Figure 63: North America Market Volume (Units) Analysis by Delivery System, 2020-2035
  • Figure 64: North America Market Value Share (%) and BPS Analysis by Delivery System, 2025-2035
  • Figure 65: North America Market Y-o-Y Growth (%) Projections by Delivery System, 2025-2035
  • Figure 66: North America Market Value (USD Million) Analysis by Physical Form, 2020-2035
  • Figure 67: North America Market Volume (Units) Analysis by Physical Form, 2020-2035
  • Figure 68: North America Market Value Share (%) and BPS Analysis by Physical Form, 2025-2035
  • Figure 69: North America Market Y-o-Y Growth (%) Projections by Physical Form, 2025-2035
  • Figure 70: North America Market Value (USD Million) Analysis by Application, 2020-2035
  • Figure 71: North America Market Volume (Units) Analysis by Application, 2020-2035
  • Figure 72: North America Market Value Share (%) and BPS Analysis by Application, 2025-2035
  • Figure 73: North America Market Y-o-Y Growth (%) Projections by Application, 2025-2035
  • Figure 74: North America Market Value (USD Million) Analysis by End Use, 2020-2035
  • Figure 75: North America Market Volume (Units) Analysis by End Use, 2020-2035
  • Figure 76: North America Market Value Share (%) and BPS Analysis by End Use, 2025-2035
  • Figure 77: North America Market Y-o-Y Growth (%) Projections by End Use, 2025-2035
  • Figure 78: North America Market Attractiveness by Functional Mechanism, 2025-2035
  • Figure 79: North America Market Attractiveness by Ingredient Type, 2025-2035
  • Figure 80: North America Market Attractiveness by Delivery System, 2025-2035
  • Figure 81: North America Market Attractiveness by Physical Form, 2025-2035
  • Figure 82: North America Market Attractiveness by Application, 2025-2035
  • Figure 83: North America Market Attractiveness by End Use, 2025-2035
  • Figure 84: North America Market Attractiveness by Country, 2025-2035
  • Figure 85: Latin America Market Value (USD Million) by Functional Mechanism, 2025-2035
  • Figure 86: Latin America Market Value (USD Million) by Ingredient Type, 2025-2035
  • Figure 87: Latin America Market Value (USD Million) by Delivery System, 2025-2035
  • Figure 88: Latin America Market Value (USD Million) by Physical Form, 2025-2035
  • Figure 89: Latin America Market Value (USD Million) by Application, 2025-2035
  • Figure 90: Latin America Market Value (USD Million) by End Use, 2025-2035
  • Figure 91: Latin America Market Value (USD Million) by Country, 2025-2035
  • Figure 92: Latin America Market Value (USD Million) Analysis by Country, 2020-2035
  • Figure 93: Latin America Market Volume (Units) Analysis by Country, 2020-2035
  • Figure 94: Latin America Market Value Share (%) and BPS Analysis by Country, 2025-2035
  • Figure 95: Latin America Market Y-o-Y Growth (%) Projections by Country, 2025-2035
  • Figure 96: Latin America Market Value (USD Million) Analysis by Functional Mechanism, 2020-2035
  • Figure 97: Latin America Market Volume (Units) Analysis by Functional Mechanism, 2020-2035
  • Figure 98: Latin America Market Value Share (%) and BPS Analysis by Functional Mechanism, 2025-2035
  • Figure 99: Latin America Market Y-o-Y Growth (%) Projections by Functional Mechanism, 2025-2035
  • Figure 100: Latin America Market Value (USD Million) Analysis by Ingredient Type, 2020-2035
  • Figure 101: Latin America Market Volume (Units) Analysis by Ingredient Type, 2020-2035
  • Figure 102: Latin America Market Value Share (%) and BPS Analysis by Ingredient Type, 2025-2035
  • Figure 103: Latin America Market Y-o-Y Growth (%) Projections by Ingredient Type, 2025-2035
  • Figure 104: Latin America Market Value (USD Million) Analysis by Delivery System, 2020-2035
  • Figure 105: Latin America Market Volume (Units) Analysis by Delivery System, 2020-2035
  • Figure 106: Latin America Market Value Share (%) and BPS Analysis by Delivery System, 2025-2035
  • Figure 107: Latin America Market Y-o-Y Growth (%) Projections by Delivery System, 2025-2035
  • Figure 108: Latin America Market Value (USD Million) Analysis by Physical Form, 2020-2035
  • Figure 109: Latin America Market Volume (Units) Analysis by Physical Form, 2020-2035
  • Figure 110: Latin America Market Value Share (%) and BPS Analysis by Physical Form, 2025-2035
  • Figure 111: Latin America Market Y-o-Y Growth (%) Projections by Physical Form, 2025-2035
  • Figure 112: Latin America Market Value (USD Million) Analysis by Application, 2020-2035
  • Figure 113: Latin America Market Volume (Units) Analysis by Application, 2020-2035
  • Figure 114: Latin America Market Value Share (%) and BPS Analysis by Application, 2025-2035
  • Figure 115: Latin America Market Y-o-Y Growth (%) Projections by Application, 2025-2035
  • Figure 116: Latin America Market Value (USD Million) Analysis by End Use, 2020-2035
  • Figure 117: Latin America Market Volume (Units) Analysis by End Use, 2020-2035
  • Figure 118: Latin America Market Value Share (%) and BPS Analysis by End Use, 2025-2035
  • Figure 119: Latin America Market Y-o-Y Growth (%) Projections by End Use, 2025-2035
  • Figure 120: Latin America Market Attractiveness by Functional Mechanism, 2025-2035
  • Figure 121: Latin America Market Attractiveness by Ingredient Type, 2025-2035
  • Figure 122: Latin America Market Attractiveness by Delivery System, 2025-2035
  • Figure 123: Latin America Market Attractiveness by Physical Form, 2025-2035
  • Figure 124: Latin America Market Attractiveness by Application, 2025-2035
  • Figure 125: Latin America Market Attractiveness by End Use, 2025-2035
  • Figure 126: Latin America Market Attractiveness by Country, 2025-2035
  • Figure 127: Europe Market Value (USD Million) by Functional Mechanism, 2025-2035
  • Figure 128: Europe Market Value (USD Million) by Ingredient Type, 2025-2035
  • Figure 129: Europe Market Value (USD Million) by Delivery System, 2025-2035
  • Figure 130: Europe Market Value (USD Million) by Physical Form, 2025-2035
  • Figure 131: Europe Market Value (USD Million) by Application, 2025-2035
  • Figure 132: Europe Market Value (USD Million) by End Use, 2025-2035
  • Figure 133: Europe Market Value (USD Million) by Country, 2025-2035
  • Figure 134: Europe Market Value (USD Million) Analysis by Country, 2020-2035
  • Figure 135: Europe Market Volume (Units) Analysis by Country, 2020-2035
  • Figure 136: Europe Market Value Share (%) and BPS Analysis by Country, 2025-2035
  • Figure 137: Europe Market Y-o-Y Growth (%) Projections by Country, 2025-2035
  • Figure 138: Europe Market Value (USD Million) Analysis by Functional Mechanism, 2020-2035
  • Figure 139: Europe Market Volume (Units) Analysis by Functional Mechanism, 2020-2035
  • Figure 140: Europe Market Value Share (%) and BPS Analysis by Functional Mechanism, 2025-2035
  • Figure 141: Europe Market Y-o-Y Growth (%) Projections by Functional Mechanism, 2025-2035
  • Figure 142: Europe Market Value (USD Million) Analysis by Ingredient Type, 2020-2035
  • Figure 143: Europe Market Volume (Units) Analysis by Ingredient Type, 2020-2035
  • Figure 144: Europe Market Value Share (%) and BPS Analysis by Ingredient Type, 2025-2035
  • Figure 145: Europe Market Y-o-Y Growth (%) Projections by Ingredient Type, 2025-2035
  • Figure 146: Europe Market Value (USD Million) Analysis by Delivery System, 2020-2035
  • Figure 147: Europe Market Volume (Units) Analysis by Delivery System, 2020-2035
  • Figure 148: Europe Market Value Share (%) and BPS Analysis by Delivery System, 2025-2035
  • Figure 149: Europe Market Y-o-Y Growth (%) Projections by Delivery System, 2025-2035
  • Figure 150: Europe Market Value (USD Million) Analysis by Physical Form, 2020-2035
  • Figure 151: Europe Market Volume (Units) Analysis by Physical Form, 2020-2035
  • Figure 152: Europe Market Value Share (%) and BPS Analysis by Physical Form, 2025-2035
  • Figure 153: Europe Market Y-o-Y Growth (%) Projections by Physical Form, 2025-2035
  • Figure 154: Europe Market Value (USD Million) Analysis by Application, 2020-2035
  • Figure 155: Europe Market Volume (Units) Analysis by Application, 2020-2035
  • Figure 156: Europe Market Value Share (%) and BPS Analysis by Application, 2025-2035
  • Figure 157: Europe Market Y-o-Y Growth (%) Projections by Application, 2025-2035
  • Figure 158: Europe Market Value (USD Million) Analysis by End Use, 2020-2035
  • Figure 159: Europe Market Volume (Units) Analysis by End Use, 2020-2035
  • Figure 160: Europe Market Value Share (%) and BPS Analysis by End Use, 2025-2035
  • Figure 161: Europe Market Y-o-Y Growth (%) Projections by End Use, 2025-2035
  • Figure 162: Europe Market Attractiveness by Functional Mechanism, 2025-2035
  • Figure 163: Europe Market Attractiveness by Ingredient Type, 2025-2035
  • Figure 164: Europe Market Attractiveness by Delivery System, 2025-2035
  • Figure 165: Europe Market Attractiveness by Physical Form, 2025-2035
  • Figure 166: Europe Market Attractiveness by Application, 2025-2035
  • Figure 167: Europe Market Attractiveness by End Use, 2025-2035
  • Figure 168: Europe Market Attractiveness by Country, 2025-2035
  • Figure 169: East Asia Market Value (USD Million) by Functional Mechanism, 2025-2035
  • Figure 170: East Asia Market Value (USD Million) by Ingredient Type, 2025-2035
  • Figure 171: East Asia Market Value (USD Million) by Delivery System, 2025-2035
  • Figure 172: East Asia Market Value (USD Million) by Physical Form, 2025-2035
  • Figure 173: East Asia Market Value (USD Million) by Application, 2025-2035
  • Figure 174: East Asia Market Value (USD Million) by End Use, 2025-2035
  • Figure 175: East Asia Market Value (USD Million) by Country, 2025-2035
  • Figure 176: East Asia Market Value (USD Million) Analysis by Country, 2020-2035
  • Figure 177: East Asia Market Volume (Units) Analysis by Country, 2020-2035
  • Figure 178: East Asia Market Value Share (%) and BPS Analysis by Country, 2025-2035
  • Figure 179: East Asia Market Y-o-Y Growth (%) Projections by Country, 2025-2035
  • Figure 180: East Asia Market Value (USD Million) Analysis by Functional Mechanism, 2020-2035
  • Figure 181: East Asia Market Volume (Units) Analysis by Functional Mechanism, 2020-2035
  • Figure 182: East Asia Market Value Share (%) and BPS Analysis by Functional Mechanism, 2025-2035
  • Figure 183: East Asia Market Y-o-Y Growth (%) Projections by Functional Mechanism, 2025-2035
  • Figure 184: East Asia Market Value (USD Million) Analysis by Ingredient Type, 2020-2035
  • Figure 185: East Asia Market Volume (Units) Analysis by Ingredient Type, 2020-2035
  • Figure 186: East Asia Market Value Share (%) and BPS Analysis by Ingredient Type, 2025-2035
  • Figure 187: East Asia Market Y-o-Y Growth (%) Projections by Ingredient Type, 2025-2035
  • Figure 188: East Asia Market Value (USD Million) Analysis by Delivery System, 2020-2035
  • Figure 189: East Asia Market Volume (Units) Analysis by Delivery System, 2020-2035
  • Figure 190: East Asia Market Value Share (%) and BPS Analysis by Delivery System, 2025-2035
  • Figure 191: East Asia Market Y-o-Y Growth (%) Projections by Delivery System, 2025-2035
  • Figure 192: East Asia Market Value (USD Million) Analysis by Physical Form, 2020-2035
  • Figure 193: East Asia Market Volume (Units) Analysis by Physical Form, 2020-2035
  • Figure 194: East Asia Market Value Share (%) and BPS Analysis by Physical Form, 2025-2035
  • Figure 195: East Asia Market Y-o-Y Growth (%) Projections by Physical Form, 2025-2035
  • Figure 196: East Asia Market Value (USD Million) Analysis by Application, 2020-2035
  • Figure 197: East Asia Market Volume (Units) Analysis by Application, 2020-2035
  • Figure 198: East Asia Market Value Share (%) and BPS Analysis by Application, 2025-2035
  • Figure 199: East Asia Market Y-o-Y Growth (%) Projections by Application, 2025-2035
  • Figure 200: East Asia Market Value (USD Million) Analysis by End Use, 2020-2035
  • Figure 201: East Asia Market Volume (Units) Analysis by End Use, 2020-2035
  • Figure 202: East Asia Market Value Share (%) and BPS Analysis by End Use, 2025-2035
  • Figure 203: East Asia Market Y-o-Y Growth (%) Projections by End Use, 2025-2035
  • Figure 204: East Asia Market Attractiveness by Functional Mechanism, 2025-2035
  • Figure 205: East Asia Market Attractiveness by Ingredient Type, 2025-2035
  • Figure 206: East Asia Market Attractiveness by Delivery System, 2025-2035
  • Figure 207: East Asia Market Attractiveness by Physical Form, 2025-2035
  • Figure 208: East Asia Market Attractiveness by Application, 2025-2035
  • Figure 209: East Asia Market Attractiveness by End Use, 2025-2035
  • Figure 210: East Asia Market Attractiveness by Country, 2025-2035
  • Figure 211: South Asia & Pacific Market Value (USD Million) by Functional Mechanism, 2025-2035
  • Figure 212: South Asia & Pacific Market Value (USD Million) by Ingredient Type, 2025-2035
  • Figure 213: South Asia & Pacific Market Value (USD Million) by Delivery System, 2025-2035
  • Figure 214: South Asia & Pacific Market Value (USD Million) by Physical Form, 2025-2035
  • Figure 215: South Asia & Pacific Market Value (USD Million) by Application, 2025-2035
  • Figure 216: South Asia & Pacific Market Value (USD Million) by End Use, 2025-2035
  • Figure 217: South Asia & Pacific Market Value (USD Million) by Country, 2025-2035
  • Figure 218: South Asia & Pacific Market Value (USD Million) Analysis by Country, 2020-2035
  • Figure 219: South Asia & Pacific Market Volume (Units) Analysis by Country, 2020-2035
  • Figure 220: South Asia & Pacific Market Value Share (%) and BPS Analysis by Country, 2025-2035
  • Figure 221: South Asia & Pacific Market Y-o-Y Growth (%) Projections by Country, 2025-2035
  • Figure 222: South Asia & Pacific Market Value (USD Million) Analysis by Functional Mechanism, 2020-2035
  • Figure 223: South Asia & Pacific Market Volume (Units) Analysis by Functional Mechanism, 2020-2035
  • Figure 224: South Asia & Pacific Market Value Share (%) and BPS Analysis by Functional Mechanism, 2025-2035
  • Figure 225: South Asia & Pacific Market Y-o-Y Growth (%) Projections by Functional Mechanism, 2025-2035
  • Figure 226: South Asia & Pacific Market Value (USD Million) Analysis by Ingredient Type, 2020-2035
  • Figure 227: South Asia & Pacific Market Volume (Units) Analysis by Ingredient Type, 2020-2035
  • Figure 228: South Asia & Pacific Market Value Share (%) and BPS Analysis by Ingredient Type, 2025-2035
  • Figure 229: South Asia & Pacific Market Y-o-Y Growth (%) Projections by Ingredient Type, 2025-2035
  • Figure 230: South Asia & Pacific Market Value (USD Million) Analysis by Delivery System, 2020-2035
  • Figure 231: South Asia & Pacific Market Volume (Units) Analysis by Delivery System, 2020-2035
  • Figure 232: South Asia & Pacific Market Value Share (%) and BPS Analysis by Delivery System, 2025-2035
  • Figure 233: South Asia & Pacific Market Y-o-Y Growth (%) Projections by Delivery System, 2025-2035
  • Figure 234: South Asia & Pacific Market Value (USD Million) Analysis by Physical Form, 2020-2035
  • Figure 235: South Asia & Pacific Market Volume (Units) Analysis by Physical Form, 2020-2035
  • Figure 236: South Asia & Pacific Market Value Share (%) and BPS Analysis by Physical Form, 2025-2035
  • Figure 237: South Asia & Pacific Market Y-o-Y Growth (%) Projections by Physical Form, 2025-2035
  • Figure 238: South Asia & Pacific Market Value (USD Million) Analysis by Application, 2020-2035
  • Figure 239: South Asia & Pacific Market Volume (Units) Analysis by Application, 2020-2035
  • Figure 240: South Asia & Pacific Market Value Share (%) and BPS Analysis by Application, 2025-2035
  • Figure 241: South Asia & Pacific Market Y-o-Y Growth (%) Projections by Application, 2025-2035
  • Figure 242: South Asia & Pacific Market Value (USD Million) Analysis by End Use, 2020-2035
  • Figure 243: South Asia & Pacific Market Volume (Units) Analysis by End Use, 2020-2035
  • Figure 244: South Asia & Pacific Market Value Share (%) and BPS Analysis by End Use, 2025-2035
  • Figure 245: South Asia & Pacific Market Y-o-Y Growth (%) Projections by End Use, 2025-2035
  • Figure 246: South Asia & Pacific Market Attractiveness by Functional Mechanism, 2025-2035
  • Figure 247: South Asia & Pacific Market Attractiveness by Ingredient Type, 2025-2035
  • Figure 248: South Asia & Pacific Market Attractiveness by Delivery System, 2025-2035
  • Figure 249: South Asia & Pacific Market Attractiveness by Physical Form, 2025-2035
  • Figure 250: South Asia & Pacific Market Attractiveness by Application, 2025-2035
  • Figure 251: South Asia & Pacific Market Attractiveness by End Use, 2025-2035
  • Figure 252: South Asia & Pacific Market Attractiveness by Country, 2025-2035
  • Figure 253: Middle East and Africa Market Value (USD Million) by Functional Mechanism, 2025-2035
  • Figure 254: Middle East and Africa Market Value (USD Million) by Ingredient Type, 2025-2035
  • Figure 255: Middle East and Africa Market Value (USD Million) by Delivery System, 2025-2035
  • Figure 256: Middle East and Africa Market Value (USD Million) by Physical Form, 2025-2035
  • Figure 257: Middle East and Africa Market Value (USD Million) by Application, 2025-2035
  • Figure 258: Middle East and Africa Market Value (USD Million) by End Use, 2025-2035
  • Figure 259: Middle East and Africa Market Value (USD Million) by Country, 2025-2035
  • Figure 260: Middle East and Africa Market Value (USD Million) Analysis by Country, 2020-2035
  • Figure 261: Middle East and Africa Market Volume (Units) Analysis by Country, 2020-2035
  • Figure 262: Middle East and Africa Market Value Share (%) and BPS Analysis by Country, 2025-2035
  • Figure 263: Middle East and Africa Market Y-o-Y Growth (%) Projections by Country, 2025-2035
  • Figure 264: Middle East and Africa Market Value (USD Million) Analysis by Functional Mechanism, 2020-2035
  • Figure 265: Middle East and Africa Market Volume (Units) Analysis by Functional Mechanism, 2020-2035
  • Figure 266: Middle East and Africa Market Value Share (%) and BPS Analysis by Functional Mechanism, 2025-2035
  • Figure 267: Middle East and Africa Market Y-o-Y Growth (%) Projections by Functional Mechanism, 2025-2035
  • Figure 268: Middle East and Africa Market Value (USD Million) Analysis by Ingredient Type, 2020-2035
  • Figure 269: Middle East and Africa Market Volume (Units) Analysis by Ingredient Type, 2020-2035
  • Figure 270: Middle East and Africa Market Value Share (%) and BPS Analysis by Ingredient Type, 2025-2035
  • Figure 271: Middle East and Africa Market Y-o-Y Growth (%) Projections by Ingredient Type, 2025-2035
  • Figure 272: Middle East and Africa Market Value (USD Million) Analysis by Delivery System, 2020-2035
  • Figure 273: Middle East and Africa Market Volume (Units) Analysis by Delivery System, 2020-2035
  • Figure 274: Middle East and Africa Market Value Share (%) and BPS Analysis by Delivery System, 2025-2035
  • Figure 275: Middle East and Africa Market Y-o-Y Growth (%) Projections by Delivery System, 2025-2035
  • Figure 276: Middle East and Africa Market Value (USD Million) Analysis by Physical Form, 2020-2035
  • Figure 277: Middle East and Africa Market Volume (Units) Analysis by Physical Form, 2020-2035
  • Figure 278: Middle East and Africa Market Value Share (%) and BPS Analysis by Physical Form, 2025-2035
  • Figure 279: Middle East and Africa Market Y-o-Y Growth (%) Projections by Physical Form, 2025-2035
  • Figure 280: Middle East and Africa Market Value (USD Million) Analysis by Application, 2020-2035
  • Figure 281: Middle East and Africa Market Volume (Units) Analysis by Application, 2020-2035
  • Figure 282: Middle East and Africa Market Value Share (%) and BPS Analysis by Application, 2025-2035
  • Figure 283: Middle East and Africa Market Y-o-Y Growth (%) Projections by Application, 2025-2035
  • Figure 284: Middle East and Africa Market Value (USD Million) Analysis by End Use, 2020-2035
  • Figure 285: Middle East and Africa Market Volume (Units) Analysis by End Use, 2020-2035
  • Figure 286: Middle East and Africa Market Value Share (%) and BPS Analysis by End Use, 2025-2035
  • Figure 287: Middle East and Africa Market Y-o-Y Growth (%) Projections by End Use, 2025-2035
  • Figure 288: Middle East and Africa Market Attractiveness by Functional Mechanism, 2025-2035
  • Figure 289: Middle East and Africa Market Attractiveness by Ingredient Type, 2025-2035
  • Figure 290: Middle East and Africa Market Attractiveness by Delivery System, 2025-2035
  • Figure 291: Middle East and Africa Market Attractiveness by Physical Form, 2025-2035
  • Figure 292: Middle East and Africa Market Attractiveness by Application, 2025-2035
  • Figure 293: Middle East and Africa Market Attractiveness by End Use, 2025-2035
  • Figure 294: Middle East and Africa Market Attractiveness by Country, 2025-2035

Frequently Asked Questions

How big is the Astringents Market in 2025?

The Astringents Market is estimated to be valued at USD 1,452.1 million in 2025.

What will be the size of the Astringents Market in 2035?

The market size for the Astringents Market is projected to reach USD 3,052.4 million by 2035.

How much will be the Astringents Market growth between 2025 and 2035?

The Astringents Market is expected to grow at a 7.7% CAGR between 2025 and 2035.

What are the key product types in the Astringents Market?

The key product types in the Astringents Market are facial toners, aftershaves, anti-acne cleansers, and body mists.

Which segment will contribute significant share in the Astringents Market in 2025?

In terms of delivery system, free form formats are set to command 52% share in the Astringents Market in 2025 (USD 755.09 million).

Future Market Insights

Astringents Market

Chat With

MaRIA

Hi There, I am MaRIA, Your Market Research Intelligence Assistant. How may I help you?