Autosampler Market Size and Share Forecast Outlook (2024 to 2034)

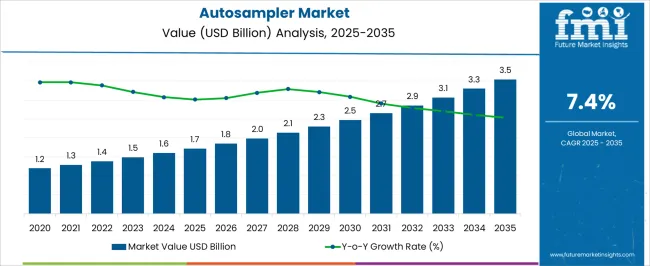
The global Autosampler Market size is estimated to stand at USD 1.6 billion in 2024. The market is expected to exceed a valuation of USD 3.4 billion by 2034, registering a moderate CAGR of 7.5%.

Autosampler Market Overview:

  • Autosampler demand is on the rise since the use of automation in laboratories is rapidly increasing.
  • The global trends in the autosampler industry spotlight the increasing demand for innovative technologies that streamline laboratory processes, enhance sample precision, and contribute to overall efficiency.
  • By 2034, there is likely to be more than a 2X surge in the sales of autosamplers. As the pharmaceutical and biopharmaceutical industries work harder to create products that work, more drug discovery, preclinical, and clinical studies are being conducted, which is expected to accelerate market growth.
Attributes Details
Autosampler Market Size (2024) USD 1.6 billion
Autosampler Market Forecasted Size (2034) USD 3.4 billion
Projected Value CAGR (2024 to 2034) 7.5%

Key Growth Drivers Accelerating the Autosampler Market

Autosamplers Pioneer a Flawless Workflow Experience! Autosamplers are useful for tasks beyond just transferring samples for examination.

  • These support every facet of an adaptable and effective workflow, from minimizing process order and sample information transcribing mistakes to carefully cleaning and safeguarding samples for analysis.
  • Autosamplers ensure precise and consistent handling of samples. This contributes to the reliability of analytical results, especially in autosampler chromatography setups.

Autosamplers are Transforming Environmental Monitoring! The environmental testing industry benefits significantly from autosampler applications.

  • Autosampler guarantees accurate and reproducible results crucial for environmental monitoring and compliance.
  • These automated devices streamline sample handling, reduce the risk of human error, and enhance the reliability of results.

Autosampler Market Surges with Enhanced Technological Attributes! Advancements in autosampler technology continue to drive market growth as manufacturers consistently develop sophisticated autosamplers with enhanced attributes.

  • Continuous innovations in chromatography technologies, such as autosampler in GC (Gas Chromatography) and autosampler in HPLC (high-performance liquid chromatography), are driving the market forward.
  • Companies like Bio-Rad Laboratories continue to introduce groundbreaking autosampler technologies, influencing market growth through research and development initiatives.

Autosamplers Shine in the Pharmaceutical Revolution! The pharmaceutical sector is conducting extensive research to create new drugs, and the government supports early-stage research, which promotes market expansion.

  • Drug discovery technologies have advanced due to developments in mass spectrometers, electrophoresis systems, chromatographs, and other techniques and devices.
  • Chromatography is crucial in pharmaceuticals for producing pure materials and detecting trace contaminants, driving a high demand for autosamplers.

Major Restraints Impacting Autosampler Market Revenue Expansion

Insufficient skills and limited knowledge in utilizing the system could impede the market's expansion. Users who lack expertise and techniques might face challenges, hindering the overall growth of the autosampler industry. Moreover, given the high cost of autosamplers, small and medium-sized laboratories may decide to use other sample preparation methods, which could hinder market growth.

Historical vs Future Analysis of the Autosampler Industry

From 2019 to 2023, the autosampler systems market showed promising growth, boasting a 9.2% CAGR. During this period, the pandemic has had an advantageous effect on the market. There has been a favorable impact and rise in demand for numerous services, including chromatographic technology, due to the COVID-19 pandemic.

Researchers have been employing chromatography, a potent laboratory-based analytical technique, to comprehend the Sars-CoV-2 virus better and create treatments, vaccines, and diagnostic tools that can help combat the COVID-19 pandemic.

Historical CAGR (2019 to 2023) 9.2%
Forecasted CAGR (2024 to 2034) 7.5%

The market for autosamplers is expected to exhibit a lower CAGR compared to the historical period. While the market has shown resilience in the past, the anticipated CAGR reflects current dynamics. Autosamplers cater to various applications.

These include autosamplers for reactors, autosamplers in cement plants, and autosamplers for wastewater analysis. This highlights their adaptability and widespread utility. This is also expected to have a highly positive impact on the global demand for autosamplers.

Emerging Trends Shaping the Global Autosampler Market

  • The evolving trends in the autosampler market indicate that as technology advances, autosamplers are going to become more complex.
  • There is a current trend in the industry toward autosamplers that put sample preservation first, protecting samples' integrity while they undergo examinations.
  • Global development prospects for the market are anticipated due to the pharmaceutical industry's increasing demand for chromatography.

Regional Demand Patterns for Autosamplers

The North America autosampler market stands out as a dominant force. The significant spending on research and development and technical developments in analytical methods are associated with this supremacy. Europe is witnessing continuous and steady growth in demand for autosamplers.

The market is growing because chromatographic methods are becoming more widely accepted. There is likely to be momentous progression in the Asia Pacific autosampler industry. The growing number of pharmaceutical and biotechnology industries in the region drives the market expansion.

Country United States
Forecasted CAGR (2024 to 2034) 7.7%
Market Size by 2034 USD 602.4 million
Country United Kingdom
Forecasted CAGR (2024 to 2034) 8.5%
Market Size by 2034 USD 135.3 million
Country China
Forecasted CAGR (2024 to 2034) 7.9%
Market Size by 2034 USD 521.6 million
Country Japan
Forecasted CAGR (2024 to 2034) 8.9%
Market Size by 2034 USD 368.6 million
Country South Korea
Forecasted CAGR (2024 to 2034) 9.3%
Market Size by 2034 USD 213.9 million

Autosampler Market Magnifies in the United States Amid Drug Development Boom

Demand for autosamplers in the United States is set to rise with an anticipated CAGR of 7.7% through 2034. Key factors influencing the demand include:

  • Increased expenditures in drug development, along with an increase in the sales of high pressure liquid chromatography equipment and an increasing frequency of chronic illnesses, are anticipated to drive market expansion in the country.
  • The market in the United States is deep-rooted. Thus, manufacturers are attempting to take a revenue share of autosamplers by introducing a fresh set of products. ThermoFisher Scientific introduced the Thermo Scientific™ TRACE™ 1600 Series Gas Chromatograph (GC) in January 2023. In order to meet any requirement for sample throughput, the system offers dependable automatic sample injection when paired with the Thermo Scientific™ AI/AS 1610 Liquid Autosampler.

Bioprocess Autosampler Boosts Market Dynamics in the United Kingdom

The United Kingdom's autosampler market is expected to surge at a CAGR of 8.5% through 2034. Top factors supporting the autosampler vials market expansion in the country include:

  • The country's expanding need for HPLC testing for drug approvals, substantial increases in clinical research, and substantial growth in research and development for pharmaceuticals are all factors driving the market expansion.
  • The country's market is also predicted to be driven by an increase in new product releases. For instance, with the introduction of the Bioprocess Autosampler in May 2023, Eppendorf made bioprocess data gathering simpler.

Aging Population Spurs Robust Autosampler Sales in China

The China autosampler market is forecasted to inflate at a CAGR of 7.9% through 2034. The main factors supporting the autosampler systems market growth are:

  • China's significant elderly population is boosting the need for chromatography equipment. Additionally, increased funding for research and development infrastructure in academic institutions is expected to contribute to a substantial growth rate in China.
  • Market participants are considering expanding in China as the country's market is expanding at a faster rate than that of the United States. For example, Thermo Fisher expanded the production capacity for biologics and sterile in December 2022 in Hangzhou, China, where autosamplers are going to be manufactured as well.

Medicine Innovation Propel Japan's Autosampler Market to New Heights

Sales of autosamplers in Japan are estimated to record a CAGR of 8.9% through 2034. The primary factors bolstering the autosamplers market size are:

  • The market is growing because of the growing number of biobanks and the large number of older people requiring novel medicine development.
  • Japan-based market players are not lagging behind when it comes to introducing innovative autosamplers. With its newly designed autosampler that uses the 3-dimensional drive, Sony unveiled a completely automated spectral cell analyzer that makes the examination of huge numbers of samples faster and easier.

South Korea's Autosampler Market Surges as Precision Takes Center Stage

The market in South Korea is likely to exhibit a CAGR of 9.3% through 2034. Reasons supporting the growth of the autosampler accessories market in the country include:

  • The growing emphasis on precision and efficiency in analytical processes drives the market growth in the country.
  • The increasing number of sectors doing research and development, coupled with strict quality control rules, is driving up demand for autosamplers.

Autosampler Market Analysis by Top Investment Segments

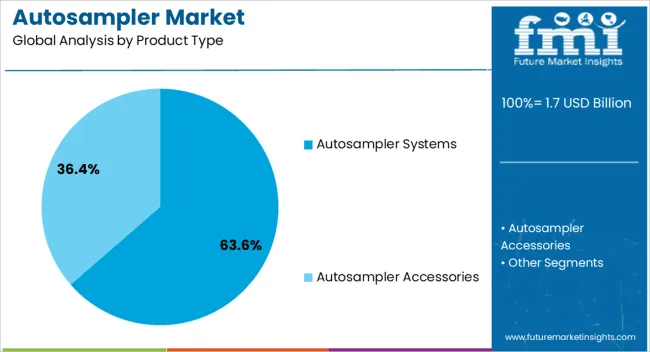
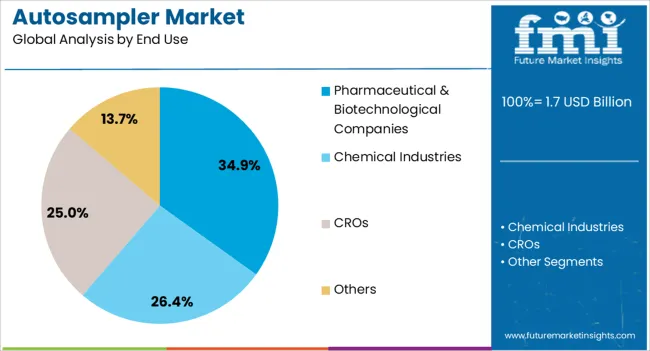
As far as the product type is concerned, the autosampler systems segment is likely to dominate the revenue share of autosamplers through 2034, registering a CAGR of 7.3%. Similarly, the pharmaceutical and biotechnological companies segment is expected to dominate in terms of end use, with a projected CAGR of 7.1% through 2034.

Segment Forecasted CAGR (2024 to 2034)
Autosampler Systems 7.3%
Pharmaceutical & biotechnological companies 7.1%

Autosampler Systems Secure Market Leadership with Key Advantages

The autosampler systems segment is anticipated to lead the way, holding an impressive autosampler market share. Factors supporting its sales are as follows:

  • Since autosampler systems can conserve time and effort by streamlining the sample analysis process, they are favored over accessories.
  • Multiple sample handling capabilities of autosampler systems significantly boost the total throughput of laboratory operations.
  • Data dependability is increased when autosampler systems are used because they produce more consistent sample readings.
  • Complete automation is provided by autosampler systems, which reduce human handling mistakes and provide a more dependable and uniform sample injection.

Pharmaceutical & Biotechnological Companies Propel Autosampler Market

Pharmaceutical and biotechnological companies take the top spot in the market when it comes to the consumption of autosamplers, a trend substantiated by factors such as:
  • To guarantee the lowest possible danger to patients, every product produced in the pharmaceutical sector needs to be of superior quality.
  • The pharmaceutical industry utilizes chromatography techniques for tasks such as identifying chemicals, preparing pure materials, separating chiral compounds, and drug development.
  • Companies investing in research for new treatments are benefiting from increased foreign investment and supportive regulatory environments.
  • Key players contribute to segmental growth by developing advanced products, such as ESI DX Autosamplers, which offer contamination-free sampling for specific instruments.

Competitive Landscape of the Autosampler Market

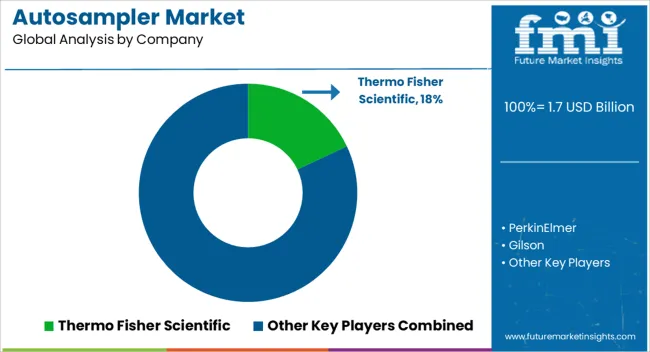
Autosampler market players employ diverse strategies to gain a competitive edge. A few prioritize innovation, consistently launching cutting-edge features and technologies. Some set themselves apart by providing dependable goods at competitive costs. For some, forming strategic alliances and working together is essential to expanding their market reach.

Recent Developments

  • In December 2023, Grabner Instruments, a leading producer of analytical laboratory testing equipment, introduced the AS Vision Autosampler. It is compatible with all FTIR Vision and vapor pressure analyzers in the Grabner Vision Series.
  • In September 2023, the latest all-in-one autosampler controlled by artificial intelligence, the 2800T, was introduced by HTA. In any GC or GC-MS system, it is able to automatically execute SPME, liquid sample injection, and headspace analysis.
  • In July 2023, Agilent Technologies introduced the latest version of the Agilent 1260 Infinity II Hybrid Mutlisampler. This HPLC autosampler has Agilent Feed Injection and traditional Flow-through modes.

Leading Companies Offering Autosampler Solutions

  • IQVIA
  • ICON Plc.
  • Charles River Chemical Industries.
  • Pharmaceutical Product Development, LLC.

Top Segments Studied in the Autosampler Market Report

By Product Type:

  • Autosampler Systems
    • GC Autosamplers
    • LC Autosamplers
  • Autosampler Accessories
    • Syringes & Needle
    • Vials
    • Septum
    • Others

By End Use:

  • Pharmaceutical & Biotechnological Companies
  • Chemical Industries
  • CROs
  • Others

By Region:

  • North America
  • Latin America
  • Europe
  • East Asia
  • South Asia & Pacific
  • Middle East & Africa (MEA)

Table of Content

  • 1. Executive Summary
  • 2. Market Overview
  • 3. Market Background
  • 4. Global Market Analysis 2019 to 2023 and Forecast, 2024 to 2034
  • 5. Global Market Analysis 2019 to 2023 and Forecast 2024 to 2034, By Product
    • 5.1 Systems
      • 5.1.1 Liquid Autosamplers
      • 5.1.2 Headspace Autosamplers
      • 5.1.3 All-in-one Autosamplers
      • 5.1.4 LC Autosamplers
    • 5.2 Accessories
      • 5.2.1 Syringes & Needle
      • 5.2.2 Vials
      • 5.2.3 Septum
      • 5.2.4 Others
  • 6. Global Market Analysis 2019 to 2023 and Forecast 2024 to 2034, By End-use
    • 6.1 Pharmaceutical & Biotechnological Companies
    • 6.2 Chemical Industries
    • 6.3 CROs
    • 6.4 Others
  • 7. Global Market Analysis 2019 to 2023 and Forecast 2024 to 2034, By Region
    • 7.1 North America
    • 7.2 Latin America
    • 7.3 Western Europe
    • 7.4 Eastern Europe
    • 7.5 South Asia and Pacific
    • 7.6 East Asia
    • 7.7 Middle East and Africa
  • 8. North America Market Analysis 2019 to 2023 and Forecast 2024 to 2034, By Country
  • 9. Latin America Market Analysis 2019 to 2023 and Forecast 2024 to 2034, By Country
  • 10. Western Europe Market Analysis 2019 to 2023 and Forecast 2024 to 2034, By Country
  • 11. Eastern Europe Market Analysis 2019 to 2023 and Forecast 2024 to 2034, By Country
  • 12. South Asia and Pacific Market Analysis 2019 to 2023 and Forecast 2024 to 2034, By Country
  • 13. East Asia Market Analysis 2019 to 2023 and Forecast 2024 to 2034, By Country
  • 14. Middle East and Africa Market Analysis 2019 to 2023 and Forecast 2024 to 2034, By Country
  • 15. Key Countries Market Analysis
  • 16. Market Structure Analysis
  • 17. Competition Analysis
    • 17.1 Thermo Fisher Scientific
    • 17.2 PerkinElmer
    • 17.3 Gilson
    • 17.4 Waters
    • 17.5 Agilent
    • 17.6 Bio-Rad
    • 17.7 Restek
    • 17.8 SCION
    • 17.9 Merck
    • 17.10 Shimadzu Corporation
  • 18. Assumptions & Acronyms Used
  • 19. Research Methodology

List of Tables

Table 1: Global Market Value (US$ Million) Forecast by Region, 2019 to 2034

Table 2: Global Market Volume (Units) Forecast by Region, 2019 to 2034

Table 3: Global Market Value (US$ Million) Forecast by Product, 2019 to 2034

Table 4: Global Market Volume (Units) Forecast by Product, 2019 to 2034

Table 5: Global Market Value (US$ Million) Forecast by End-use, 2019 to 2034

Table 6: Global Market Volume (Units) Forecast by End-use, 2019 to 2034

Table 7: North America Market Value (US$ Million) Forecast by Country, 2019 to 2034

Table 8: North America Market Volume (Units) Forecast by Country, 2019 to 2034

Table 9: North America Market Value (US$ Million) Forecast by Product, 2019 to 2034

Table 10: North America Market Volume (Units) Forecast by Product, 2019 to 2034

Table 11: North America Market Value (US$ Million) Forecast by End-use, 2019 to 2034

Table 12: North America Market Volume (Units) Forecast by End-use, 2019 to 2034

Table 13: Latin America Market Value (US$ Million) Forecast by Country, 2019 to 2034

Table 14: Latin America Market Volume (Units) Forecast by Country, 2019 to 2034

Table 15: Latin America Market Value (US$ Million) Forecast by Product, 2019 to 2034

Table 16: Latin America Market Volume (Units) Forecast by Product, 2019 to 2034

Table 17: Latin America Market Value (US$ Million) Forecast by End-use, 2019 to 2034

Table 18: Latin America Market Volume (Units) Forecast by End-use, 2019 to 2034

Table 19: Western Europe Market Value (US$ Million) Forecast by Country, 2019 to 2034

Table 20: Western Europe Market Volume (Units) Forecast by Country, 2019 to 2034

Table 21: Western Europe Market Value (US$ Million) Forecast by Product, 2019 to 2034

Table 22: Western Europe Market Volume (Units) Forecast by Product, 2019 to 2034

Table 23: Western Europe Market Value (US$ Million) Forecast by End-use, 2019 to 2034

Table 24: Western Europe Market Volume (Units) Forecast by End-use, 2019 to 2034

Table 25: Eastern Europe Market Value (US$ Million) Forecast by Country, 2019 to 2034

Table 26: Eastern Europe Market Volume (Units) Forecast by Country, 2019 to 2034

Table 27: Eastern Europe Market Value (US$ Million) Forecast by Product, 2019 to 2034

Table 28: Eastern Europe Market Volume (Units) Forecast by Product, 2019 to 2034

Table 29: Eastern Europe Market Value (US$ Million) Forecast by End-use, 2019 to 2034

Table 30: Eastern Europe Market Volume (Units) Forecast by End-use, 2019 to 2034

Table 31: South Asia and Pacific Market Value (US$ Million) Forecast by Country, 2019 to 2034

Table 32: South Asia and Pacific Market Volume (Units) Forecast by Country, 2019 to 2034

Table 33: South Asia and Pacific Market Value (US$ Million) Forecast by Product, 2019 to 2034

Table 34: South Asia and Pacific Market Volume (Units) Forecast by Product, 2019 to 2034

Table 35: South Asia and Pacific Market Value (US$ Million) Forecast by End-use, 2019 to 2034

Table 36: South Asia and Pacific Market Volume (Units) Forecast by End-use, 2019 to 2034

Table 37: East Asia Market Value (US$ Million) Forecast by Country, 2019 to 2034

Table 38: East Asia Market Volume (Units) Forecast by Country, 2019 to 2034

Table 39: East Asia Market Value (US$ Million) Forecast by Product, 2019 to 2034

Table 40: East Asia Market Volume (Units) Forecast by Product, 2019 to 2034

Table 41: East Asia Market Value (US$ Million) Forecast by End-use, 2019 to 2034

Table 42: East Asia Market Volume (Units) Forecast by End-use, 2019 to 2034

Table 43: Middle East and Africa Market Value (US$ Million) Forecast by Country, 2019 to 2034

Table 44: Middle East and Africa Market Volume (Units) Forecast by Country, 2019 to 2034

Table 45: Middle East and Africa Market Value (US$ Million) Forecast by Product, 2019 to 2034

Table 46: Middle East and Africa Market Volume (Units) Forecast by Product, 2019 to 2034

Table 47: Middle East and Africa Market Value (US$ Million) Forecast by End-use, 2019 to 2034

Table 48: Middle East and Africa Market Volume (Units) Forecast by End-use, 2019 to 2034

List of Figures

Figure 1: Global Market Value (US$ Million) by Product, 2024 to 2034

Figure 2: Global Market Value (US$ Million) by End-use, 2024 to 2034

Figure 3: Global Market Value (US$ Million) by Region, 2024 to 2034

Figure 4: Global Market Value (US$ Million) Analysis by Region, 2019 to 2034

Figure 5: Global Market Volume (Units) Analysis by Region, 2019 to 2034

Figure 6: Global Market Value Share (%) and BPS Analysis by Region, 2024 to 2034

Figure 7: Global Market Y-o-Y Growth (%) Projections by Region, 2024 to 2034

Figure 8: Global Market Value (US$ Million) Analysis by Product, 2019 to 2034

Figure 9: Global Market Volume (Units) Analysis by Product, 2019 to 2034

Figure 10: Global Market Value Share (%) and BPS Analysis by Product, 2024 to 2034

Figure 11: Global Market Y-o-Y Growth (%) Projections by Product, 2024 to 2034

Figure 12: Global Market Value (US$ Million) Analysis by End-use, 2019 to 2034

Figure 13: Global Market Volume (Units) Analysis by End-use, 2019 to 2034

Figure 14: Global Market Value Share (%) and BPS Analysis by End-use, 2024 to 2034

Figure 15: Global Market Y-o-Y Growth (%) Projections by End-use, 2024 to 2034

Figure 16: Global Market Attractiveness by Product, 2024 to 2034

Figure 17: Global Market Attractiveness by End-use, 2024 to 2034

Figure 18: Global Market Attractiveness by Region, 2024 to 2034

Figure 19: North America Market Value (US$ Million) by Product, 2024 to 2034

Figure 20: North America Market Value (US$ Million) by End-use, 2024 to 2034

Figure 21: North America Market Value (US$ Million) by Country, 2024 to 2034

Figure 22: North America Market Value (US$ Million) Analysis by Country, 2019 to 2034

Figure 23: North America Market Volume (Units) Analysis by Country, 2019 to 2034

Figure 24: North America Market Value Share (%) and BPS Analysis by Country, 2024 to 2034

Figure 25: North America Market Y-o-Y Growth (%) Projections by Country, 2024 to 2034

Figure 26: North America Market Value (US$ Million) Analysis by Product, 2019 to 2034

Figure 27: North America Market Volume (Units) Analysis by Product, 2019 to 2034

Figure 28: North America Market Value Share (%) and BPS Analysis by Product, 2024 to 2034

Figure 29: North America Market Y-o-Y Growth (%) Projections by Product, 2024 to 2034

Figure 30: North America Market Value (US$ Million) Analysis by End-use, 2019 to 2034

Figure 31: North America Market Volume (Units) Analysis by End-use, 2019 to 2034

Figure 32: North America Market Value Share (%) and BPS Analysis by End-use, 2024 to 2034

Figure 33: North America Market Y-o-Y Growth (%) Projections by End-use, 2024 to 2034

Figure 34: North America Market Attractiveness by Product, 2024 to 2034

Figure 35: North America Market Attractiveness by End-use, 2024 to 2034

Figure 36: North America Market Attractiveness by Country, 2024 to 2034

Figure 37: Latin America Market Value (US$ Million) by Product, 2024 to 2034

Figure 38: Latin America Market Value (US$ Million) by End-use, 2024 to 2034

Figure 39: Latin America Market Value (US$ Million) by Country, 2024 to 2034

Figure 40: Latin America Market Value (US$ Million) Analysis by Country, 2019 to 2034

Figure 41: Latin America Market Volume (Units) Analysis by Country, 2019 to 2034

Figure 42: Latin America Market Value Share (%) and BPS Analysis by Country, 2024 to 2034

Figure 43: Latin America Market Y-o-Y Growth (%) Projections by Country, 2024 to 2034

Figure 44: Latin America Market Value (US$ Million) Analysis by Product, 2019 to 2034

Figure 45: Latin America Market Volume (Units) Analysis by Product, 2019 to 2034

Figure 46: Latin America Market Value Share (%) and BPS Analysis by Product, 2024 to 2034

Figure 47: Latin America Market Y-o-Y Growth (%) Projections by Product, 2024 to 2034

Figure 48: Latin America Market Value (US$ Million) Analysis by End-use, 2019 to 2034

Figure 49: Latin America Market Volume (Units) Analysis by End-use, 2019 to 2034

Figure 50: Latin America Market Value Share (%) and BPS Analysis by End-use, 2024 to 2034

Figure 51: Latin America Market Y-o-Y Growth (%) Projections by End-use, 2024 to 2034

Figure 52: Latin America Market Attractiveness by Product, 2024 to 2034

Figure 53: Latin America Market Attractiveness by End-use, 2024 to 2034

Figure 54: Latin America Market Attractiveness by Country, 2024 to 2034

Figure 55: Western Europe Market Value (US$ Million) by Product, 2024 to 2034

Figure 56: Western Europe Market Value (US$ Million) by End-use, 2024 to 2034

Figure 57: Western Europe Market Value (US$ Million) by Country, 2024 to 2034

Figure 58: Western Europe Market Value (US$ Million) Analysis by Country, 2019 to 2034

Figure 59: Western Europe Market Volume (Units) Analysis by Country, 2019 to 2034

Figure 60: Western Europe Market Value Share (%) and BPS Analysis by Country, 2024 to 2034

Figure 61: Western Europe Market Y-o-Y Growth (%) Projections by Country, 2024 to 2034

Figure 62: Western Europe Market Value (US$ Million) Analysis by Product, 2019 to 2034

Figure 63: Western Europe Market Volume (Units) Analysis by Product, 2019 to 2034

Figure 64: Western Europe Market Value Share (%) and BPS Analysis by Product, 2024 to 2034

Figure 65: Western Europe Market Y-o-Y Growth (%) Projections by Product, 2024 to 2034

Figure 66: Western Europe Market Value (US$ Million) Analysis by End-use, 2019 to 2034

Figure 67: Western Europe Market Volume (Units) Analysis by End-use, 2019 to 2034

Figure 68: Western Europe Market Value Share (%) and BPS Analysis by End-use, 2024 to 2034

Figure 69: Western Europe Market Y-o-Y Growth (%) Projections by End-use, 2024 to 2034

Figure 70: Western Europe Market Attractiveness by Product, 2024 to 2034

Figure 71: Western Europe Market Attractiveness by End-use, 2024 to 2034

Figure 72: Western Europe Market Attractiveness by Country, 2024 to 2034

Figure 73: Eastern Europe Market Value (US$ Million) by Product, 2024 to 2034

Figure 74: Eastern Europe Market Value (US$ Million) by End-use, 2024 to 2034

Figure 75: Eastern Europe Market Value (US$ Million) by Country, 2024 to 2034

Figure 76: Eastern Europe Market Value (US$ Million) Analysis by Country, 2019 to 2034

Figure 77: Eastern Europe Market Volume (Units) Analysis by Country, 2019 to 2034

Figure 78: Eastern Europe Market Value Share (%) and BPS Analysis by Country, 2024 to 2034

Figure 79: Eastern Europe Market Y-o-Y Growth (%) Projections by Country, 2024 to 2034

Figure 80: Eastern Europe Market Value (US$ Million) Analysis by Product, 2019 to 2034

Figure 81: Eastern Europe Market Volume (Units) Analysis by Product, 2019 to 2034

Figure 82: Eastern Europe Market Value Share (%) and BPS Analysis by Product, 2024 to 2034

Figure 83: Eastern Europe Market Y-o-Y Growth (%) Projections by Product, 2024 to 2034

Figure 84: Eastern Europe Market Value (US$ Million) Analysis by End-use, 2019 to 2034

Figure 85: Eastern Europe Market Volume (Units) Analysis by End-use, 2019 to 2034

Figure 86: Eastern Europe Market Value Share (%) and BPS Analysis by End-use, 2024 to 2034

Figure 87: Eastern Europe Market Y-o-Y Growth (%) Projections by End-use, 2024 to 2034

Figure 88: Eastern Europe Market Attractiveness by Product, 2024 to 2034

Figure 89: Eastern Europe Market Attractiveness by End-use, 2024 to 2034

Figure 90: Eastern Europe Market Attractiveness by Country, 2024 to 2034

Figure 91: South Asia and Pacific Market Value (US$ Million) by Product, 2024 to 2034

Figure 92: South Asia and Pacific Market Value (US$ Million) by End-use, 2024 to 2034

Figure 93: South Asia and Pacific Market Value (US$ Million) by Country, 2024 to 2034

Figure 94: South Asia and Pacific Market Value (US$ Million) Analysis by Country, 2019 to 2034

Figure 95: South Asia and Pacific Market Volume (Units) Analysis by Country, 2019 to 2034

Figure 96: South Asia and Pacific Market Value Share (%) and BPS Analysis by Country, 2024 to 2034

Figure 97: South Asia and Pacific Market Y-o-Y Growth (%) Projections by Country, 2024 to 2034

Figure 98: South Asia and Pacific Market Value (US$ Million) Analysis by Product, 2019 to 2034

Figure 99: South Asia and Pacific Market Volume (Units) Analysis by Product, 2019 to 2034

Figure 100: South Asia and Pacific Market Value Share (%) and BPS Analysis by Product, 2024 to 2034

Figure 101: South Asia and Pacific Market Y-o-Y Growth (%) Projections by Product, 2024 to 2034

Figure 102: South Asia and Pacific Market Value (US$ Million) Analysis by End-use, 2019 to 2034

Figure 103: South Asia and Pacific Market Volume (Units) Analysis by End-use, 2019 to 2034

Figure 104: South Asia and Pacific Market Value Share (%) and BPS Analysis by End-use, 2024 to 2034

Figure 105: South Asia and Pacific Market Y-o-Y Growth (%) Projections by End-use, 2024 to 2034

Figure 106: South Asia and Pacific Market Attractiveness by Product, 2024 to 2034

Figure 107: South Asia and Pacific Market Attractiveness by End-use, 2024 to 2034

Figure 108: South Asia and Pacific Market Attractiveness by Country, 2024 to 2034

Figure 109: East Asia Market Value (US$ Million) by Product, 2024 to 2034

Figure 110: East Asia Market Value (US$ Million) by End-use, 2024 to 2034

Figure 111: East Asia Market Value (US$ Million) by Country, 2024 to 2034

Figure 112: East Asia Market Value (US$ Million) Analysis by Country, 2019 to 2034

Figure 113: East Asia Market Volume (Units) Analysis by Country, 2019 to 2034

Figure 114: East Asia Market Value Share (%) and BPS Analysis by Country, 2024 to 2034

Figure 115: East Asia Market Y-o-Y Growth (%) Projections by Country, 2024 to 2034

Figure 116: East Asia Market Value (US$ Million) Analysis by Product, 2019 to 2034

Figure 117: East Asia Market Volume (Units) Analysis by Product, 2019 to 2034

Figure 118: East Asia Market Value Share (%) and BPS Analysis by Product, 2024 to 2034

Figure 119: East Asia Market Y-o-Y Growth (%) Projections by Product, 2024 to 2034

Figure 120: East Asia Market Value (US$ Million) Analysis by End-use, 2019 to 2034

Figure 121: East Asia Market Volume (Units) Analysis by End-use, 2019 to 2034

Figure 122: East Asia Market Value Share (%) and BPS Analysis by End-use, 2024 to 2034

Figure 123: East Asia Market Y-o-Y Growth (%) Projections by End-use, 2024 to 2034

Figure 124: East Asia Market Attractiveness by Product, 2024 to 2034

Figure 125: East Asia Market Attractiveness by End-use, 2024 to 2034

Figure 126: East Asia Market Attractiveness by Country, 2024 to 2034

Figure 127: Middle East and Africa Market Value (US$ Million) by Product, 2024 to 2034

Figure 128: Middle East and Africa Market Value (US$ Million) by End-use, 2024 to 2034

Figure 129: Middle East and Africa Market Value (US$ Million) by Country, 2024 to 2034

Figure 130: Middle East and Africa Market Value (US$ Million) Analysis by Country, 2019 to 2034

Figure 131: Middle East and Africa Market Volume (Units) Analysis by Country, 2019 to 2034

Figure 132: Middle East and Africa Market Value Share (%) and BPS Analysis by Country, 2024 to 2034

Figure 133: Middle East and Africa Market Y-o-Y Growth (%) Projections by Country, 2024 to 2034

Figure 134: Middle East and Africa Market Value (US$ Million) Analysis by Product, 2019 to 2034

Figure 135: Middle East and Africa Market Volume (Units) Analysis by Product, 2019 to 2034

Figure 136: Middle East and Africa Market Value Share (%) and BPS Analysis by Product, 2024 to 2034

Figure 137: Middle East and Africa Market Y-o-Y Growth (%) Projections by Product, 2024 to 2034

Figure 138: Middle East and Africa Market Value (US$ Million) Analysis by End-use, 2019 to 2034

Figure 139: Middle East and Africa Market Volume (Units) Analysis by End-use, 2019 to 2034

Figure 140: Middle East and Africa Market Value Share (%) and BPS Analysis by End-use, 2024 to 2034

Figure 141: Middle East and Africa Market Y-o-Y Growth (%) Projections by End-use, 2024 to 2034

Figure 142: Middle East and Africa Market Attractiveness by Product, 2024 to 2034

Figure 143: Middle East and Africa Market Attractiveness by End-use, 2024 to 2034

Figure 144: Middle East and Africa Market Attractiveness by Country, 2024 to 2034

Frequently Asked Questions

How Big is the Autosampler Market?

The autosampler industry is forecasted to be valued at USD 1.6 billion in 2024.

What is the Demand Forecast for the Autosampler?

The autosamplers market value is projected to surpass USD 3.4 billion by 2034.

What is the Projected CAGR for the Autosampler Market?

The CAGR of the autosampler industry is estimated to be around 7.5% through 2034.

Which Countries Drive the Sales of Autosamplers?

The United States, China, and Japan are key consumers of autosamplers as of 2024.

Who is the Market Leader in Autosamplers?

IQVIA and ICON Plc. are autosampler industry leaders.

Future Market Insights

Autosampler Market