Bacillus-based Biofungicides Market Size and Share Forecast Outlook 2025 to 2035

The Bacillus-based Biofungicides Market is expected to record a valuation of USD 2,736.8 million in 2025 and rise to USD 7,733.2 million by 2035, reflecting a CAGR of 10.9%. The first half of the decade (2025 to 2030) is forecast to add nearly USD 1.8 billion in incremental value, supported by adoption in fruits, vegetables, vines, and organic farming systems. From 2030 to 2035, a further USD 3.0 billion is projected as novel formulations such as micro-encapsulation and suspension concentrates gain stronger traction.
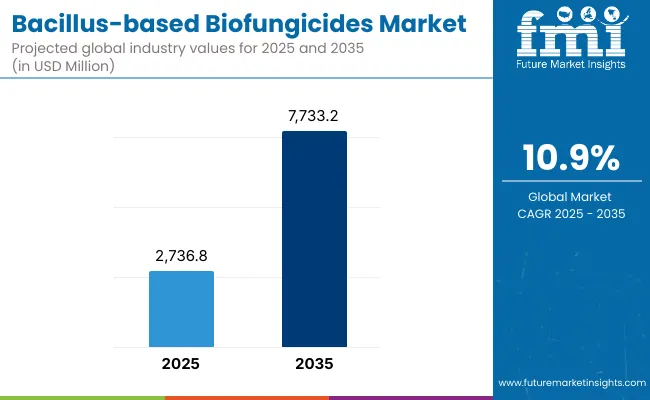
Quick Stats for Bacillus-based Biofungicides Market

  • Market Value (2025): USD 2,736.8 Million
  • Market Forecast Value (2035): USD 7,733.2 Million
  • Market Forecast CAGR (2025 to 2035): 10.9%
  • Leading Species in 2025: B. amyloliquefaciens / B. velezensis (38% share)
  • Leading Formulation in 2025: WP/WG/WDG (42% share)
  • Key Growth Regions (CAGR): South Asia & Pacific 13.2%, East Asia 12.8%, Latin America 11.6%
  • Top Companies: Bayer, BASF, Syngenta, Certis Biologicals, ProFarm Group, Novonesis, BioWorks, Andermatt Group, UPL, Sumitomo Chemical

Bacillus Based Biofungicides Market

Bacillus-based Biofungicides Market Key Takeaways

Metric Value
Bacillus-based Biofungicides Market Estimated Value In (2025E) USD 2,736.8 Million
Bacillus-based Biofungicides Market Forecast Value In (2035F) USD 7,733.2 Million
Forecast CAGR (2025 to 2035) 10.9%

North America and Europe, together accounting for 55% of demand in 2025, will retain influence through regulatory support for biologicals and product innovation by leading companies like Bayer, BASF, Syngenta, and Certis Biologicals. However, East Asia and South Asia & Pacific are anticipated to outpace global averages, with CAGRs of 12.8% and 13.2%, respectively, driven by crop-protection policies, residue restrictions, and expanding organic acreage.

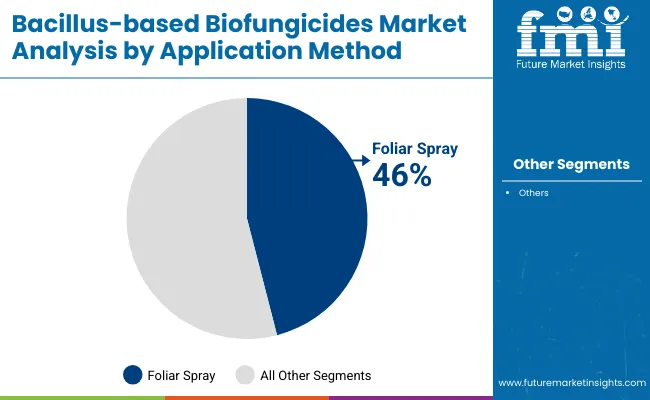
Mode of action is led by antibiosis at 44% share, where lipopeptides and metabolites provide broad-spectrum control, but induced systemic resistance (ISR) is set to post the highest CAGR of 12.9%. Foliar sprays dominate application at 46% share, while seed treatment and soil drench applications expand fastest.

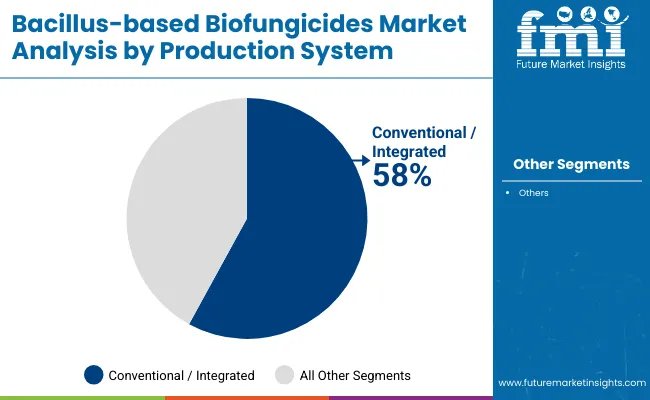
Conventional systems hold 58% share, but organic is forecast to climb rapidly at 13.5% CAGR, supported by sustainability goals and consumer-driven demand. The market’s outlook reflects strong convergence of biological efficacy, regulatory alignment, and farmer acceptance of integrated pest management (IPM).

Why the Bacillus-based Biofungicides Market is Growing?

The market’s expansion is being driven by the convergence of sustainability imperatives, regulatory pressures, and technological innovation. Growing restrictions on synthetic fungicides and rising consumer preference for residue-free produce are accelerating the shift toward bio-based crop protection. Bacillus strains, particularly B. amyloliquefaciens and B. subtilis, are favored due to their versatility across fruits, vegetables, cereals, and vines. Advances in formulation technologies, including suspension concentrates and micro-encapsulation, have improved field stability, shelf-life, and ease of application.

Biologicals are increasingly integrated into Integrated Pest Management (IPM) systems, enhancing compatibility with conventional products while reducing resistance risks. Strong adoption is also tied to the growth of organic farming, now supported by national policies in Asia-Pacific and Latin America. In addition, biocontrol companies and multinationals are expanding investments in strain development, novel delivery systems, and geographic reach, positioning Bacillus-based biofungicides as a central pillar of the next-generation crop protection market.

Segmental Analysis Overview

The Bacillus-based Biofungicides Market is segmented across species/strain group, formulation type, mode of action, application method, crop, production system, and region, each illustrating distinct adoption pathways and technological advancements. Strain-level differentiation highlights the dominance of B. amyloliquefaciens / B. velezensis and B. subtilis, both widely commercialized for broad-spectrum disease suppression.

Formulation analysis reveals wettable powders (WP/WG/WDG) as the most widely used format, though suspension concentrates and micro-encapsulation are rapidly reshaping the landscape through superior stability and field performance. By mode of action, antibiosis leads, but induced systemic resistance (ISR) is expanding fastest as growers emphasize plant immunity.

Application trends are led by foliar sprays, while soil drench, drip, and seed treatments record faster growth with protected cultivation. Fruits & vegetables remain the core crop segment, supported by regulatory restrictions on residues, whereas organic production systems are expanding rapidly at over 13% CAGR. Collectively, these segments underscore how strain innovation, formulation science, and diversified application methods are driving the structural evolution of the Bacillus-based biofungicides industry.
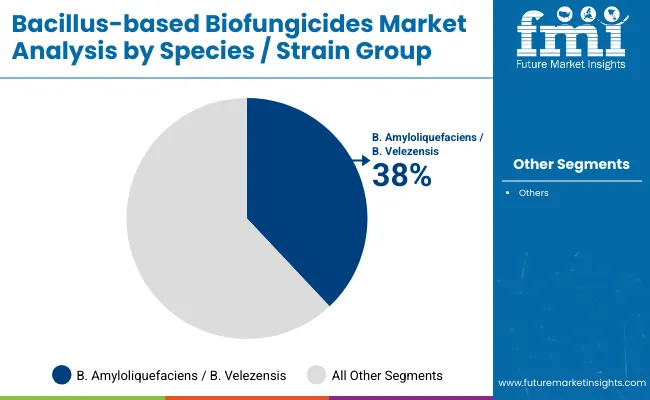
B. amyloliquefaciens / B. velezensis Anchor the Species Segment

Bacillus Based Biofungicides Market By Species Or Strain Group

Species/Strain Group Share (2025)
B.amyloliquefaciens/B.velezensis 38%
Others 62%

The species/strain group is dominated by B. amyloliquefaciens / B. velezensis, holding a 38% share in 2025. Their strong biocontrol efficacy is attributed to diverse lipopeptides and metabolites that provide reliable suppression of fungal pathogens across fruits, vegetables, and cereals. With a CAGR of 12.8%, these strains are anticipated to expand further due to their broad adoption in both conventional and organic systems. B. subtilis, at 32% share, remains highly relevant but grows at a slower rate compared to B. amyloliquefaciens.

Emerging strains such as B. pumilus and B. mycoides are gaining traction, particularly in resistance management and ISR activation, but collectively remain smaller contributors. The dominance of B. amyloliquefaciens / B. velezensis reflects scalability, versatility, and robust commercial validation across regions.
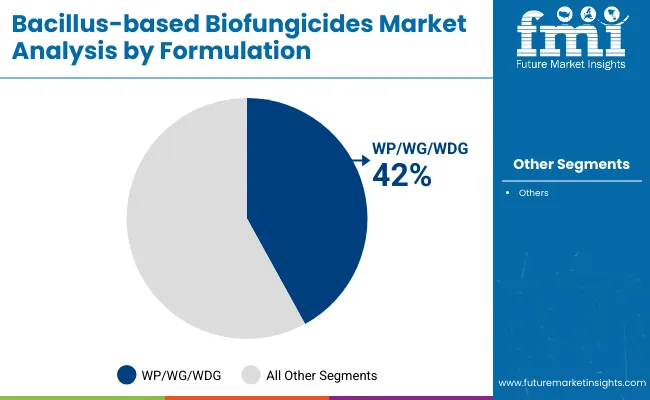
WP/WG/WDG Lead the Formulation Segment

Bacillus Based Biofungicides Market By Formulation

Formulation Share (2025)
WP/WG/WDG 42%
Others 58%

By formulation, WP/WG/WDG (wettable powders, granules, and dispersible granules) lead with a 42% share in 2025. These formats dominate due to ease of storage, cost-efficiency, and wide compatibility with existing spraying equipment in fruits, vegetables, and cereals. However, SC/SL formulations, holding 36% share, are forecast to expand faster at 12.4% CAGR, supported by superior stability, lower dust risk, and better adhesion to foliage.

Micro-encapsulated and novel formulations, although only 10% in 2025, are projected to grow fastest at 13.6% CAGR, reflecting innovation-led adoption. Granular and dry flowable formats retain utility in soil and seed applications but remain smaller niches. WP/WG/WDG’s dominance underlines their established role in conventional farming, though newer liquid and encapsulated formats are reshaping long-term growth.
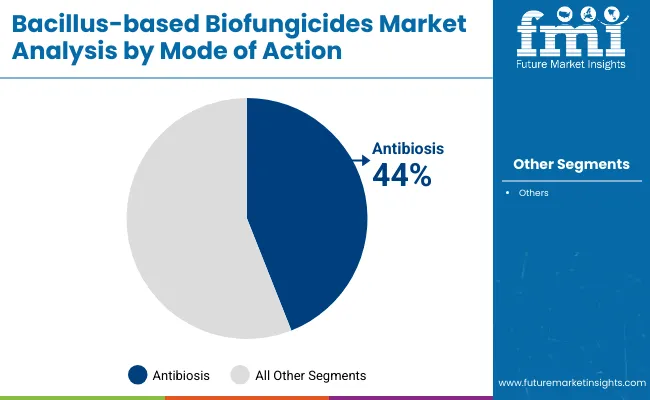
Antibiosis Leads the Mode of Action Segment

Bacillus Based Biofungicides Market By Mode Of Action

Mode of Action Share (2025)
Antibiosis ( lipopeptides , metabolites) 44%
Others 56%

The primary mode of action is antibiosis, accounting for 44% of global share in 2025. Lipopeptides, surfactins, and metabolites produced by Bacillus strains are critical in suppressing a broad spectrum of fungal pathogens. Competitive exclusion and biofilm colonization follow with 28% share, enabling effective root-zone protection and niche competition.

Induced systemic resistance (ISR), though smaller at 20%, is projected to grow fastest at a 12.9% CAGR, as interest in plant immunity activation increases. Other mechanisms remain niche but serve important supplementary roles in IPM. Antibiosis is set to remain the leading mechanism due to proven efficacy, but ISR is expected to reshape adoption patterns as advanced Bacillus strains and formulations increasingly target preventive plant health.
Foliar Spray Dominates Application Method Segment

Bacillus Based Biofungicides Market Application Method

Application Method Share (2025)
Foliar Spray 46%
Others 54%

By application method, foliar spray dominates with a 46% share in 2025. Ease of adoption, established grower familiarity, and effectiveness in controlling aerial pathogens explain its dominance. Soil drench and drip applications, representing 26%, are expanding quickly at 12.3% CAGR, especially in horticulture and greenhouse systems where root health and soil pathogens are key.

Seed treatment, at 20% share, is projected to grow at 12.8% CAGR, reflecting rising integration with crop-protection packages and increasing emphasis on early-stage disease resistance. Post-harvest treatments, though only 8% share, provide important opportunities in export chains where residue-free compliance is crucial. Foliar spraying will continue to anchor usage, but seed treatment and soil applications are gaining momentum as Bacillus biofungicides integrate deeper into IPM frameworks.
Fruits & Vegetables Dominate the Crop Segment

Bacillus Based Biofungicides Market By Crop

Crop Share (2025)
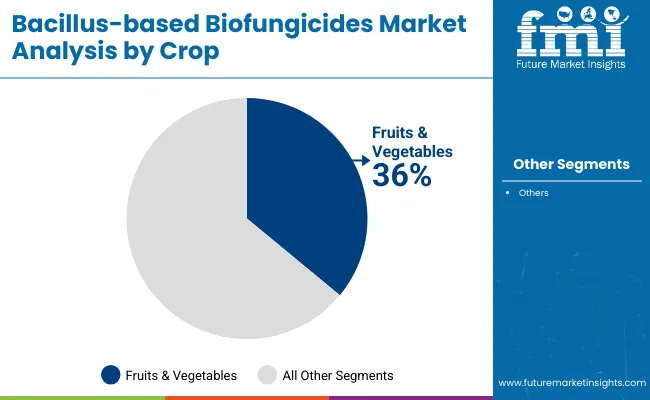
Fruits & Vegetables 36%
Others 64%

The crop segment is led by fruits & vegetables, holding a 36% share in 2025. This dominance reflects high disease pressure, economic returns, and regulatory restrictions on synthetic fungicides in perishable produce. Bacillus biofungicides are widely adopted in tomatoes, cucumbers, peppers, leafy greens, and berries, driven by demand for residue-free protection in fresh markets.

Cereals & grains (20%) and vines & berries (14%) follow, with steady adoption as product performance improves in broad-acre systems. Oilseeds & pulses (12%) and ornamentals & turf (10%) represent smaller but steady demand niches. Fruits & vegetables will remain the primary driver, but the combination of cereals and vines indicates diversification across broad-acre and specialty segments.
Conventional Systems Lead the Production Segment

Bacillus Based Biofungicides Market By Production System

Production System Share (2025)
Conventional / Integrated 58%
Others 42%

By production system, conventional/integrated farming dominates with a 58% share in 2025. Bacillus biofungicides are widely adopted as complements to chemical fungicides in IPM systems, where they reduce chemical loads and manage resistance. However, organic systems, representing 42%, are forecast to grow faster at 13.5% CAGR, reflecting strong consumer-driven demand and government support for organic acreage in Asia, Europe, and Latin America.

Bacillus biofungicides’ favorable residue and safety profile make them essential in organic production, with their market penetration supported by global certification alignment. Conventional systems will maintain leadership due to larger scale, but organic farming is expected to significantly outpace them in relative growth.
Analysis of Bacillus-based Biofungicides Market By Key Countries

Bacillus Based Biofungicides Market Key Countries

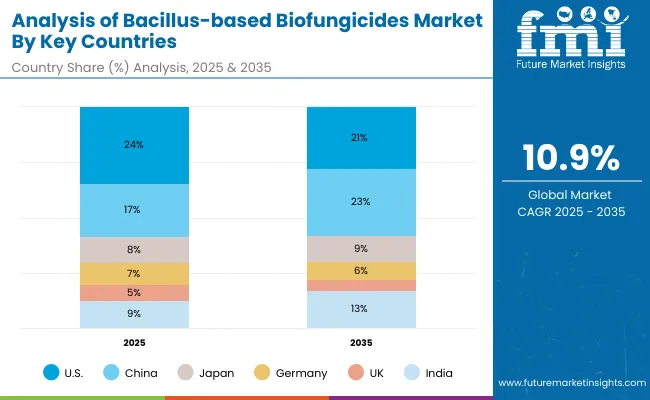
Country 2025 Share
USA 24%
China 17%
Japan 8%
Germany 7%
UK 5%
India 9%
Country 2035 Share
USA 21%
China 23%
Japan 9%
Germany 6%
UK 4%
India 13%

Adoption of Bacillus-based biofungicides is evolving at different paces across regions, shaped by regulatory frameworks, residue-free requirements, and the maturity of integrated pest management (IPM) systems. In Asia-Pacific, growth is most dynamic, with India (12.8% CAGR) and China (12.1% CAGR) driving expansion through strong policy support, rising organic acreage, and demand for residue-compliant exports.

North America, led by the United States, retains influence with a 9.4% CAGR, supported by IPM maturity, specialty crop dominance, and stewardship programs, although its global share is projected to decline as Asia scales faster. Europe reflects steady but compliance-driven growth, with Germany (7.2% CAGR), France (6.6%), and the UK (7.5%) prioritizing traceability, ISR adoption, and premium horticulture.

Latin America, led by Brazil (11.0% CAGR), shows strong momentum in soybeans, fruits, and vegetables, while Japan and South Korea highlight innovation-led adoption of high-purity strains and advanced formulations in protected horticulture. Together, these dynamics reflect a global shift where Asia-Pacific and Latin America increasingly drive market growth, while North America and Europe consolidate through premium, compliance-led demand.
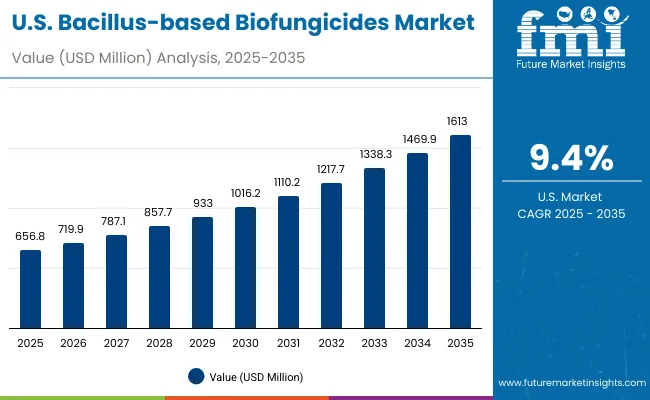
Sales Outlook for Bacillus-based Biofungicides in the United States

Bacillus Based Biofungicides Market Usa

Year USA Bacillus-based biofungicides Market (USD Million)
2025 656.8
2026 719.9
2027 787.1
2028 857.7
2029 933.0
2030 1,016.2
2031 1,110.2
2032 1,217.7
2033 1,338.3
2034 1,469.9
2035 1,613.0

Growth in the United States is projected at a 9.4% CAGR, with share easing from 24% in 2025 to 21% by 2035 as Asia expands faster. Adoption will remain anchored in fruits & vegetables, vines/berries, and conventional IPM programs where Bacillus products rotate with synthetics to manage resistance and residues.

WP/WG/WDG and SC/SL formats will dominate due to application familiarity and compatibility with existing rigs, while seed treatment and soil drench use cases gain share in protected cultivation. Retailer agronomy programs and biological specialists are expected to drive training, stewardship, and in-season recommendations. Rising organic acreage and export quality requirements will continue to reinforce demand for residue-compliant control, positioning Bacillus as a core pillar across specialty supply chains.

  • Specialty crops anchor premium demand.
  • Foliar spray remains the primary method.
  • Seed treatment expands with greenhouse systems.
  • IPM stewardship programs standardize use.

China: Policy support and protected cultivation accelerate scale and innovation

China is forecast to grow at 12.1% CAGR, with global share increasing from 17% (2025) to 23% (2035). Adoption is being propelled by residue restrictions, government support for biologicals, and rapid expansion in fruits & vegetables and greenhouse vegetables. B. amyloliquefaciens / B. velezensis and B. subtilis strains will dominate, with SC/SL and WP/WG formats scaling through distributors and co-ops.

ISR-oriented products are projected to rise as growers emphasize preventive plant health. Strong local manufacturing and technology transfer agreements are expected to broaden portfolios and improve price-performance across broad-acre cereals and specialty crops.

  • Market share rises to 23% by 2035.
  • Greenhouse vegetables drive volume.
  • ISR mechanisms gain strategic relevance.
  • Localized production strengthens access.

India: Fastest momentum supported by organic acreage and export chains

India is projected to post 12.8% CAGR, lifting share from 9% (2025) to 13% (2035). Growth is expected to be powered by fruits & vegetables, spices, and seed treatment in horticulture hubs, with rapid expansion in organic and residue-sensitive export value chains. WP/WG/WDG dominates early adoption for affordability and handling, while SC/SL ramps up in protected cultivation and drip systems.

ISR-based offerings are anticipated to scale for preventive programs against soil-borne and foliar pathogens. Co-ops, FPOs, and e-commerce platforms are expected to expand last-mile access and training, institutionalizing Bacillus within IPM.

  • Share climbs from 9% to 13% by 2035.
  • Organic systems expand fastest.
  • Seed treatment and drench gain traction.
  • Digital/retail networks widen reach.

Germany: Compliance-led adoption underpins steady premium positioning

Germany is expected to expand at 7.2% CAGR, with share moderating from 7% (2025) to 6% (2035) as Asia grows faster. Procurement remains compliance-led, emphasizing traceability, label integrity, and resistance management within IPM. Fruits & vegetables and vines/berries anchor demand, while cereals adoption develops in seed and soil programs.

SC/SL formats gain in high-value crops for better adhesion and coverage, and micro-encapsulated technologies are anticipated to build share as stability improves. Distributor agronomy and grower groups will continue to standardize best practices and efficacy trials.

  • Compliance and stewardship drive use.
  • Liquids grow in high-value crops.
  • Micro-encapsulation gains visibility.
  • IPM rotations reduce residues/resistance.

France: Residue-free positioning and ISR focus support resilient growth

France is forecast to grow at 6.6% CAGR. Adoption will remain focused on vegetables, vineyards, and berries, where residue-free requirements and export standards reinforce biological programs. ISR-oriented products are expected to gain relevance for preventive plant health, complementing antibiosis-led rotations. WP/WG remains mainstream for cost and handling; SC/SL formats scale in vineyards for coverage and rainfastness benefits. Co-ops and technical institutes will continue to drive trials and label stewardship.

  • ISR grows as preventive strategy.
  • Vineyards expand liquid usage.
  • Co-ops shape training and protocols.
  • Residue-free positioning drives demand.

United Kingdom: Protected horticulture and stewardship programs shape demand

The UK is projected to grow at 7.5% CAGR, with share easing from 5% (2025) to 4% (2035). Demand will concentrate in protected vegetables, soft fruits, ornamentals, and turf, where SC/SL and WP/WG formats fit established equipment and protocols. Retail stewardship and efficacy verification will remain central, while micro-encapsulated products gain interest for stability. Integration with seed treatment and soil applications is anticipated to expand in greenhouse systems.
  • Protected crops anchor adoption.
  • Liquids and WPs/WGs remain core.
  • Stewardship/verification drive trust.
  • Seed/soil integrations scale in greenhouses.

Japan: Premium specialty crops and liquids sustain innovation-led growth

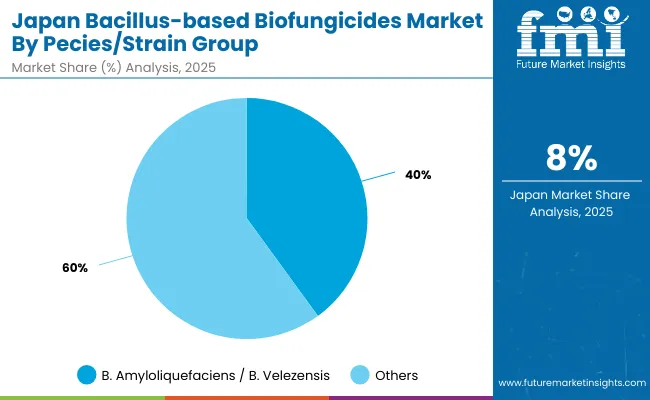
Bacillus Based Biofungicides Market Japan

Pecies /Strain Group Market Share (%)
B. amyloliquefaciens / B. velezensis 40%
Others 60%

Japan’s share is expected to edge up from 8% (2025) to 9% (2035), supported by premium horticulture, berries, and ornamentals. Adoption will remain innovation-led with a preference for high-purity strains and SC/SL for precision coverage. B. amyloliquefaciens / B. velezensis and B. subtilis dominate, while micro-encapsulated technologies gain interest for shelf-life and stability in complex programs. IPM rotations and residue-free positioning are expected to remain central in export chains.
  • Share nudges up to 9% by 2035.
  • High-purity strains favored in premium crops.
  • Liquids support precision application.
  • IPM delivers residue compliance.

South Korea: Greenhouse systems and liquids support steady scaling

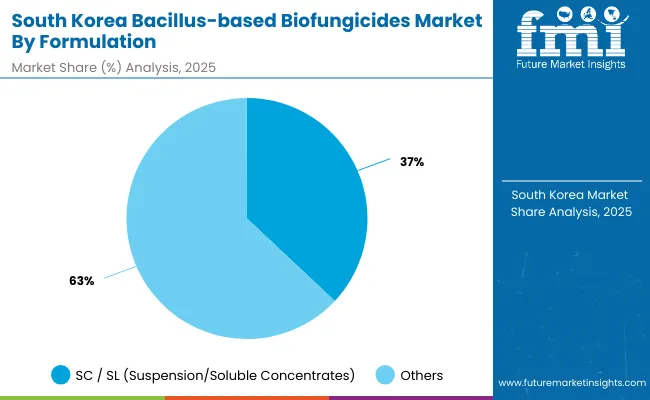
South Korea Bacillus Based Biofungicides Market By Formulation

Formulation 2025 Share
SC / SL (suspension/soluble concentrates) 37%
Others 63%

Growth in South Korea is expected to be centered on greenhouse vegetables, berries, and ornamentals, where SC/SL formulations provide strong usability and coverage. WP/WG remains relevant in broader programs, while micro-encapsulated formats expand with premium crops seeking better stability and shelf-life. Distributor agronomy and municipal greenhouse initiatives will continue to guide standardized protocols. Wider use in seed and soil programs is anticipated as ISR-focused labels increase.
  • Liquids dominate at point of use.
  • Micro-encapsulation gains traction.
  • Greenhouse programs anchor demand.
  • Distributor agronomy drives stewardship.

Competitive Landscape of Bacillus-based Biofungicides Market

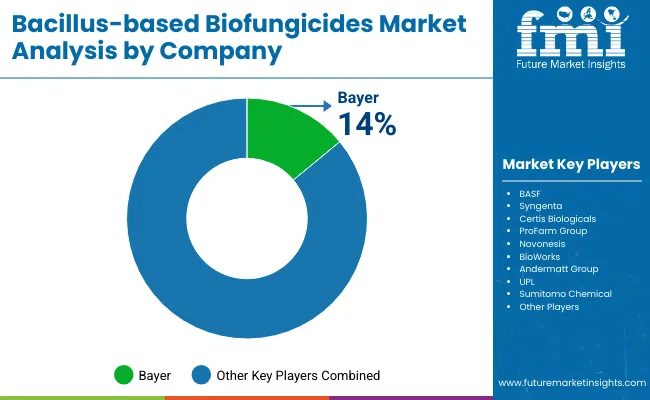
Bacillus Based Biofungicides Market By Company

A leadership cluster of global crop-protection companies and specialized biological firms has been observed. Bayer is assessed to hold the largest value share in 2025 (≈14%), supported by a broad portfolio of B. amyloliquefaciens / B. velezensis and B. subtilis products across WP/WG/WDG and SC/SL formats and deep IPM channel penetration in North America and Europe. BASF and Syngenta scale through integrated programs and distribution depth, while Certis Biologicals and ProFarm Group maintain strong positions in specialty crops and organic chains.

Novonesis (resulting from the enzymes/microbes combination) strengthens the strain-development and fermentation backbone that supports next-gen formulations, including micro-encapsulated offerings. Regional specialists-BioWorks, Andermatt Group, UPL, Sumitomo Chemical-provide localized portfolios, greenhouse expertise, and co-development with distributor agronomy teams. Competitive edge is shifting toward formulation science (SC/SL, encapsulation), ISR claims, residue-management positioning, and data-backed IPM integration. Supply reliability, cold-chain stewardship, and label expansions in seed/soil/post-harvest uses are expected to define outperformance through 2035.

Key Developments in Bacillus-based Biofungicides Market

  • March 2025 -Bayer introduces ISR-enhanced suspension concentrate for berries and vinesA new SC formulation combining B. amyloliquefaciens metabolites with improved adhesion was launched across selected markets. The label targets powdery mildew and Botrytis, enabling preventive ISR positioning in premium export chains.
  • February 2025 - Novonesis expands Bacillus fermentation capacity in APACAdditional stainless-steel lines and downstream drying were commissioned to support WP/WG/WDG and micro-encapsulated formats. The investment is designed to shorten lead times for Asian horticulture hubs and accelerate localized product customization.

Scope of the Report

Item Details
Market Size, 2025 USD 2,736.8 Million
Market Size, 2035 USD 7,733.2 Million
Absolute Growth (2025-2035) USD 4,996.4 Million
CAGR (2025 to 2035) 10.90%
Value Added 2025 to 2030 ~USD 1.80 Billion
Value Added 2030 to 2035 ~USD 3.20 Billion
Species/Strain (2025) B. amyloliquefaciens / B. velezensis leads (38% share)
Formulation (2025) WP/WG/WDG leads (42% share)
Mode of Action (2025) Antibiosis leads (44% share)
Application Method (2025) Foliar spray leads (46% share)
Crop (2025) Fruits & vegetables lead (36% share)
Production System (2025) Conventional/Integrated leads (58% share)
Key Growth Regions (CAGR) South Asia & Pacific 13.2% , East Asia 12.8% , Latin America 11.6%
Regions Covered North America, Europe, East Asia, South Asia & Pacific, Latin America, Middle East & Africa
Countries Covered USA, China, India, Japan, South Korea, Germany, France, UK, Brazil
Key Companies Profiled Bayer, BASF, Syngenta, Certis Biologicals, ProFarm Group, Novonesis , BioWorks , Andermatt Group, UPL, Sumitomo Chemical
Additional Attributes IPM integration, ISR claims, residue-management positioning, micro-encapsulation, cold-chain and storage stability, seed/soil/foliar versatility

Key Segments

By Species/Strain Group:

  • B. amyloliquefaciens / B. velezensis
  • B. subtilis
  • B. pumilus
  • B. mycoides
  • Others

By Formulation:

  • WP/WG/WDG
  • SC/SL (suspension/soluble concentrates)
  • GR/DF (granular/dry flowable)
  • Micro-encapsulated/novel

By Mode of Action:

  • Antibiosis (lipopeptides, metabolites)
  • Competitive exclusion/biofilm colonization
  • Induced systemic resistance (ISR)
  • Other mechanisms

By Application Method:

  • Foliar spray
  • Soil drench/drip
  • Seed treatment
  • Post-harvest

By Crop:

  • Fruits & vegetables
  • Cereals & grains
  • Vines & berries
  • Oilseeds & pulses
  • Ornamentals & turf
  • Others

By Production System:

  • Conventional/Integrated
  • Organic

By Region:

  • North America
  • Latin America
  • Europe
  • East Asia
  • South Asia & Pacific
  • Middle East and Africa

Table of Content

  1. Executive Summary
    • Global Market Outlook
    • Demand-side Trends
    • Supply-side Trends
    • Technology Roadmap Analysis
    • Analysis and Recommendations
  2. Market Overview
    • Market Coverage / Taxonomy
    • Market Definition / Scope / Limitations
  3. Market Background
    • Market Dynamics
      • Drivers
      • Restraints
      • Opportunity
      • Trends
    • Scenario Forecast
      • Demand in Optimistic Scenario
      • Demand in Likely Scenario
      • Demand in Conservative Scenario
    • Opportunity Map Analysis
    • Product Life Cycle Analysis
    • Supply Chain Analysis
    • Investment Feasibility Matrix
    • Value Chain Analysis
    • PESTLE and Porter’s Analysis
    • Regulatory Landscape
    • Regional Parent Market Outlook
    • Production and Consumption Statistics
    • Import and Export Statistics
  4. Global Analysis 2020 to 2024 and Forecast, 2025 to 2035
    • Historical Market Size Value (USD Million) & Volume (MT) Analysis, 2020 to 2024
    • Current and Future Market Size Value (USD Million) & Volume (MT) Projections, 2025 to 2035
      • Y-o-Y Growth Trend Analysis
      • Absolute $ Opportunity Analysis
  5. Global Pricing Analysis 2020 to 2024 and Forecast 2025 to 2035
  6. Global Analysis 2020 to 2024 and Forecast 2025 to 2035, By Species/Strain Group
    • Introduction / Key Findings
    • Historical Market Size Value (USD Million) & Volume (MT) Analysis By Species/Strain Group, 2020 to 2024
    • Current and Future Market Size Value (USD Million) & Volume (MT) Analysis and Forecast By Species/Strain Group, 2025 to 2035
      • B. amyloliquefaciens / B. velezensis
      • B. subtilis
      • B. pumilus
      • B. mycoides
      • Others
    • Y-o-Y Growth Trend Analysis By Species/Strain Group, 2020 to 2024
    • Absolute $ Opportunity Analysis By Species/Strain Group, 2025 to 2035
  7. Global Analysis 2020 to 2024 and Forecast 2025 to 2035, By Formulation
    • Introduction / Key Findings
    • Historical Market Size Value (USD Million) & Volume (MT) Analysis By Formulation, 2020 to 2024
    • Current and Future Market Size Value (USD Million) & Volume (MT) Analysis and Forecast By Formulation, 2025 to 2035
      • WP/WG/WDG
      • SC/SL (suspension/soluble concentrates)
      • GR/DF (granular/dry flowable)
      • Micro-encapsulated/novel
    • Y-o-Y Growth Trend Analysis By Formulation, 2020 to 2024
    • Absolute $ Opportunity Analysis By Formulation, 2025 to 2035
  8. Global Analysis 2020 to 2024 and Forecast 2025 to 2035, By Mode of Action
    • Introduction / Key Findings
    • Historical Market Size Value (USD Million) & Volume (MT) Analysis By Mode of Action, 2020 to 2024
    • Current and Future Market Size Value (USD Million) & Volume (MT) Analysis and Forecast By Mode of Action, 2025 to 2035
      • Antibiosis (lipopeptides, metabolites)
      • Competitive exclusion/biofilm colonization
      • Induced systemic resistance (ISR)
      • Other mechanisms
    • Y-o-Y Growth Trend Analysis By Mode of Action, 2020 to 2024
    • Absolute $ Opportunity Analysis By Mode of Action, 2025 to 2035
  9. Global Analysis 2020 to 2024 and Forecast 2025 to 2035, By Application Method
    • Introduction / Key Findings
    • Historical Market Size Value (USD Million) & Volume (MT) Analysis By Application Method, 2020 to 2024
    • Current and Future Market Size Value (USD Million) & Volume (MT) Analysis and Forecast By Application Method, 2025 to 2035
      • Foliar spray
      • Soil drench/drip
      • Seed treatment
      • Post-harvest
    • Y-o-Y Growth Trend Analysis By Application Method, 2020 to 2024
    • Absolute $ Opportunity Analysis By Application Method, 2025 to 2035
  10. Global Analysis 2020 to 2024 and Forecast 2025 to 2035, By Crop
    • Introduction / Key Findings
    • Historical Market Size Value (USD Million) & Volume (MT) Analysis By Crop, 2020 to 2024
    • Current and Future Market Size Value (USD Million) & Volume (MT) Analysis and Forecast By Crop, 2025 to 2035
      • Fruits & vegetables
      • Cereals & grains
      • Vines & berries
      • Oilseeds & pulses
      • Ornamentals & turf
      • Others
    • Y-o-Y Growth Trend Analysis By Crop, 2020 to 2024
    • Absolute $ Opportunity Analysis By Crop, 2025 to 2035
  11. Global Analysis 2020 to 2024 and Forecast 2025 to 2035, By Production System
    • Introduction / Key Findings
    • Historical Market Size Value (USD Million) & Volume (MT) Analysis By Production System, 2020 to 2024
    • Current and Future Market Size Value (USD Million) & Volume (MT) Analysis and Forecast By Production System, 2025 to 2035
      • Conventional/Integrated
      • Organic
    • Y-o-Y Growth Trend Analysis By Production System, 2020 to 2024
    • Absolute $ Opportunity Analysis By Production System, 2025 to 2035
  12. Global Analysis 2020 to 2024 and Forecast 2025 to 2035, By Region
    • Introduction
    • Historical Market Size Value (USD Million) & Volume (MT) Analysis By Region, 2020 to 2024
    • Current Market Size Value (USD Million) & Volume (MT) Analysis and Forecast By Region, 2025 to 2035
      • North America
      • Latin America
      • Europe
      • East Asia
      • South Asia & Pacific
      • Middle East and Africa
    • Market Attractiveness Analysis By Region
  13. North America Analysis 2020 to 2024 and Forecast 2025 to 2035, By Country
    • Historical Market Size Value (USD Million) & Volume (MT) Trend Analysis By Market Taxonomy, 2020 to 2024
    • Market Size Value (USD Million) & Volume (MT) Forecast By Market Taxonomy, 2025 to 2035
      • By Country
        • USA
        • Canada
      • By Species/Strain Group
      • By Formulation
      • By Mode of Action
      • By Application Method
      • By Crop
      • By Production System
    • Market Attractiveness Analysis
      • By Country
      • By Species/Strain Group
      • By Formulation
      • By Mode of Action
      • By Application Method
      • By Crop
      • By Production System
    • Key Takeaways
  14. Latin America Analysis 2020 to 2024 and Forecast 2025 to 2035, By Country
    • Historical Market Size Value (USD Million) & Volume (MT) Trend Analysis By Market Taxonomy, 2020 to 2024
    • Market Size Value (USD Million) & Volume (MT) Forecast By Market Taxonomy, 2025 to 2035
      • By Country
        • Brazil
        • Mexico
        • Colombia
        • Rest of Latin America
      • By Species/Strain Group
      • By Formulation
      • By Mode of Action
      • By Application Method
      • By Crop
      • By Production System
    • Market Attractiveness Analysis
      • By Country
      • By Species/Strain Group
      • By Formulation
      • By Mode of Action
      • By Application Method
      • By Crop
      • By Production System
    • Key Takeaways
  15. Europe Analysis 2020 to 2024 and Forecast 2025 to 2035, By Country
    • Historical Market Size Value (USD Million) & Volume (MT) Trend Analysis By Market Taxonomy, 2020 to 2024
    • Market Size Value (USD Million) & Volume (MT) Forecast By Market Taxonomy, 2025 to 2035
      • By Country
        • Germany
        • UK
        • France
        • Italy
        • Spain
        • Belgium
        • Netherlands
        • Nordic
        • Switzerland
        • Russia
        • Poland
        • Rest of Europe
      • By Species/Strain Group
      • By Formulation
      • By Mode of Action
      • By Application Method
      • By Crop
      • By Production System
    • Market Attractiveness Analysis
      • By Country
      • By Species/Strain Group
      • By Formulation
      • By Mode of Action
      • By Application Method
      • By Crop
      • By Production System
    • Key Takeaways
  16. East Asia Analysis 2020 to 2024 and Forecast 2025 to 2035, By Country
    • Historical Market Size Value (USD Million) & Volume (MT) Trend Analysis By Market Taxonomy, 2020 to 2024
    • Market Size Value (USD Million) & Volume (MT) Forecast By Market Taxonomy, 2025 to 2035
      • By Country
        • China
        • Japan
        • South Korea
      • By Species/Strain Group
      • By Formulation
      • By Mode of Action
      • By Application Method
      • By Crop
      • By Production System
    • Market Attractiveness Analysis
      • By Country
      • By Species/Strain Group
      • By Formulation
      • By Mode of Action
      • By Application Method
      • By Crop
      • By Production System
    • Key Takeaways
  17. South Asia & Pacific Analysis 2020 to 2024 and Forecast 2025 to 2035, By Country
    • Historical Market Size Value (USD Million) & Volume (MT) Trend Analysis By Market Taxonomy, 2020 to 2024
    • Market Size Value (USD Million) & Volume (MT) Forecast By Market Taxonomy, 2025 to 2035
      • By Country
        • India
        • Thailand
        • Malaysia
        • Indonesia
        • Singapore
        • Vietnam
        • Australia
        • New Zealand
        • Rest of South Asia
      • By Species/Strain Group
      • By Formulation
      • By Mode of Action
      • By Application Method
      • By Crop
      • By Production System
    • Market Attractiveness Analysis
      • By Country
      • By Species/Strain Group
      • By Formulation
      • By Mode of Action
      • By Application Method
      • By Crop
      • By Production System
    • Key Takeaways
  18. Middle East and Africa Analysis 2020 to 2024 and Forecast 2025 to 2035, By Country
    • Historical Market Size Value (USD Million) & Volume (MT) Trend Analysis By Market Taxonomy, 2020 to 2024
    • Market Size Value (USD Million) & Volume (MT) Forecast By Market Taxonomy, 2025 to 2035
      • By Country
        • Turkey
        • UAE
        • Saudi Arabia
        • Israel
        • Other GCC Countries
        • North Africa
        • South Africa
      • By Species/Strain Group
      • By Formulation
      • By Mode of Action
      • By Application Method
      • By Crop
      • By Production System
    • Market Attractiveness Analysis
      • By Country
      • By Species/Strain Group
      • By Formulation
      • By Mode of Action
      • By Application Method
      • By Crop
      • By Production System
    • Key Takeaways
  19. Key Countries Analysis
    • USA
      • Pricing Analysis
      • Market Share Analysis, 2024
        • By Species/Strain Group
        • By Formulation
        • By Mode of Action
        • By Application Method
        • By Crop
        • By Production System
    • Canada
      • Pricing Analysis
      • Market Share Analysis, 2024
        • By Species/Strain Group
        • By Formulation
        • By Mode of Action
        • By Application Method
        • By Crop
        • By Production System
    • Mexico
      • Pricing Analysis
      • Market Share Analysis, 2024
        • By Species/Strain Group
        • By Formulation
        • By Mode of Action
        • By Application Method
        • By Crop
        • By Production System
    • Brazil
      • Pricing Analysis
      • Market Share Analysis, 2024
        • By Species/Strain Group
        • By Formulation
        • By Mode of Action
        • By Application Method
        • By Crop
        • By Production System
    • Germany
      • Pricing Analysis
      • Market Share Analysis, 2024
        • By Species/Strain Group
        • By Formulation
        • By Mode of Action
        • By Application Method
        • By Crop
        • By Production System
    • UK
      • Pricing Analysis
      • Market Share Analysis, 2024
        • By Species/Strain Group
        • By Formulation
        • By Mode of Action
        • By Application Method
        • By Crop
        • By Production System
    • Italy
      • Pricing Analysis
      • Market Share Analysis, 2024
        • By Species/Strain Group
        • By Formulation
        • By Mode of Action
        • By Application Method
        • By Crop
        • By Production System
    • Spain
      • Pricing Analysis
      • Market Share Analysis, 2024
        • By Species/Strain Group
        • By Formulation
        • By Mode of Action
        • By Application Method
        • By Crop
        • By Production System
    • France
      • Pricing Analysis
      • Market Share Analysis, 2024
        • By Species/Strain Group
        • By Formulation
        • By Mode of Action
        • By Application Method
        • By Crop
        • By Production System
    • India
      • Pricing Analysis
      • Market Share Analysis, 2024
        • By Species/Strain Group
        • By Formulation
        • By Mode of Action
        • By Application Method
        • By Crop
        • By Production System
    • Australia & New Zealand
      • Pricing Analysis
      • Market Share Analysis, 2024
        • By Species/Strain Group
        • By Formulation
        • By Mode of Action
        • By Application Method
        • By Crop
        • By Production System
    • China
      • Pricing Analysis
      • Market Share Analysis, 2024
        • By Species/Strain Group
        • By Formulation
        • By Mode of Action
        • By Application Method
        • By Crop
        • By Production System
    • Japan
      • Pricing Analysis
      • Market Share Analysis, 2024
        • By Species/Strain Group
        • By Formulation
        • By Mode of Action
        • By Application Method
        • By Crop
        • By Production System
    • South Korea
      • Pricing Analysis
      • Market Share Analysis, 2024
        • By Species/Strain Group
        • By Formulation
        • By Mode of Action
        • By Application Method
        • By Crop
        • By Production System
    • Russia
      • Pricing Analysis
      • Market Share Analysis, 2024
        • By Species/Strain Group
        • By Formulation
        • By Mode of Action
        • By Application Method
        • By Crop
        • By Production System
    • Poland
      • Pricing Analysis
      • Market Share Analysis, 2024
        • By Species/Strain Group
        • By Formulation
        • By Mode of Action
        • By Application Method
        • By Crop
        • By Production System
    • Hungary
      • Pricing Analysis
      • Market Share Analysis, 2024
        • By Species/Strain Group
        • By Formulation
        • By Mode of Action
        • By Application Method
        • By Crop
        • By Production System
    • Kingdom of Saudi Arabia
      • Pricing Analysis
      • Market Share Analysis, 2024
        • By Species/Strain Group
        • By Formulation
        • By Mode of Action
        • By Application Method
        • By Crop
        • By Production System
    • Turkiye
      • Pricing Analysis
      • Market Share Analysis, 2024
        • By Species/Strain Group
        • By Formulation
        • By Mode of Action
        • By Application Method
        • By Crop
        • By Production System
    • South Africa
      • Pricing Analysis
      • Market Share Analysis, 2024
        • By Species/Strain Group
        • By Formulation
        • By Mode of Action
        • By Application Method
        • By Crop
        • By Production System
  20. Market Structure Analysis
    • Competition Dashboard
    • Competition Benchmarking
    • Market Share Analysis of Top Players
      • By Regional
      • By Species/Strain Group
      • By Formulation
      • By Mode of Action
      • By Application Method
      • By Crop
      • By Production System
  21. Competition Analysis
    • Competition Deep Dive
      • Bayer
        • Overview
        • Product Portfolio
        • Profitability by Market Segments (Product/Age /Sales Channel/Region)
        • Sales Footprint
        • Strategy Overview
        • BASF
        • Syngenta
        • Certis Biologicals
        • ProFarm Group
        • Novonesis
        • BioWorks
        • Andermatt Group
        • UPL
        • Sumitomo Chemical
  22. Assumptions & Acronyms Used
  23. Research Methodology

List of Tables

  • Table 1: Global Value (USD Million) Forecast by Region, 2020-2035
  • Table 2: Global Volume (MT) Forecast by Region, 2020-2035
  • Table 3: Global Value (USD Million) Forecast by Species/Strain Group, 2020-2035
  • Table 4: Global Volume (MT) Forecast by Species/Strain Group, 2020-2035
  • Table 5: Global Value (USD Million) Forecast by Formulation, 2020-2035
  • Table 6: Global Volume (MT) Forecast by Formulation, 2020-2035
  • Table 7: Global Value (USD Million) Forecast by Mode of Action, 2020-2035
  • Table 8: Global Volume (MT) Forecast by Mode of Action, 2020-2035
  • Table 9: Global Value (USD Million) Forecast by Application Method, 2020-2035
  • Table 10: Global Volume (MT) Forecast by Application Method, 2020-2035
  • Table 11: Global Value (USD Million) Forecast by Crop, 2020-2035
  • Table 12: Global Volume (MT) Forecast by Crop, 2020-2035
  • Table 13: Global Value (USD Million) Forecast by Production System, 2020-2035
  • Table 14: Global Volume (MT) Forecast by Production System, 2020-2035
  • Table 15: North America Value (USD Million) Forecast by Country, 2020-2035
  • Table 16: North America Volume (MT) Forecast by Country, 2020-2035
  • Table 17: North America Value (USD Million) Forecast by Species/Strain Group, 2020-2035
  • Table 18: North America Volume (MT) Forecast by Species/Strain Group, 2020-2035
  • Table 19: North America Value (USD Million) Forecast by Formulation, 2020-2035
  • Table 20: North America Volume (MT) Forecast by Formulation, 2020-2035
  • Table 21: North America Value (USD Million) Forecast by Mode of Action, 2020-2035
  • Table 22: North America Volume (MT) Forecast by Mode of Action, 2020-2035
  • Table 23: North America Value (USD Million) Forecast by Application Method, 2020-2035
  • Table 24: North America Volume (MT) Forecast by Application Method, 2020-2035
  • Table 25: North America Value (USD Million) Forecast by Crop, 2020-2035
  • Table 26: North America Volume (MT) Forecast by Crop, 2020-2035
  • Table 27: North America Value (USD Million) Forecast by Production System, 2020-2035
  • Table 28: North America Volume (MT) Forecast by Production System, 2020-2035
  • Table 29: Latin America Value (USD Million) Forecast by Country, 2020-2035
  • Table 30: Latin America Volume (MT) Forecast by Country, 2020-2035
  • Table 31: Latin America Value (USD Million) Forecast by Species/Strain Group, 2020-2035
  • Table 32: Latin America Volume (MT) Forecast by Species/Strain Group, 2020-2035
  • Table 33: Latin America Value (USD Million) Forecast by Formulation, 2020-2035
  • Table 34: Latin America Volume (MT) Forecast by Formulation, 2020-2035
  • Table 35: Latin America Value (USD Million) Forecast by Mode of Action, 2020-2035
  • Table 36: Latin America Volume (MT) Forecast by Mode of Action, 2020-2035
  • Table 37: Latin America Value (USD Million) Forecast by Application Method, 2020-2035
  • Table 38: Latin America Volume (MT) Forecast by Application Method, 2020-2035
  • Table 39: Latin America Value (USD Million) Forecast by Crop, 2020-2035
  • Table 40: Latin America Volume (MT) Forecast by Crop, 2020-2035
  • Table 41: Latin America Value (USD Million) Forecast by Production System, 2020-2035
  • Table 42: Latin America Volume (MT) Forecast by Production System, 2020-2035
  • Table 43: Europe Value (USD Million) Forecast by Country, 2020-2035
  • Table 44: Europe Volume (MT) Forecast by Country, 2020-2035
  • Table 45: Europe Value (USD Million) Forecast by Species/Strain Group, 2020-2035
  • Table 46: Europe Volume (MT) Forecast by Species/Strain Group, 2020-2035
  • Table 47: Europe Value (USD Million) Forecast by Formulation, 2020-2035
  • Table 48: Europe Volume (MT) Forecast by Formulation, 2020-2035
  • Table 49: Europe Value (USD Million) Forecast by Mode of Action, 2020-2035
  • Table 50: Europe Volume (MT) Forecast by Mode of Action, 2020-2035
  • Table 51: Europe Value (USD Million) Forecast by Application Method, 2020-2035
  • Table 52: Europe Volume (MT) Forecast by Application Method, 2020-2035
  • Table 53: Europe Value (USD Million) Forecast by Crop, 2020-2035
  • Table 54: Europe Volume (MT) Forecast by Crop, 2020-2035
  • Table 55: Europe Value (USD Million) Forecast by Production System, 2020-2035
  • Table 56: Europe Volume (MT) Forecast by Production System, 2020-2035
  • Table 57: East Asia Value (USD Million) Forecast by Country, 2020-2035
  • Table 58: East Asia Volume (MT) Forecast by Country, 2020-2035
  • Table 59: East Asia Value (USD Million) Forecast by Species/Strain Group, 2020-2035
  • Table 60: East Asia Volume (MT) Forecast by Species/Strain Group, 2020-2035
  • Table 61: East Asia Value (USD Million) Forecast by Formulation, 2020-2035
  • Table 62: East Asia Volume (MT) Forecast by Formulation, 2020-2035
  • Table 63: East Asia Value (USD Million) Forecast by Mode of Action, 2020-2035
  • Table 64: East Asia Volume (MT) Forecast by Mode of Action, 2020-2035
  • Table 65: East Asia Value (USD Million) Forecast by Application Method, 2020-2035
  • Table 66: East Asia Volume (MT) Forecast by Application Method, 2020-2035
  • Table 67: East Asia Value (USD Million) Forecast by Crop, 2020-2035
  • Table 68: East Asia Volume (MT) Forecast by Crop, 2020-2035
  • Table 69: East Asia Value (USD Million) Forecast by Production System, 2020-2035
  • Table 70: East Asia Volume (MT) Forecast by Production System, 2020-2035
  • Table 71: South Asia & Pacific Value (USD Million) Forecast by Country, 2020-2035
  • Table 72: South Asia & Pacific Volume (MT) Forecast by Country, 2020-2035
  • Table 73: South Asia & Pacific Value (USD Million) Forecast by Species/Strain Group, 2020-2035
  • Table 74: South Asia & Pacific Volume (MT) Forecast by Species/Strain Group, 2020-2035
  • Table 75: South Asia & Pacific Value (USD Million) Forecast by Formulation, 2020-2035
  • Table 76: South Asia & Pacific Volume (MT) Forecast by Formulation, 2020-2035
  • Table 77: South Asia & Pacific Value (USD Million) Forecast by Mode of Action, 2020-2035
  • Table 78: South Asia & Pacific Volume (MT) Forecast by Mode of Action, 2020-2035
  • Table 79: South Asia & Pacific Value (USD Million) Forecast by Application Method, 2020-2035
  • Table 80: South Asia & Pacific Volume (MT) Forecast by Application Method, 2020-2035
  • Table 81: South Asia & Pacific Value (USD Million) Forecast by Crop, 2020-2035
  • Table 82: South Asia & Pacific Volume (MT) Forecast by Crop, 2020-2035
  • Table 83: South Asia & Pacific Value (USD Million) Forecast by Production System, 2020-2035
  • Table 84: South Asia & Pacific Volume (MT) Forecast by Production System, 2020-2035
  • Table 85: Middle East and Africa Value (USD Million) Forecast by Country, 2020-2035
  • Table 86: Middle East and Africa Volume (MT) Forecast by Country, 2020-2035
  • Table 87: Middle East and Africa Value (USD Million) Forecast by Species/Strain Group, 2020-2035
  • Table 88: Middle East and Africa Volume (MT) Forecast by Species/Strain Group, 2020-2035
  • Table 89: Middle East and Africa Value (USD Million) Forecast by Formulation, 2020-2035
  • Table 90: Middle East and Africa Volume (MT) Forecast by Formulation, 2020-2035
  • Table 91: Middle East and Africa Value (USD Million) Forecast by Mode of Action, 2020-2035
  • Table 92: Middle East and Africa Volume (MT) Forecast by Mode of Action, 2020-2035
  • Table 93: Middle East and Africa Value (USD Million) Forecast by Application Method, 2020-2035
  • Table 94: Middle East and Africa Volume (MT) Forecast by Application Method, 2020-2035
  • Table 95: Middle East and Africa Value (USD Million) Forecast by Crop, 2020-2035
  • Table 96: Middle East and Africa Volume (MT) Forecast by Crop, 2020-2035
  • Table 97: Middle East and Africa Value (USD Million) Forecast by Production System, 2020-2035
  • Table 98: Middle East and Africa Volume (MT) Forecast by Production System, 2020-2035

List of Figures

  • Figure 1: Global Volume (MT) Forecast 2020-2035
  • Figure 2: Global Pricing Analysis
  • Figure 3: Global Value (USD Million) Forecast 2020-2035
  • Figure 4: Global Value Share and BPS Analysis by Species/Strain Group, 2025 and 2035
  • Figure 5: Global Y-o-Y Growth Comparison by Species/Strain Group, 2025-2035
  • Figure 6: Global Attractiveness Analysis by Species/Strain Group
  • Figure 7: Global Value Share and BPS Analysis by Formulation, 2025 and 2035
  • Figure 8: Global Y-o-Y Growth Comparison by Formulation, 2025-2035
  • Figure 9: Global Attractiveness Analysis by Formulation
  • Figure 10: Global Value Share and BPS Analysis by Mode of Action, 2025 and 2035
  • Figure 11: Global Y-o-Y Growth Comparison by Mode of Action, 2025-2035
  • Figure 12: Global Attractiveness Analysis by Mode of Action
  • Figure 13: Global Value Share and BPS Analysis by Application Method, 2025 and 2035
  • Figure 14: Global Y-o-Y Growth Comparison by Application Method, 2025-2035
  • Figure 15: Global Attractiveness Analysis by Application Method
  • Figure 16: Global Value Share and BPS Analysis by Crop, 2025 and 2035
  • Figure 17: Global Y-o-Y Growth Comparison by Crop, 2025-2035
  • Figure 18: Global Attractiveness Analysis by Crop
  • Figure 19: Global Value Share and BPS Analysis by Production System, 2025 and 2035
  • Figure 20: Global Y-o-Y Growth Comparison by Production System, 2025-2035
  • Figure 21: Global Attractiveness Analysis by Production System
  • Figure 22: Global Value (USD Million) Share and BPS Analysis by Region, 2025 and 2035
  • Figure 23: Global Y-o-Y Growth Comparison by Region, 2025-2035
  • Figure 24: Global Attractiveness Analysis by Region
  • Figure 25: North America Incremental $ Opportunity, 2025-2035
  • Figure 26: Latin America Incremental $ Opportunity, 2025-2035
  • Figure 27: Europe Incremental $ Opportunity, 2025-2035
  • Figure 28: East Asia Incremental $ Opportunity, 2025-2035
  • Figure 29: South Asia & Pacific Incremental $ Opportunity, 2025-2035
  • Figure 30: Middle East and Africa Incremental $ Opportunity, 2025-2035
  • Figure 31: North America Value Share and BPS Analysis by Country, 2025 and 2035
  • Figure 32: North America Value Share and BPS Analysis by Species/Strain Group, 2025 and 2035
  • Figure 33: North America Y-o-Y Growth Comparison by Species/Strain Group, 2025-2035
  • Figure 34: North America Attractiveness Analysis by Species/Strain Group
  • Figure 35: North America Value Share and BPS Analysis by Formulation, 2025 and 2035
  • Figure 36: North America Y-o-Y Growth Comparison by Formulation, 2025-2035
  • Figure 37: North America Attractiveness Analysis by Formulation
  • Figure 38: North America Value Share and BPS Analysis by Mode of Action, 2025 and 2035
  • Figure 39: North America Y-o-Y Growth Comparison by Mode of Action, 2025-2035
  • Figure 40: North America Attractiveness Analysis by Mode of Action
  • Figure 41: North America Value Share and BPS Analysis by Application Method, 2025 and 2035
  • Figure 42: North America Y-o-Y Growth Comparison by Application Method, 2025-2035
  • Figure 43: North America Attractiveness Analysis by Application Method
  • Figure 44: North America Value Share and BPS Analysis by Crop, 2025 and 2035
  • Figure 45: North America Y-o-Y Growth Comparison by Crop, 2025-2035
  • Figure 46: North America Attractiveness Analysis by Crop
  • Figure 47: North America Value Share and BPS Analysis by Production System, 2025 and 2035
  • Figure 48: North America Y-o-Y Growth Comparison by Production System, 2025-2035
  • Figure 49: North America Attractiveness Analysis by Production System
  • Figure 50: Latin America Value Share and BPS Analysis by Country, 2025 and 2035
  • Figure 51: Latin America Value Share and BPS Analysis by Species/Strain Group, 2025 and 2035
  • Figure 52: Latin America Y-o-Y Growth Comparison by Species/Strain Group, 2025-2035
  • Figure 53: Latin America Attractiveness Analysis by Species/Strain Group
  • Figure 54: Latin America Value Share and BPS Analysis by Formulation, 2025 and 2035
  • Figure 55: Latin America Y-o-Y Growth Comparison by Formulation, 2025-2035
  • Figure 56: Latin America Attractiveness Analysis by Formulation
  • Figure 57: Latin America Value Share and BPS Analysis by Mode of Action, 2025 and 2035
  • Figure 58: Latin America Y-o-Y Growth Comparison by Mode of Action, 2025-2035
  • Figure 59: Latin America Attractiveness Analysis by Mode of Action
  • Figure 60: Latin America Value Share and BPS Analysis by Application Method, 2025 and 2035
  • Figure 61: Latin America Y-o-Y Growth Comparison by Application Method, 2025-2035
  • Figure 62: Latin America Attractiveness Analysis by Application Method
  • Figure 63: Latin America Value Share and BPS Analysis by Crop, 2025 and 2035
  • Figure 64: Latin America Y-o-Y Growth Comparison by Crop, 2025-2035
  • Figure 65: Latin America Attractiveness Analysis by Crop
  • Figure 66: Latin America Value Share and BPS Analysis by Production System, 2025 and 2035
  • Figure 67: Latin America Y-o-Y Growth Comparison by Production System, 2025-2035
  • Figure 68: Latin America Attractiveness Analysis by Production System
  • Figure 69: Europe Value Share and BPS Analysis by Country, 2025 and 2035
  • Figure 70: Europe Value Share and BPS Analysis by Species/Strain Group, 2025 and 2035
  • Figure 71: Europe Y-o-Y Growth Comparison by Species/Strain Group, 2025-2035
  • Figure 72: Europe Attractiveness Analysis by Species/Strain Group
  • Figure 73: Europe Value Share and BPS Analysis by Formulation, 2025 and 2035
  • Figure 74: Europe Y-o-Y Growth Comparison by Formulation, 2025-2035
  • Figure 75: Europe Attractiveness Analysis by Formulation
  • Figure 76: Europe Value Share and BPS Analysis by Mode of Action, 2025 and 2035
  • Figure 77: Europe Y-o-Y Growth Comparison by Mode of Action, 2025-2035
  • Figure 78: Europe Attractiveness Analysis by Mode of Action
  • Figure 79: Europe Value Share and BPS Analysis by Application Method, 2025 and 2035
  • Figure 80: Europe Y-o-Y Growth Comparison by Application Method, 2025-2035
  • Figure 81: Europe Attractiveness Analysis by Application Method
  • Figure 82: Europe Value Share and BPS Analysis by Crop, 2025 and 2035
  • Figure 83: Europe Y-o-Y Growth Comparison by Crop, 2025-2035
  • Figure 84: Europe Attractiveness Analysis by Crop
  • Figure 85: Europe Value Share and BPS Analysis by Production System, 2025 and 2035
  • Figure 86: Europe Y-o-Y Growth Comparison by Production System, 2025-2035
  • Figure 87: Europe Attractiveness Analysis by Production System
  • Figure 88: East Asia Value Share and BPS Analysis by Country, 2025 and 2035
  • Figure 89: East Asia Value Share and BPS Analysis by Species/Strain Group, 2025 and 2035
  • Figure 90: East Asia Y-o-Y Growth Comparison by Species/Strain Group, 2025-2035
  • Figure 91: East Asia Attractiveness Analysis by Species/Strain Group
  • Figure 92: East Asia Value Share and BPS Analysis by Formulation, 2025 and 2035
  • Figure 93: East Asia Y-o-Y Growth Comparison by Formulation, 2025-2035
  • Figure 94: East Asia Attractiveness Analysis by Formulation
  • Figure 95: East Asia Value Share and BPS Analysis by Mode of Action, 2025 and 2035
  • Figure 96: East Asia Y-o-Y Growth Comparison by Mode of Action, 2025-2035
  • Figure 97: East Asia Attractiveness Analysis by Mode of Action
  • Figure 98: East Asia Value Share and BPS Analysis by Application Method, 2025 and 2035
  • Figure 99: East Asia Y-o-Y Growth Comparison by Application Method, 2025-2035
  • Figure 100: East Asia Attractiveness Analysis by Application Method
  • Figure 101: East Asia Value Share and BPS Analysis by Crop, 2025 and 2035
  • Figure 102: East Asia Y-o-Y Growth Comparison by Crop, 2025-2035
  • Figure 103: East Asia Attractiveness Analysis by Crop
  • Figure 104: East Asia Value Share and BPS Analysis by Production System, 2025 and 2035
  • Figure 105: East Asia Y-o-Y Growth Comparison by Production System, 2025-2035
  • Figure 106: East Asia Attractiveness Analysis by Production System
  • Figure 107: South Asia & Pacific Value Share and BPS Analysis by Country, 2025 and 2035
  • Figure 108: South Asia & Pacific Value Share and BPS Analysis by Species/Strain Group, 2025 and 2035
  • Figure 109: South Asia & Pacific Y-o-Y Growth Comparison by Species/Strain Group, 2025-2035
  • Figure 110: South Asia & Pacific Attractiveness Analysis by Species/Strain Group
  • Figure 111: South Asia & Pacific Value Share and BPS Analysis by Formulation, 2025 and 2035
  • Figure 112: South Asia & Pacific Y-o-Y Growth Comparison by Formulation, 2025-2035
  • Figure 113: South Asia & Pacific Attractiveness Analysis by Formulation
  • Figure 114: South Asia & Pacific Value Share and BPS Analysis by Mode of Action, 2025 and 2035
  • Figure 115: South Asia & Pacific Y-o-Y Growth Comparison by Mode of Action, 2025-2035
  • Figure 116: South Asia & Pacific Attractiveness Analysis by Mode of Action
  • Figure 117: South Asia & Pacific Value Share and BPS Analysis by Application Method, 2025 and 2035
  • Figure 118: South Asia & Pacific Y-o-Y Growth Comparison by Application Method, 2025-2035
  • Figure 119: South Asia & Pacific Attractiveness Analysis by Application Method
  • Figure 120: South Asia & Pacific Value Share and BPS Analysis by Crop, 2025 and 2035
  • Figure 121: South Asia & Pacific Y-o-Y Growth Comparison by Crop, 2025-2035
  • Figure 122: South Asia & Pacific Attractiveness Analysis by Crop
  • Figure 123: South Asia & Pacific Value Share and BPS Analysis by Production System, 2025 and 2035
  • Figure 124: South Asia & Pacific Y-o-Y Growth Comparison by Production System, 2025-2035
  • Figure 125: South Asia & Pacific Attractiveness Analysis by Production System
  • Figure 126: Middle East and Africa Value Share and BPS Analysis by Country, 2025 and 2035
  • Figure 127: Middle East and Africa Value Share and BPS Analysis by Species/Strain Group, 2025 and 2035
  • Figure 128: Middle East and Africa Y-o-Y Growth Comparison by Species/Strain Group, 2025-2035
  • Figure 129: Middle East and Africa Attractiveness Analysis by Species/Strain Group
  • Figure 130: Middle East and Africa Value Share and BPS Analysis by Formulation, 2025 and 2035
  • Figure 131: Middle East and Africa Y-o-Y Growth Comparison by Formulation, 2025-2035
  • Figure 132: Middle East and Africa Attractiveness Analysis by Formulation
  • Figure 133: Middle East and Africa Value Share and BPS Analysis by Mode of Action, 2025 and 2035
  • Figure 134: Middle East and Africa Y-o-Y Growth Comparison by Mode of Action, 2025-2035
  • Figure 135: Middle East and Africa Attractiveness Analysis by Mode of Action
  • Figure 136: Middle East and Africa Value Share and BPS Analysis by Application Method, 2025 and 2035
  • Figure 137: Middle East and Africa Y-o-Y Growth Comparison by Application Method, 2025-2035
  • Figure 138: Middle East and Africa Attractiveness Analysis by Application Method
  • Figure 139: Middle East and Africa Value Share and BPS Analysis by Crop, 2025 and 2035
  • Figure 140: Middle East and Africa Y-o-Y Growth Comparison by Crop, 2025-2035
  • Figure 141: Middle East and Africa Attractiveness Analysis by Crop
  • Figure 142: Middle East and Africa Value Share and BPS Analysis by Production System, 2025 and 2035
  • Figure 143: Middle East and Africa Y-o-Y Growth Comparison by Production System, 2025-2035
  • Figure 144: Middle East and Africa Attractiveness Analysis by Production System
  • Figure 145: Global - Tier Structure Analysis
  • Figure 146: Global - Company Share Analysis

Frequently Asked Questions

What is the market size of the Bacillus-based Biofungicides Market in 2025?

The market is valued at USD 2,736.8 Million in 2025, led by strong adoption in fruits & vegetables (36% share) and dominance of B. amyloliquefaciens / B. velezensis strains (38% share).

What is the projected market size by 2035?

The market is expected to reach USD 7,733.2 Million by 2035, reflecting an absolute growth of USD 4,996.4 Million over the forecast period.

What is the CAGR for the forecast period 2025–2035?

A robust 10.9% CAGR has been projected, with East Asia (12.8%) and South Asia & Pacific (13.2%) expanding fastest.

Which species/strain group dominates the market in 2025?

B. amyloliquefaciens / B. velezensis leads with a 38% share in 2025, supported by broad-spectrum antibiosis and strong performance in both conventional and organic systems.

Which formulation is expanding fastest?

SC/SL suspension/soluble concentrates grow quickly at 12.4% CAGR, while micro-encapsulated/novel formats post the highest pace at 13.6% CAGR, improving stability and ease of use.

Future Market Insights

Bacillus-based biofungicides Market

Chat With

MaRIA

Hi There, I am MaRIA, Your Market Research Intelligence Assistant. How may I help you?