Bacillus Coagulans Market Size and Share Forecast Outlook 2025 to 2035

The Bacillus Coagulans Market is estimated to be valued at USD 178.1 million in 2025 and is projected to reach USD 268.7 million by 2035, registering a compound annual growth rate (CAGR) of 4.2% over the forecast period.
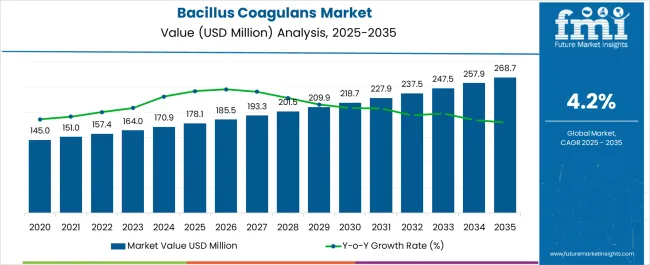
Quick Stats for Bacillus Coagulans Market

  • Bacillus Coagulans Market Value (2025): USD 178.1 million
  • Bacillus Coagulans Market Forecast Value (2035): USD 268.7 million
  • Bacillus Coagulans Market Forecast CAGR: 4.2%
  • Leading Segment in Bacillus Coagulans Market in 2025: Bacillus Coagulans Type 1 (45.0%)
  • Key Growth Regions in Bacillus Coagulans Market: North America, Asia-Pacific, Europe
  • Top Key Players in Bacillus Coagulans Market: Ganeden, Sabinsa Corporation, UAS Laboratories, Sanzyme, Mitsubishi Chemical Foods Corporation, Mystical Biotech Pvt. Ltd., Aumgene Biosciences, Unique Biotech Ltd., Nebraska Culture, Syngem Biotech

Bacillus Coagulans Market Market Value Analysis

Bacillus Coagulans Market Key Takeaways

Metric Value
Bacillus Coagulans Market Estimated Value in (2025 E) USD 178.1 million
Bacillus Coagulans Market Forecast Value in (2035 F) USD 268.7 million
Forecast CAGR (2025 to 2035) 4.2%

Why is the Bacillus Coagulans Market Growing?

The Bacillus Coagulans market is experiencing steady growth driven by increasing awareness of gut health and the rising demand for functional foods and dietary supplements. In 2025, the market is witnessing significant adoption in food and beverage formulations, nutraceuticals, and pharmaceutical applications due to the probiotic’s ability to survive harsh gastric conditions and confer health benefits. Expansion in health-conscious consumer segments, coupled with the growing trend of preventive healthcare, is shaping the current market scenario.

Increased incorporation of Bacillus Coagulans in fortified beverages, dairy alternatives, and snack products is further supporting growth, as manufacturers seek shelf-stable and effective probiotic solutions. Investment in R&D and the launch of novel formulations have enhanced product efficacy and consumer acceptance.

Additionally, the market outlook is strengthened by the proliferation of organized retail channels and the increasing penetration of modern distribution networks, which enable wider availability across urban and semi-urban regions Continued awareness campaigns and education on digestive health are anticipated to sustain demand, making Bacillus Coagulans a preferred choice among probiotics for both commercial and consumer applications.

Segmental Analysis

The bacillus coagulans market is segmented by type, end use, distribution channel, and geographic regions. By type, bacillus coagulans market is divided into Bacillus Coagulans Type 1, Bacillus Coagulans Type 2, and Bacillus Coagulans Type 3. In terms of end use, bacillus coagulans market is classified into Food And Beverage, Bakery Products, Dairy Products, Processed Foods, Pharmaceuticals, Dietary Supplements, Animal Feed, and Other. Based on distribution channel, bacillus coagulans market is segmented into Wholesale, Online Retailer, Supermarket, and Specialty Stores. Regionally, the bacillus coagulans industry is classified into North America, Latin America, Western Europe, Eastern Europe, Balkan & Baltic Countries, Russia & Belarus, Central Asia, East Asia, South Asia & Pacific, and the Middle East & Africa.
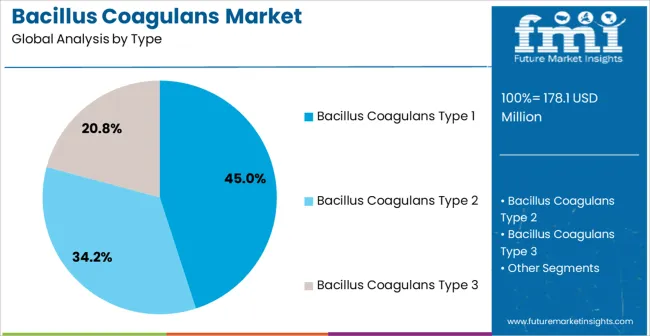
Insights into the Bacillus Coagulans Type 1 Segment

Bacillus Coagulans Market Analysis By Type

Bacillus Coagulans Type 1 is projected to hold 45.00% of the market revenue share in 2025, establishing it as the leading type in the market. Its dominance is being driven by superior viability under high-temperature processing, long shelf life, and strong resistance to acidic environments, which makes it suitable for inclusion in diverse functional foods and beverages.

The adoption of this type is further supported by research validating its efficacy in improving gut microbiota balance, enhancing digestion, and promoting overall wellness. Manufacturers prefer Bacillus Coagulans Type 1 due to its reliable performance in powdered, capsule, and liquid formulations, enabling cost-effective large-scale production without compromising probiotic functionality.

Growing demand for ready-to-consume functional products and dietary supplements has encouraged the development of Type 1-based formulations that are easily integrated into both established and novel products Its proven stability in commercial processing environments and the flexibility of incorporation into various delivery formats have reinforced its leading position in the market.
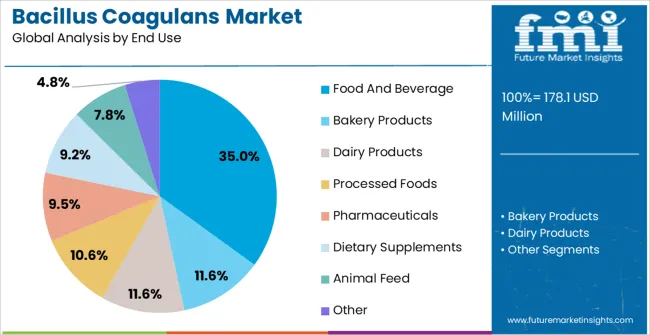
Insights into the Food and Beverage End Use Segment

Bacillus Coagulans Market Analysis By End Use

The Food and Beverage end-use segment is expected to account for 35.00% of the Bacillus Coagulans market revenue in 2025, making it the largest contributor among all applications. Growth in this segment is being driven by the rising incorporation of probiotics into functional beverages, dairy alternatives, fortified snacks, and nutritional supplements. Consumer preference for health-oriented products with digestive and immune health benefits has strongly influenced adoption.

Food and beverage manufacturers are increasingly leveraging Bacillus Coagulans for its heat resistance and shelf-stability, which allows it to retain viability during processing and storage. The segment has also benefited from reformulation trends in plant-based and low-sugar products where probiotics are being used to enhance functional value.

Additionally, the ability to integrate Bacillus Coagulans without altering taste or texture has further accelerated uptake As consumer awareness of gut health expands, the Food and Beverage segment is expected to maintain its leadership position, driven by innovations in functional products and increasing demand for convenient, probiotic-enriched consumables.
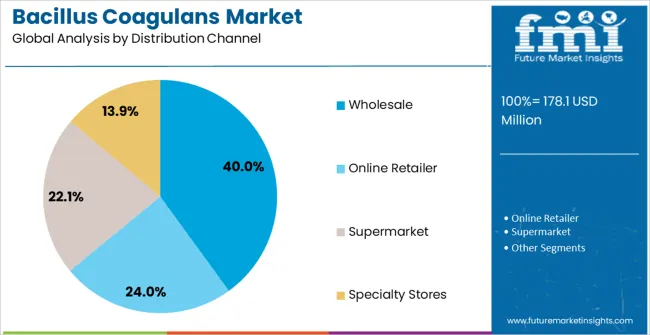
Insights into the Wholesale Distribution Channel Segment

Bacillus Coagulans Market Analysis By Distribution Channel

The Wholesale distribution channel segment is projected to hold 40.00% of the Bacillus Coagulans market revenue in 2025, establishing it as the leading channel for product movement. This prominence is being driven by the efficiency and scalability offered by wholesale networks, which enable manufacturers to reach a wide range of retailers, food service providers, and distributors. Adoption is facilitated by cost-effective bulk purchasing, simplified logistics, and the ability to supply diverse end-use segments without requiring direct manufacturer intervention.

Wholesale distribution is particularly advantageous in supplying functional food and dietary supplement markets, where demand volumes are substantial and consistent. The channel also supports rapid market penetration for new product launches and allows flexibility in inventory management.

With expanding retail networks and growing health-focused consumer bases, wholesale distribution continues to act as a critical conduit for Bacillus Coagulans products, ensuring timely availability and consistent supply across multiple geographies This channel’s reliability and broad reach reinforce its position as the dominant mode of distribution in the market.

Market Overview

Bacillus Coagulans Market Outlook from (2025 to 2035)

Bacillus coagulans is a type of bacteria that is utilized as a probiotic due to its ability to withstand harsh acidic environments. This makes it ideal for concentrating on the digestive system in humans, providing relief from various gastrointestinal issues such as stomach aches, constipation, and irritable bowel syndrome. Moreover, this resilient bacterium is also useful in animal feeding as it possesses beneficial properties such as improved immunity, prevention of respiratory ailments, and anti-cancer properties.

The global market for Bacillus coagulans has experienced significant growth opportunities due to an increase in demand for functional foods and growing health concerns. The market expansion is further supported by increased research and development expenditures. However, the lack of awareness about the effectiveness of Bacillus coagulans among consumers has hindered its growth. Nonetheless, the market is expected to expand in emerging economies as consumer demand for Bacillus coagulans products increases, creating new opportunities for growth.

In our new study, ESOMAR-certified market research and consulting firm Future Market Insights (FMI) offers insights into key factors driving demand for Bacillus Coagulans.
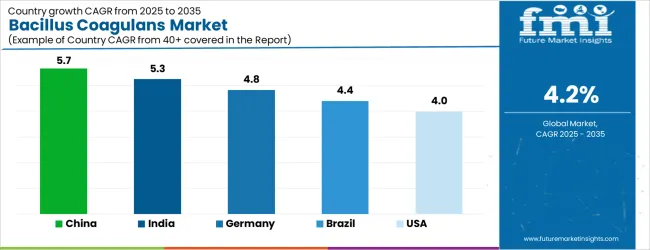
Analysis of Bacillus Coagulans Market By Key Countries

Bacillus Coagulans Market Cagr Analysis By Country

Country CAGR
China 5.7%
India 5.3%
Germany 4.8%
Brazil 4.4%
USA 4.0%
UK 3.6%
Japan 3.2%

Country-wise Analysis

The Bacillus Coagulans Market is expected to register a CAGR of 4.2% during the forecast period, exhibiting varied country level momentum. China leads with the highest CAGR of 5.7%, followed by India at 5.3%. Developed markets such as Germany, France, and the UK continue to expand steadily, while the USA is likely to grow at consistent rates. Japan posts the lowest CAGR at 3.2%, yet still underscores a broadly positive trajectory for the global Bacillus Coagulans Market. In 2024, Germany held a dominant revenue in the Western Europe market and is expected to grow with a CAGR of 4.8%. The USA Bacillus Coagulans Market is estimated to be valued at USD 66.1 million in 2025 and is anticipated to reach a valuation of USD 66.1 million by 2035. Sales are projected to rise at a CAGR of 0.0% over the forecast period between 2025 and 2035. While Japan and South Korea markets are estimated to be valued at USD 8.3 million and USD 6.1 million respectively in 2025.
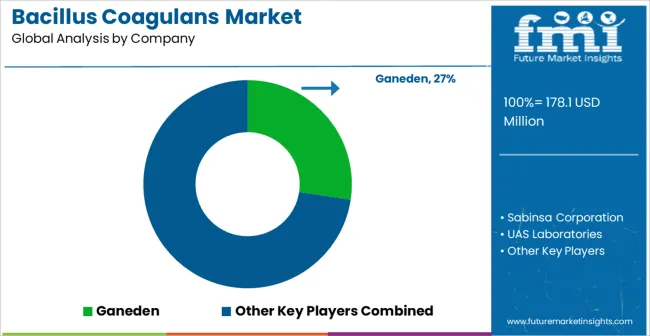
Key Players in the Bacillus Coagulans Market

Bacillus Coagulans Market Analysis By Company

  • Ganeden
  • Sabinsa Corporation
  • UAS Laboratories
  • Sanzyme
  • Mitsubishi Chemical Foods Corporation
  • Mystical Biotech Pvt. Ltd.
  • Aumgene Biosciences
  • Unique Biotech Ltd.
  • Nebraska Culture
  • Syngem Biotech

Scope of the Report

Item Value
Quantitative Units USD 178.1 Million
Type Bacillus Coagulans Type 1, Bacillus Coagulans Type 2, and Bacillus Coagulans Type 3
End Use Food And Beverage, Bakery Products, Dairy Products, Processed Foods, Pharmaceuticals, Dietary Supplements, Animal Feed, and Other
Distribution Channel Wholesale, Online Retailer, Supermarket, and Specialty Stores
Regions Covered North America, Europe, Asia-Pacific, Latin America, Middle East & Africa
Country Covered United States, Canada, Germany, France, United Kingdom, China, Japan, India, Brazil, South Africa
Key Companies Profiled Ganeden, Sabinsa Corporation, UAS Laboratories, Sanzyme, Mitsubishi Chemical Foods Corporation, Mystical Biotech Pvt. Ltd., Aumgene Biosciences, Unique Biotech Ltd., Nebraska Culture, and Syngem Biotech

Bacillus Coagulans Market by Segments

Type:

  • Bacillus Coagulans Type 1
  • Bacillus Coagulans Type 2
  • Bacillus Coagulans Type 3

End Use:

  • Food And Beverage
  • Bakery Products
  • Dairy Products
  • Processed Foods
  • Pharmaceuticals
  • Dietary Supplements
  • Animal Feed
  • Other

Distribution Channel:

  • Wholesale
  • Online Retailer
  • Supermarket
  • Specialty Stores

Region:

  • North America
    • USA
    • Canada
    • Mexico
  • Latin America
    • Brazil
    • Chile
    • Rest of Latin America
  • Western Europe
    • Germany
    • UK
    • Italy
    • Spain
    • France
    • Nordic
    • BENELUX
    • Rest of Western Europe
  • Eastern Europe
    • Russia
    • Poland
    • Hungary
    • Balkan & Baltic
    • Rest of Eastern Europe
  • East Asia
    • China
    • Japan
    • South Korea
  • South Asia and Pacific
    • India
    • ASEAN
    • Australia & New Zealand
    • Rest of South Asia and Pacific
  • Middle East & Africa
    • Kingdom of Saudi Arabia
    • Other GCC Countries
    • Turkiye
    • South Africa
    • Other African Union
    • Rest of Middle East & Africa

Frequently Asked Questions

How big is the bacillus coagulans market in 2025?

The global bacillus coagulans market is estimated to be valued at USD 178.1 million in 2025.

What will be the size of bacillus coagulans market in 2035?

The market size for the bacillus coagulans market is projected to reach USD 268.7 million by 2035.

How much will be the bacillus coagulans market growth between 2025 and 2035?

The bacillus coagulans market is expected to grow at a 4.2% CAGR between 2025 and 2035.

What are the key product types in the bacillus coagulans market?

The key product types in bacillus coagulans market are bacillus coagulans type 1, bacillus coagulans type 2 and bacillus coagulans type 3.

Which end use segment to contribute significant share in the bacillus coagulans market in 2025?

In terms of end use, food and beverage segment to command 35.0% share in the bacillus coagulans market in 2025.

Table of Content

  1. Executive Summary
    • Global Market Outlook
    • Demand-side Trends
    • Supply-side Trends
    • Technology Roadmap Analysis
    • Analysis and Recommendations
  2. Market Overview
    • Market Coverage / Taxonomy
    • Market Definition / Scope / Limitations
  3. Market Background
    • Market Dynamics
      • Drivers
      • Restraints
      • Opportunity
      • Trends
    • Scenario Forecast
      • Demand in Optimistic Scenario
      • Demand in Likely Scenario
      • Demand in Conservative Scenario
    • Opportunity Map Analysis
    • Product Life Cycle Analysis
    • Supply Chain Analysis
    • Investment Feasibility Matrix
    • Value Chain Analysis
    • PESTLE and Porter’s Analysis
    • Regulatory Landscape
    • Regional Parent Market Outlook
    • Production and Consumption Statistics
    • Import and Export Statistics
  4. Global Market Analysis 2020 to 2024 and Forecast, 2025 to 2035
    • Historical Market Size Value (USD Million) Analysis, 2020 to 2024
    • Current and Future Market Size Value (USD Million) Projections, 2025 to 2035
      • Y-o-Y Growth Trend Analysis
      • Absolute $ Opportunity Analysis
  5. Global Market Pricing Analysis 2020 to 2024 and Forecast 2025 to 2035
  6. Global Market Analysis 2020 to 2024 and Forecast 2025 to 2035, By Type
    • Introduction / Key Findings
    • Historical Market Size Value (USD Million) Analysis By Type , 2020 to 2024
    • Current and Future Market Size Value (USD Million) Analysis and Forecast By Type , 2025 to 2035
      • Bacillus Coagulans Type 1
      • Bacillus Coagulans Type 2
      • Bacillus Coagulans Type 3
    • Y-o-Y Growth Trend Analysis By Type , 2020 to 2024
    • Absolute $ Opportunity Analysis By Type , 2025 to 2035
  7. Global Market Analysis 2020 to 2024 and Forecast 2025 to 2035, By End Use
    • Introduction / Key Findings
    • Historical Market Size Value (USD Million) Analysis By End Use, 2020 to 2024
    • Current and Future Market Size Value (USD Million) Analysis and Forecast By End Use, 2025 to 2035
      • Food And Beverage
      • Bakery Products
      • Dairy Products
      • Processed Foods
      • Pharmaceuticals
      • Dietary Supplements
      • Animal Feed
      • Other
    • Y-o-Y Growth Trend Analysis By End Use, 2020 to 2024
    • Absolute $ Opportunity Analysis By End Use, 2025 to 2035
  8. Global Market Analysis 2020 to 2024 and Forecast 2025 to 2035, By Distribution Channel
    • Introduction / Key Findings
    • Historical Market Size Value (USD Million) Analysis By Distribution Channel, 2020 to 2024
    • Current and Future Market Size Value (USD Million) Analysis and Forecast By Distribution Channel, 2025 to 2035
      • Wholesale
      • Online Retailer
      • Supermarket
      • Specialty Stores
    • Y-o-Y Growth Trend Analysis By Distribution Channel, 2020 to 2024
    • Absolute $ Opportunity Analysis By Distribution Channel, 2025 to 2035
  9. Global Market Analysis 2020 to 2024 and Forecast 2025 to 2035, By Region
    • Introduction
    • Historical Market Size Value (USD Million) Analysis By Region, 2020 to 2024
    • Current Market Size Value (USD Million) Analysis and Forecast By Region, 2025 to 2035
      • North America
      • Latin America
      • Western Europe
      • Eastern Europe
      • East Asia
      • South Asia and Pacific
      • Middle East & Africa
    • Market Attractiveness Analysis By Region
  10. North America Market Analysis 2020 to 2024 and Forecast 2025 to 2035, By Country
    • Historical Market Size Value (USD Million) Trend Analysis By Market Taxonomy, 2020 to 2024
    • Market Size Value (USD Million) Forecast By Market Taxonomy, 2025 to 2035
      • By Country
        • USA
        • Canada
        • Mexico
      • By Type
      • By End Use
      • By Distribution Channel
    • Market Attractiveness Analysis
      • By Country
      • By Type
      • By End Use
      • By Distribution Channel
    • Key Takeaways
  11. Latin America Market Analysis 2020 to 2024 and Forecast 2025 to 2035, By Country
    • Historical Market Size Value (USD Million) Trend Analysis By Market Taxonomy, 2020 to 2024
    • Market Size Value (USD Million) Forecast By Market Taxonomy, 2025 to 2035
      • By Country
        • Brazil
        • Chile
        • Rest of Latin America
      • By Type
      • By End Use
      • By Distribution Channel
    • Market Attractiveness Analysis
      • By Country
      • By Type
      • By End Use
      • By Distribution Channel
    • Key Takeaways
  12. Western Europe Market Analysis 2020 to 2024 and Forecast 2025 to 2035, By Country
    • Historical Market Size Value (USD Million) Trend Analysis By Market Taxonomy, 2020 to 2024
    • Market Size Value (USD Million) Forecast By Market Taxonomy, 2025 to 2035
      • By Country
        • Germany
        • UK
        • Italy
        • Spain
        • France
        • Nordic
        • BENELUX
        • Rest of Western Europe
      • By Type
      • By End Use
      • By Distribution Channel
    • Market Attractiveness Analysis
      • By Country
      • By Type
      • By End Use
      • By Distribution Channel
    • Key Takeaways
  13. Eastern Europe Market Analysis 2020 to 2024 and Forecast 2025 to 2035, By Country
    • Historical Market Size Value (USD Million) Trend Analysis By Market Taxonomy, 2020 to 2024
    • Market Size Value (USD Million) Forecast By Market Taxonomy, 2025 to 2035
      • By Country
        • Russia
        • Poland
        • Hungary
        • Balkan & Baltic
        • Rest of Eastern Europe
      • By Type
      • By End Use
      • By Distribution Channel
    • Market Attractiveness Analysis
      • By Country
      • By Type
      • By End Use
      • By Distribution Channel
    • Key Takeaways
  14. East Asia Market Analysis 2020 to 2024 and Forecast 2025 to 2035, By Country
    • Historical Market Size Value (USD Million) Trend Analysis By Market Taxonomy, 2020 to 2024
    • Market Size Value (USD Million) Forecast By Market Taxonomy, 2025 to 2035
      • By Country
        • China
        • Japan
        • South Korea
      • By Type
      • By End Use
      • By Distribution Channel
    • Market Attractiveness Analysis
      • By Country
      • By Type
      • By End Use
      • By Distribution Channel
    • Key Takeaways
  15. South Asia and Pacific Market Analysis 2020 to 2024 and Forecast 2025 to 2035, By Country
    • Historical Market Size Value (USD Million) Trend Analysis By Market Taxonomy, 2020 to 2024
    • Market Size Value (USD Million) Forecast By Market Taxonomy, 2025 to 2035
      • By Country
        • India
        • ASEAN
        • Australia & New Zealand
        • Rest of South Asia and Pacific
      • By Type
      • By End Use
      • By Distribution Channel
    • Market Attractiveness Analysis
      • By Country
      • By Type
      • By End Use
      • By Distribution Channel
    • Key Takeaways
  16. Middle East & Africa Market Analysis 2020 to 2024 and Forecast 2025 to 2035, By Country
    • Historical Market Size Value (USD Million) Trend Analysis By Market Taxonomy, 2020 to 2024
    • Market Size Value (USD Million) Forecast By Market Taxonomy, 2025 to 2035
      • By Country
        • Kingdom of Saudi Arabia
        • Other GCC Countries
        • Turkiye
        • South Africa
        • Other African Union
        • Rest of Middle East & Africa
      • By Type
      • By End Use
      • By Distribution Channel
    • Market Attractiveness Analysis
      • By Country
      • By Type
      • By End Use
      • By Distribution Channel
    • Key Takeaways
  17. Key Countries Market Analysis
    • USA
      • Pricing Analysis
      • Market Share Analysis, 2024
        • By Type
        • By End Use
        • By Distribution Channel
    • Canada
      • Pricing Analysis
      • Market Share Analysis, 2024
        • By Type
        • By End Use
        • By Distribution Channel
    • Mexico
      • Pricing Analysis
      • Market Share Analysis, 2024
        • By Type
        • By End Use
        • By Distribution Channel
    • Brazil
      • Pricing Analysis
      • Market Share Analysis, 2024
        • By Type
        • By End Use
        • By Distribution Channel
    • Chile
      • Pricing Analysis
      • Market Share Analysis, 2024
        • By Type
        • By End Use
        • By Distribution Channel
    • Germany
      • Pricing Analysis
      • Market Share Analysis, 2024
        • By Type
        • By End Use
        • By Distribution Channel
    • UK
      • Pricing Analysis
      • Market Share Analysis, 2024
        • By Type
        • By End Use
        • By Distribution Channel
    • Italy
      • Pricing Analysis
      • Market Share Analysis, 2024
        • By Type
        • By End Use
        • By Distribution Channel
    • Spain
      • Pricing Analysis
      • Market Share Analysis, 2024
        • By Type
        • By End Use
        • By Distribution Channel
    • France
      • Pricing Analysis
      • Market Share Analysis, 2024
        • By Type
        • By End Use
        • By Distribution Channel
    • India
      • Pricing Analysis
      • Market Share Analysis, 2024
        • By Type
        • By End Use
        • By Distribution Channel
    • ASEAN
      • Pricing Analysis
      • Market Share Analysis, 2024
        • By Type
        • By End Use
        • By Distribution Channel
    • Australia & New Zealand
      • Pricing Analysis
      • Market Share Analysis, 2024
        • By Type
        • By End Use
        • By Distribution Channel
    • China
      • Pricing Analysis
      • Market Share Analysis, 2024
        • By Type
        • By End Use
        • By Distribution Channel
    • Japan
      • Pricing Analysis
      • Market Share Analysis, 2024
        • By Type
        • By End Use
        • By Distribution Channel
    • South Korea
      • Pricing Analysis
      • Market Share Analysis, 2024
        • By Type
        • By End Use
        • By Distribution Channel
    • Russia
      • Pricing Analysis
      • Market Share Analysis, 2024
        • By Type
        • By End Use
        • By Distribution Channel
    • Poland
      • Pricing Analysis
      • Market Share Analysis, 2024
        • By Type
        • By End Use
        • By Distribution Channel
    • Hungary
      • Pricing Analysis
      • Market Share Analysis, 2024
        • By Type
        • By End Use
        • By Distribution Channel
    • Kingdom of Saudi Arabia
      • Pricing Analysis
      • Market Share Analysis, 2024
        • By Type
        • By End Use
        • By Distribution Channel
    • Turkiye
      • Pricing Analysis
      • Market Share Analysis, 2024
        • By Type
        • By End Use
        • By Distribution Channel
    • South Africa
      • Pricing Analysis
      • Market Share Analysis, 2024
        • By Type
        • By End Use
        • By Distribution Channel
  18. Market Structure Analysis
    • Competition Dashboard
    • Competition Benchmarking
    • Market Share Analysis of Top Players
      • By Regional
      • By Type
      • By End Use
      • By Distribution Channel
  19. Competition Analysis
    • Competition Deep Dive
      • Ganeden
        • Overview
        • Product Portfolio
        • Profitability by Market Segments (Product/Age /Sales Channel/Region)
        • Sales Footprint
        • Strategy Overview
          • Marketing Strategy
          • Product Strategy
          • Channel Strategy
      • Sabinsa Corporation
      • UAS Laboratories
      • Sanzyme
      • Mitsubishi Chemical Foods Corporation
      • Mystical Biotech Pvt. Ltd.
      • Aumgene Biosciences
      • Unique Biotech Ltd.
      • Nebraska Culture
      • Syngem Biotech
  20. Assumptions & Acronyms Used
  21. Research Methodology

List of Tables

  • Table 1: Global Market Value (USD Million) Forecast by Region, 2020-2035
  • Table 2: Global Market Value (USD Million) Forecast by Type , 2020-2035
  • Table 3: Global Market Value (USD Million) Forecast by End Use, 2020-2035
  • Table 4: Global Market Value (USD Million) Forecast by Distribution Channel, 2020-2035
  • Table 5: North America Market Value (USD Million) Forecast by Country, 2020-2035
  • Table 6: North America Market Value (USD Million) Forecast by Type , 2020-2035
  • Table 7: North America Market Value (USD Million) Forecast by End Use, 2020-2035
  • Table 8: North America Market Value (USD Million) Forecast by Distribution Channel, 2020-2035
  • Table 9: Latin America Market Value (USD Million) Forecast by Country, 2020-2035
  • Table 10: Latin America Market Value (USD Million) Forecast by Type , 2020-2035
  • Table 11: Latin America Market Value (USD Million) Forecast by End Use, 2020-2035
  • Table 12: Latin America Market Value (USD Million) Forecast by Distribution Channel, 2020-2035
  • Table 13: Western Europe Market Value (USD Million) Forecast by Country, 2020-2035
  • Table 14: Western Europe Market Value (USD Million) Forecast by Type , 2020-2035
  • Table 15: Western Europe Market Value (USD Million) Forecast by End Use, 2020-2035
  • Table 16: Western Europe Market Value (USD Million) Forecast by Distribution Channel, 2020-2035
  • Table 17: Eastern Europe Market Value (USD Million) Forecast by Country, 2020-2035
  • Table 18: Eastern Europe Market Value (USD Million) Forecast by Type , 2020-2035
  • Table 19: Eastern Europe Market Value (USD Million) Forecast by End Use, 2020-2035
  • Table 20: Eastern Europe Market Value (USD Million) Forecast by Distribution Channel, 2020-2035
  • Table 21: East Asia Market Value (USD Million) Forecast by Country, 2020-2035
  • Table 22: East Asia Market Value (USD Million) Forecast by Type , 2020-2035
  • Table 23: East Asia Market Value (USD Million) Forecast by End Use, 2020-2035
  • Table 24: East Asia Market Value (USD Million) Forecast by Distribution Channel, 2020-2035
  • Table 25: South Asia and Pacific Market Value (USD Million) Forecast by Country, 2020-2035
  • Table 26: South Asia and Pacific Market Value (USD Million) Forecast by Type , 2020-2035
  • Table 27: South Asia and Pacific Market Value (USD Million) Forecast by End Use, 2020-2035
  • Table 28: South Asia and Pacific Market Value (USD Million) Forecast by Distribution Channel, 2020-2035
  • Table 29: Middle East & Africa Market Value (USD Million) Forecast by Country, 2020-2035
  • Table 30: Middle East & Africa Market Value (USD Million) Forecast by Type , 2020-2035
  • Table 31: Middle East & Africa Market Value (USD Million) Forecast by End Use, 2020-2035
  • Table 32: Middle East & Africa Market Value (USD Million) Forecast by Distribution Channel, 2020-2035

List of Figures

  • Figure 1: Global Market Pricing Analysis
  • Figure 2: Global Market Value (USD Million) Forecast 2020-2035
  • Figure 3: Global Market Value Share and BPS Analysis by Type , 2025 and 2035
  • Figure 4: Global Market Y-o-Y Growth Comparison by Type , 2025-2035
  • Figure 5: Global Market Attractiveness Analysis by Type
  • Figure 6: Global Market Value Share and BPS Analysis by End Use, 2025 and 2035
  • Figure 7: Global Market Y-o-Y Growth Comparison by End Use, 2025-2035
  • Figure 8: Global Market Attractiveness Analysis by End Use
  • Figure 9: Global Market Value Share and BPS Analysis by Distribution Channel, 2025 and 2035
  • Figure 10: Global Market Y-o-Y Growth Comparison by Distribution Channel, 2025-2035
  • Figure 11: Global Market Attractiveness Analysis by Distribution Channel
  • Figure 12: Global Market Value (USD Million) Share and BPS Analysis by Region, 2025 and 2035
  • Figure 13: Global Market Y-o-Y Growth Comparison by Region, 2025-2035
  • Figure 14: Global Market Attractiveness Analysis by Region
  • Figure 15: North America Market Incremental Dollar Opportunity, 2025-2035
  • Figure 16: Latin America Market Incremental Dollar Opportunity, 2025-2035
  • Figure 17: Western Europe Market Incremental Dollar Opportunity, 2025-2035
  • Figure 18: Eastern Europe Market Incremental Dollar Opportunity, 2025-2035
  • Figure 19: East Asia Market Incremental Dollar Opportunity, 2025-2035
  • Figure 20: South Asia and Pacific Market Incremental Dollar Opportunity, 2025-2035
  • Figure 21: Middle East & Africa Market Incremental Dollar Opportunity, 2025-2035
  • Figure 22: North America Market Value Share and BPS Analysis by Country, 2025 and 2035
  • Figure 23: North America Market Value Share and BPS Analysis by Type , 2025 and 2035
  • Figure 24: North America Market Y-o-Y Growth Comparison by Type , 2025-2035
  • Figure 25: North America Market Attractiveness Analysis by Type
  • Figure 26: North America Market Value Share and BPS Analysis by End Use, 2025 and 2035
  • Figure 27: North America Market Y-o-Y Growth Comparison by End Use, 2025-2035
  • Figure 28: North America Market Attractiveness Analysis by End Use
  • Figure 29: North America Market Value Share and BPS Analysis by Distribution Channel, 2025 and 2035
  • Figure 30: North America Market Y-o-Y Growth Comparison by Distribution Channel, 2025-2035
  • Figure 31: North America Market Attractiveness Analysis by Distribution Channel
  • Figure 32: Latin America Market Value Share and BPS Analysis by Country, 2025 and 2035
  • Figure 33: Latin America Market Value Share and BPS Analysis by Type , 2025 and 2035
  • Figure 34: Latin America Market Y-o-Y Growth Comparison by Type , 2025-2035
  • Figure 35: Latin America Market Attractiveness Analysis by Type
  • Figure 36: Latin America Market Value Share and BPS Analysis by End Use, 2025 and 2035
  • Figure 37: Latin America Market Y-o-Y Growth Comparison by End Use, 2025-2035
  • Figure 38: Latin America Market Attractiveness Analysis by End Use
  • Figure 39: Latin America Market Value Share and BPS Analysis by Distribution Channel, 2025 and 2035
  • Figure 40: Latin America Market Y-o-Y Growth Comparison by Distribution Channel, 2025-2035
  • Figure 41: Latin America Market Attractiveness Analysis by Distribution Channel
  • Figure 42: Western Europe Market Value Share and BPS Analysis by Country, 2025 and 2035
  • Figure 43: Western Europe Market Value Share and BPS Analysis by Type , 2025 and 2035
  • Figure 44: Western Europe Market Y-o-Y Growth Comparison by Type , 2025-2035
  • Figure 45: Western Europe Market Attractiveness Analysis by Type
  • Figure 46: Western Europe Market Value Share and BPS Analysis by End Use, 2025 and 2035
  • Figure 47: Western Europe Market Y-o-Y Growth Comparison by End Use, 2025-2035
  • Figure 48: Western Europe Market Attractiveness Analysis by End Use
  • Figure 49: Western Europe Market Value Share and BPS Analysis by Distribution Channel, 2025 and 2035
  • Figure 50: Western Europe Market Y-o-Y Growth Comparison by Distribution Channel, 2025-2035
  • Figure 51: Western Europe Market Attractiveness Analysis by Distribution Channel
  • Figure 52: Eastern Europe Market Value Share and BPS Analysis by Country, 2025 and 2035
  • Figure 53: Eastern Europe Market Value Share and BPS Analysis by Type , 2025 and 2035
  • Figure 54: Eastern Europe Market Y-o-Y Growth Comparison by Type , 2025-2035
  • Figure 55: Eastern Europe Market Attractiveness Analysis by Type
  • Figure 56: Eastern Europe Market Value Share and BPS Analysis by End Use, 2025 and 2035
  • Figure 57: Eastern Europe Market Y-o-Y Growth Comparison by End Use, 2025-2035
  • Figure 58: Eastern Europe Market Attractiveness Analysis by End Use
  • Figure 59: Eastern Europe Market Value Share and BPS Analysis by Distribution Channel, 2025 and 2035
  • Figure 60: Eastern Europe Market Y-o-Y Growth Comparison by Distribution Channel, 2025-2035
  • Figure 61: Eastern Europe Market Attractiveness Analysis by Distribution Channel
  • Figure 62: East Asia Market Value Share and BPS Analysis by Country, 2025 and 2035
  • Figure 63: East Asia Market Value Share and BPS Analysis by Type , 2025 and 2035
  • Figure 64: East Asia Market Y-o-Y Growth Comparison by Type , 2025-2035
  • Figure 65: East Asia Market Attractiveness Analysis by Type
  • Figure 66: East Asia Market Value Share and BPS Analysis by End Use, 2025 and 2035
  • Figure 67: East Asia Market Y-o-Y Growth Comparison by End Use, 2025-2035
  • Figure 68: East Asia Market Attractiveness Analysis by End Use
  • Figure 69: East Asia Market Value Share and BPS Analysis by Distribution Channel, 2025 and 2035
  • Figure 70: East Asia Market Y-o-Y Growth Comparison by Distribution Channel, 2025-2035
  • Figure 71: East Asia Market Attractiveness Analysis by Distribution Channel
  • Figure 72: South Asia and Pacific Market Value Share and BPS Analysis by Country, 2025 and 2035
  • Figure 73: South Asia and Pacific Market Value Share and BPS Analysis by Type , 2025 and 2035
  • Figure 74: South Asia and Pacific Market Y-o-Y Growth Comparison by Type , 2025-2035
  • Figure 75: South Asia and Pacific Market Attractiveness Analysis by Type
  • Figure 76: South Asia and Pacific Market Value Share and BPS Analysis by End Use, 2025 and 2035
  • Figure 77: South Asia and Pacific Market Y-o-Y Growth Comparison by End Use, 2025-2035
  • Figure 78: South Asia and Pacific Market Attractiveness Analysis by End Use
  • Figure 79: South Asia and Pacific Market Value Share and BPS Analysis by Distribution Channel, 2025 and 2035
  • Figure 80: South Asia and Pacific Market Y-o-Y Growth Comparison by Distribution Channel, 2025-2035
  • Figure 81: South Asia and Pacific Market Attractiveness Analysis by Distribution Channel
  • Figure 82: Middle East & Africa Market Value Share and BPS Analysis by Country, 2025 and 2035
  • Figure 83: Middle East & Africa Market Value Share and BPS Analysis by Type , 2025 and 2035
  • Figure 84: Middle East & Africa Market Y-o-Y Growth Comparison by Type , 2025-2035
  • Figure 85: Middle East & Africa Market Attractiveness Analysis by Type
  • Figure 86: Middle East & Africa Market Value Share and BPS Analysis by End Use, 2025 and 2035
  • Figure 87: Middle East & Africa Market Y-o-Y Growth Comparison by End Use, 2025-2035
  • Figure 88: Middle East & Africa Market Attractiveness Analysis by End Use
  • Figure 89: Middle East & Africa Market Value Share and BPS Analysis by Distribution Channel, 2025 and 2035
  • Figure 90: Middle East & Africa Market Y-o-Y Growth Comparison by Distribution Channel, 2025-2035
  • Figure 91: Middle East & Africa Market Attractiveness Analysis by Distribution Channel
  • Figure 92: Global Market - Tier Structure Analysis
  • Figure 93: Global Market - Company Share Analysis
Dashboard
Dashboard
Dashboard
Dashboard
Dashboard
Dashboard

Full Research Suite comprises of:

Market outlook & trends analysis

Market outlook & trends analysis

Interviews & case studies

Interviews & case studies

Strategic recommendations

Strategic recommendations

Vendor profiles & capabilities analysis

Vendor profiles & capabilities analysis

5-year forecasts

5-year forecasts

8 regions and 60+ country-level data splits

8 regions and 60+ country-level data splits

Market segment data splits

Market segment data splits

12 months of continuous data updates

12 months of continuous data updates

DELIVERED AS:

PDF EXCEL ONLINE

Full Research Suite


$3500

$5000

$6500

Buy Report Now
Similar Industry Reports

Similar Industry Reports

Bacillus-based biofungicides Market

Bacillus-based Biofungicides Market Size and Share Forecast Outlook 2025 to 2035

Future Market Insights

Bacillus Coagulans Market

Chat With MaRIA

Chat With

MaRIA

Hi There, I am MaRIA, Your Market Research Intelligence Assistant. How may I help you?