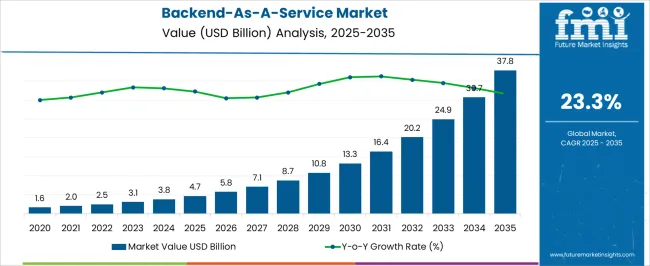
The Backend-As-A-Service Market is estimated to be valued at USD 4.7 billion in 2025 and is projected to reach USD 37.8 billion by 2035, registering a compound annual growth rate (CAGR) of 23.3% over the forecast period.
| Metric | Value |
|---|---|
| Backend-As-A-Service Market Estimated Value in (2025 E) | USD 4.7 billion |
| Backend-As-A-Service Market Forecast Value in (2035 F) | USD 37.8 billion |
| Forecast CAGR (2025 to 2035) | 23.3% |
The Backend-As-A-Service market is being propelled by the growing need for scalable and cost-efficient cloud-based solutions that streamline application development and deployment. The current market environment reflects an increasing preference for platforms that eliminate the complexity of server-side management, allowing developers to focus on frontend functionality and user experience.
The adoption of cloud services has been accelerated by digital transformation initiatives across industries, particularly in sectors where rapid application scaling and security compliance are critical. Enhanced data storage solutions, real-time synchronization, and API management capabilities are further strengthening the market outlook.
Growing investments in mobile-first strategies, coupled with the rising number of startups and small businesses seeking lean infrastructure solutions, are opening avenues for BaaS providers As organizations look to optimize operational costs and reduce time-to-market, the market is expected to witness continued expansion driven by innovation in automation, cross-platform compatibility, and edge computing capabilities.
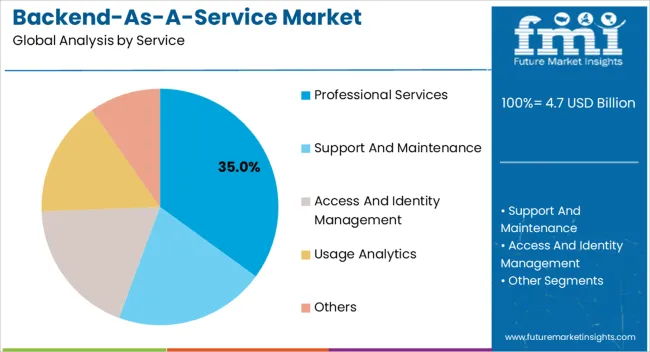
The Professional Services segment is expected to account for 35.0% of the Backend-As-A-Service market revenue share in 2025, making it the leading service category. This position is being attributed to the rising demand for expert consultation in architecture design, security implementation, and integration with existing enterprise applications.
Organizations have increasingly relied on professional service offerings to streamline backend development workflows and ensure compliance with data protection regulations. The need for customized solutions, especially in highly regulated industries such as finance and healthcare, has further contributed to the expansion of this segment.
Additionally, as businesses aim to deploy applications rapidly without heavy in-house technical expertise, professional services have become vital in reducing deployment risks and improving system performance The availability of specialized teams that assist with migration, optimization, and ongoing support has reinforced the segment’s value proposition, making it a preferred choice among developers and enterprises seeking reliable backend solutions.
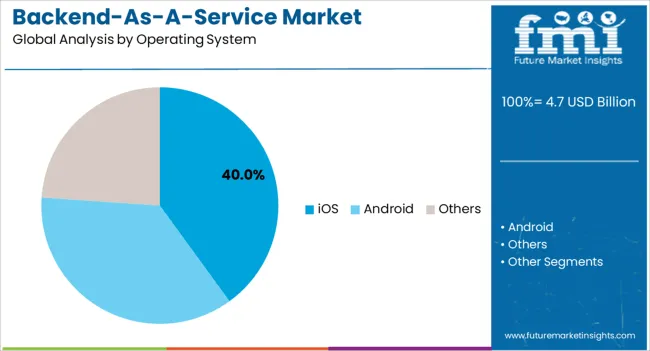
The iOS segment is projected to hold 40.0% of the Backend-As-A-Service market revenue share in 2025, marking it as the dominant operating system category. This lead is being driven by the growing popularity of iOS devices among high-income user groups and businesses that prioritize security, performance, and user experience.
The demand for seamless app functionality across Apple devices has required backend platforms that offer tailored APIs, data synchronization, and real-time notifications optimized for iOS environments. Enhanced developer tools, integrated testing frameworks, and robust authentication mechanisms have further encouraged enterprises to deploy backend services specifically aligned with iOS ecosystems.
Additionally, the widespread use of iPhones and iPads in corporate and consumer settings has created a dependable user base, which has, in turn, attracted application developers seeking efficient deployment models As organizations expand their mobile engagement strategies, the iOS segment is expected to sustain growth through enhanced security protocols, improved device compatibility, and increasing reliance on cloud-powered backend services.
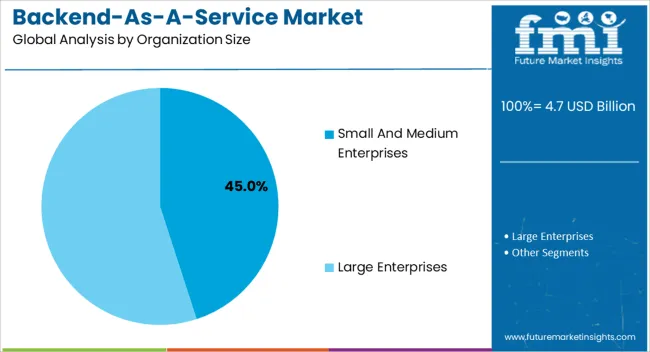
The Small And Medium Enterprises segment is anticipated to represent 45.0% of the Backend-As-A-Service market revenue share in 2025, establishing it as the largest end-user category. This leading position is being attributed to the growing number of startups and mid-sized businesses that require affordable and scalable backend infrastructure to support rapid growth. These enterprises have increasingly adopted BaaS solutions to reduce the need for large in-house IT teams and to lower development and maintenance costs.
Cloud-based backend services offer modular, pay-as-you-grow options that align with fluctuating workloads and limited budgets, making them highly suitable for small and medium organizations. Furthermore, the increasing availability of ready-to-use APIs, automated security features, and analytics tools has enhanced the operational efficiency of these businesses.
The need for accelerated deployment cycles, coupled with competitive pressures to improve customer experience, has resulted in widespread reliance on BaaS platforms With digital-first strategies becoming a core focus across sectors, this segment is expected to continue expanding as more businesses seek agile and cost-effective backend solutions.
The adoption of mobile devices, like smartphones, laptops, and wearables, has surged significantly, mainly due to advantages offered, like mobility and advanced specifications. It is anticipated that the adoption of mobile devices is likely to rise, especially among the age groups of 18 to 40.
According to BuildFire, globally, there are about 2.7 billion smartphone users while 1.35 billion tablet users are expanding by 2% every year. The social media penetration rate across various regions and adoption of cloud infrastructure and services contributes to the global demand. Also, the number of global smartphone users across the key countries and global data traffic via smartphones are rising immensely.
The increase in the use of smartphones and the creation of user-friendly mobile apps and social media platforms are projected to boost the amount of data generated from social media.
AI technology is used by various large enterprises to comprehend, generate, and analyze trends, and understand the topics, which garner maximum attention in real-time. Hence, the growing engagement of users on social media using mobile devices is considered the most significant driver of the BaaS market.
Ongoing developments further augment the market in the coming time. For instance, in September 2020, Oracle rolled out the updated version of the Oracle Mobile Cloud service. The updated version is integrated with Oracle data centers, which helps migrate Oracle Mobile Hub.
| Attributes | Details |
|---|---|
| Backend-as-a-Service Market CAGR (2025 to 2035) | 24.5% |
| Backend-as-a-Service Market Size (2025) | USD 3,011.4 million |
| Backend-as-a-Service Market Size (2035) | USD 27,016.6 million |
Developing BaaS within enterprise premises demands a higher cost of initial investment, time, and effort. Further, the complexities involved, such as mode of deployment, development, and infrastructure cost, inhibit the adoption of BaaS.
SMEs have budget constraints that hinder the transformation of the IT infrastructure. Therefore, enterprises are sometimes hesitant to opt for cloud mobile BaaS systems.
However, rising smartphone adoption, increasing specialized cloud sets, and the growing number of application drives bode well for the market in the forecast period and also act as a significant counter to the aforementioned hampering factors.
Ongoing Research and Development on BaaS is likely to offer significant opportunities to the players during the forecast period. The introduction of novel services is likely to augment the market size in the coming time.
In April 2025, FIS, a USA-based financial technology provider, announced the launch of its Banking-as-a-Service (BaaS) Hub for financial entities of all sizes. The new solution focuses on strengthening banks, fintech, and credit unions to build digital banking and payment ecosystems to offer services to merchants and customers.
Such initiatives are expected to make the market more interactive and offer significant opportunities for expansion in the coming time.
| Countries | Market Share (202) |
|---|---|
| United States | 19.3% |
| Germany | 10.1% |
| Japan | 7.7% |
| Australia | 3.2% |
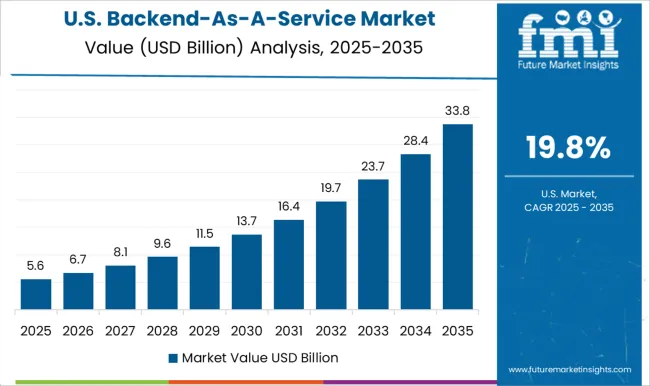
As per the analysis, North America is expected to dominate the global market during the forecast period. In 2025, the region garnered 33.1% of the global market share.
The United States is expected to hold the maximum share in the backend as a service market. This is attributed to the presence of large telecom giants, renowned suppliers, and end-user industries that continuously acclimatize to newer technologies for better business productivity and work efficiency. For instance, AT&T and Oracle struck a deal in 2020 which involved the operator moving thousands of its internal databases to Oracle Cloud.
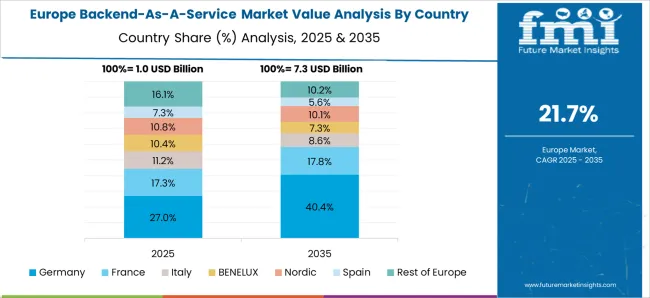
According to the analysis at FMI, the Backend-As-A-Service business in Europe is likely to be the second leading market. In 2025, the region secured a 21.9% of the global market share.
The growth of the regional market is attributed to the development of banking-as-a-service (BaaS). The United Kingdom is projected to be the leading market for banking-as-a-service (BaaS) platforms owing to the strong presence of market providers and accounts for approximately 25% of Europe’s market share.
Players in the region are taking various initiatives to strengthen the regional market. For instance, Treezor, a France-based Banking-as-a-Service (BaaS), continued to develop by obtaining an authorization extension from the French regulator (ACPR) to provide all payment services and became the first Payment and Electronic Money Institution to have every type of authorization in 2024.
| Countries | Market CAGR (2025 to 2035) |
|---|---|
| China | 26.8% |
| India | 24.9% |
The market in Asia Pacific is expected to be the significantly growing market during the forecast period. The growth of the regional market is attributed to the increasing usage of Banking-as-a-service in large organizations, along with the presence of various developing countries like India, China, and Japan.
Large organizations account for more than 50% market share in Asia Pacific and are expected to continue their domination as it is increasing its customer base by investing in digital transformation to offer tech-savvy banking operations. Other factors contributing to the market growth include the growing adoption of mobile apps, increased affordability, and surged disposable income in developing countries.
Based on the platform, the BaaS market is segmented into Android, iOS, and others ( Windows, Blackberry, Titanium, HTML, and Node.js).
The iOS segment is expected to display the leading CAGR during the forecast period, while the Android platform is expected to hold the leading market size. The iOS segment expanded at a share of 53.6% in 2025.
The rapid adoption of the cloud mobile BaaS solution has resulted in an increasing number of mobile devices with platforms, such as Android, iOS, and Windows Phone, which is projected to benefit the industry in the forecast period.
Startups are expected to make a significant contribution to developing the global market. Some of the emerging names in the market include 8Base, Apache Usergrid, AWS Amplify, Back4App, Backendless, built.io Backend, Couchbase, Firebase, Parse, Kuzzle, and Kumulos, among others.
Powered by GraphQL, 8Base is a popular Cloud-Based platform amongst startups, SMBs, and large enterprises. It offers professional-grade web and mobile application development services. This BaaS platform has a vast set of features for developers. With its Command Line Interface, you easily generate custom functions and manage workspaces. Other features include Access Controls, Data Modeling, Debugging, Self-hosting, and Source Control Management.
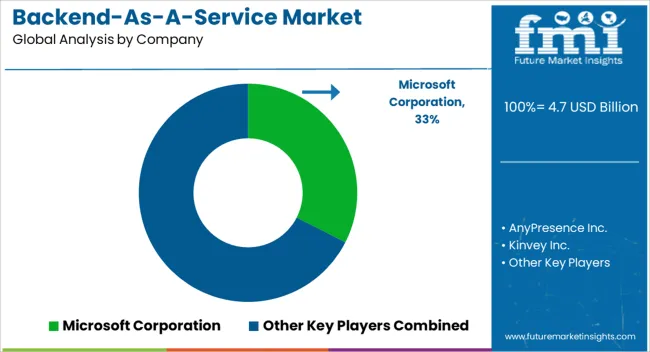
Recent Developments by Key Players:
Key Players
The global backend-as-a-service market is estimated to be valued at USD 4.7 billion in 2025.
The market size for the backend-as-a-service market is projected to reach USD 37.8 billion by 2035.
The backend-as-a-service market is expected to grow at a 23.3% CAGR between 2025 and 2035.
The key product types in backend-as-a-service market are professional services, support and maintenance, access and identity management, usage analytics and others.
In terms of operating system, ios segment to command 40.0% share in the backend-as-a-service market in 2025.


Full Research Suite comprises of:
Market outlook & trends analysis
Interviews & case studies
Strategic recommendations
Vendor profiles & capabilities analysis
5-year forecasts
8 regions and 60+ country-level data splits
Market segment data splits
12 months of continuous data updates
DELIVERED AS:
PDF EXCEL ONLINE

Thank you!
You will receive an email from our Business Development Manager. Please be sure to check your SPAM/JUNK folder too.
Chat With
MaRIA