Berberine Market Size and Share Forecast Outlook 2025 to 2035

The Global Berberine Market is expected to record a valuation of USD 1.79 billion in 2025 and USD 3.12 billion in 2035, with an increase of USD 1.33 billion, which equals a growth of 74% over the decade. The overall expansion represents a CAGR of 6.28% and a 1.74X increase in market size.
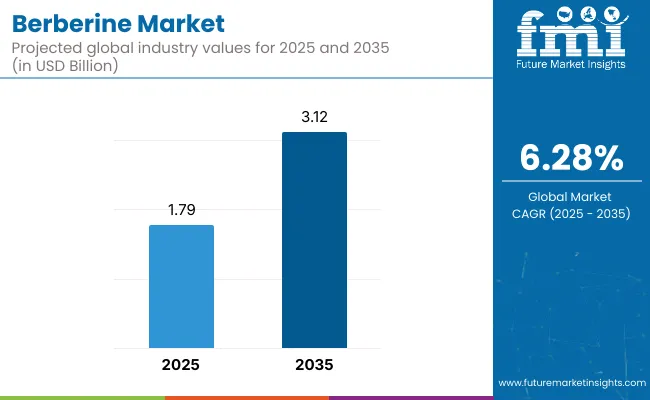
Quick Stats for Berberine Market

  • Berberine Market Value (2025): USD 1.79 billion
  • Berberine Market Forecast Value (2035): USD 3.12 billion
  • Berberine Market Forecast CAGR (2025 to 2035): 6.28%
  • Leading Segment in 2025 (Product Format): Capsules(45%)
  • Key Growth Regions: Asia-Pacific, North America, Europe
  • Top Key Players: Sichuan Benepure Pharm, Chengdu Chenlv Biological Tech, Sunriver Biotech, Sichuan Xieli Pharm, Alpspure Lifesciences, Quad Lifesciences, Inga Pharmaceuticals, NativePath, Science Natural Supplements

Berberine Market

Berberine Market Key Takeaways

Metric Value
Berberine Market Estimated Value in (2025E) USD 1.79 billion
Berberine Market Forecast Value in (2035F) USD 3.12 billion
Forecast CAGR (2025 to 2035) 6.28%

Between 2025 and 2030, the global berberine market is projected to expand from USD 1.79 billion to approximately USD 2.28 billion, representing a cumulative increase of USD 493 million accounting for nearly 37% of the total decade-long value growth. This initial phase of expansion is expected to be shaped by growing clinical recognition of berberine’s metabolic efficacy and its integration into emerging wellness protocols.

Demand is anticipated to be strengthened by rising consumer preference for non-pharmaceutical interventions across blood sugar and lipid management, supported by consistent uptake in personalized supplement delivery formats. Greater emphasis on bioavailability optimization is forecasted to shift innovation toward novel formulation technologies, especially within experiential wellness categories.

From 2030 to 2035, a sharper acceleration is projected, with the market expected to grow from USD 2.28 billion to nearly USD 3.12 billion, adding USD 844 million equivalent to 63% of total projected growth over the decade.

This latter growth phase is likely to be underpinned by the mainstreaming of multi-functional combination products, growing traction across direct-to-consumer (DTC) and e-commerce-led nutraceutical platforms, and expanded applications in cardiovascular and weight management routines. By 2035, next-generation berberine salts are anticipated to emerge as key differentiators in the competitive landscape, driven by superior absorption kinetics and alignment with clinical personalization trends.

Between 2020 and 2024, the global berberine market was observed to have expanded considerably, with total value rising from below USD 1.4 billion to approximately USD 1.7 billion. This growth was primarily attributed to heightened consumer awareness of plant-based metabolic health solutions, especially in response to the global uptick in lifestyle-related chronic conditions.

A significant portion of this expansion was driven by the widespread adoption of capsule-based formulations, valued for their dosing precision, stability, and clinical familiarity. The Asia-Pacific and North American regions were identified as key contributors to this phase of market growth. During this period, Chinese ingredient manufacturers captured a commanding share of the supply landscape, owing to their direct access to botanical raw materials and adherence to standardized extract protocols.

As the market transitions into 2025, demand is projected to reach USD 1.79 billion, supported by increased adoption of bioavailability-enhanced berberine formulations, the growing popularity of combination nutraceuticals, and the rapid rise of direct-to-consumer (DTC) wellness platforms. Competitive differentiation is expected to pivot toward fully integrated solutions where delivery innovation, digital engagement strategies, and practitioner-led protocols converge.

Market share is anticipated to be consolidated among companies that prioritize clinical validation, supply chain transparency, and multi-channel distribution strategies, as the industry moves from a commodity-based supply model toward value-centric, personalized health interventions.

Why the Berberine Market is growing?

The global berberine market is being driven by sustained growth, as rising consumer awareness around natural health solutions for chronic conditions such as type 2 diabetes, high cholesterol, and metabolic syndrome has been observed. Clinical studies supporting berberine’s efficacy in blood sugar and lipid regulation have allowed it to be positioned as a powerful botanical alternative to pharmaceutical interventions, especially within preventive health regimens.

Additionally, the expansion of the nutraceutical and functional foods sector has been accelerating demand for enhanced formulations such as bioavailability-boosted complexes (phytosome, cyclodextrin-based) and combination blends with other botanicals and nutraceuticals. Technological innovations in delivery formats like gummies, tinctures, and functional beverages have expanded appeal across diverse consumer segments.

Access to premium berberine products is being streamlined globally through online retail, direct-to-consumer brands, and practitioner-based channels. Furthermore, a broader shift towards plant-based therapeutics and clean-label supplements has been boosting the use of sources such as Goldenseal, Chinese Goldthread, and Oregon Grape. Through these trends, the long-term trajectory of the berberine market is being anchored in holistic wellness preferences and evidence-driven functional health applications.

Segmental Analysis

The global berberine market has been comprehensively segmented across multiple dimensions, including product format, chemical form, application, source, formulation type, and sales channel. This structure has been designed to reflect the diversity of berberine’s utilization across health and wellness sectors, where increasing demand for targeted metabolic support is being observed. In the area of product format, delivery innovations such as capsules, softgels, and gummies have been enabling improved compliance and consumer appeal.

From the perspective of chemical form, varying salt compositions such as hydrochloride, citrate, and sulfate have been shown to influence both bioavailability and formulation strategy. Within application categories, blood sugar regulation, lipid management, and weight control have continued to lead the landscape, driven by the widespread prevalence of metabolic disorders. Through this segmentation, critical insights into shifting demand dynamics, evolving growth levers, and innovation-led differentiation strategies are being provided across the global berberine value chain.
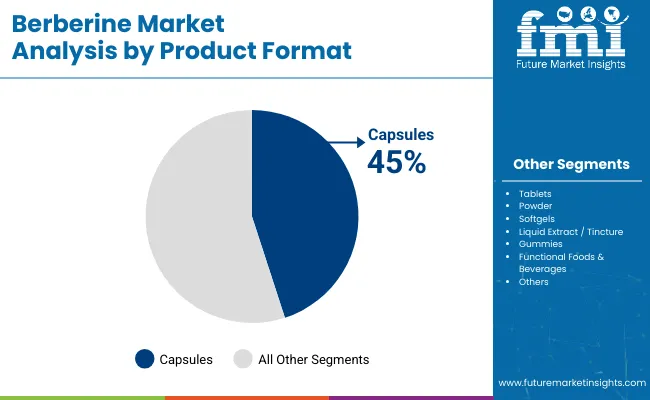
Insights into Product Format Segment with Capsules Leading Adoption

Berberine Market Analysis By Product Format

Product Format Format Market Share (%)
Capsules 45%
Tablets 20%
Powder 15%
Softgels 10%
Liquid Extract / Tincture 7%
Gummies 2%
Functional Foods & Beverages 1%

Capsules have been identified as the dominant product format in the global berberine market, contributing 45% of total market share in 2025. Their widespread use has been attributed to ease of formulation, precise dosage delivery, and high consumer trust across both clinical and OTC environments. Superior protection of berberine compounds from oxidation and stomach acid degradation has also been ensured through this format.

As demand increases for science-backed botanical interventions, capsule delivery is being maintained as the industry benchmark. Meanwhile, formats such as tinctures, gummies, and softgels are being adopted in experiential wellness niches, particularly within DTC and digital-first ecosystems. Powder-based delivery has also been favored for its adaptability in functional food innovations and custom supplement blends, underscoring broader shifts toward formulation flexibility and personalized nutrition.
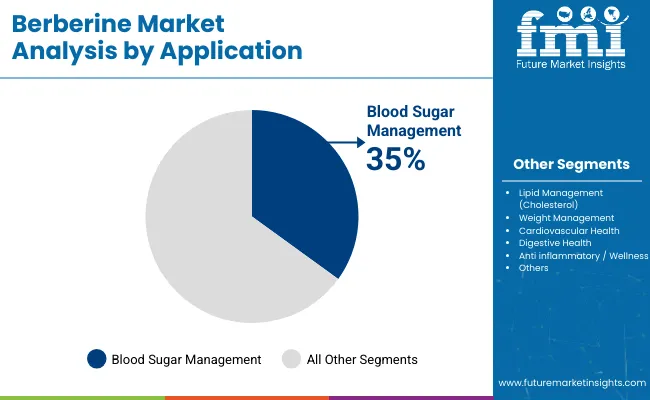
Insights into Application Segment with Blood Sugar Management Dominating Usage

Berberine Market Analysis By Application

Application Market Share (%)
Blood Sugar Management 35%
Lipid Management (Cholesterol) 25%
Weight Management 20%
Cardiovascular Health 10%
Digestive Health 5%
Anti inflammatory / Wellness 5%

Blood sugar management has been recognized as the leading application in the global berberine market, accounting for 35% of total application share in 2025. Berberine’s role as an insulin-sensitizing and glucose-lowering agent has been increasingly adopted by pre-diabetic and diabetic populations as a complementary solution. This positioning has been reinforced by a growing volume of clinical literature supporting its therapeutic efficacy. Applications in lipid regulation and weight management have also been expanding, driven by rising demand for multi-functional metabolic health interventions.

In parallel, cardiovascular and anti-inflammatory use cases are being explored more actively, particularly among aging consumer segments and those pursuing preventive wellness strategies. With chronic disease burdens rising globally and preference shifting toward botanical, low-side-effect options, demand across all core application areas is expected to be sustained, while therapeutic diversification continues to shape product innovation and market segmentation.
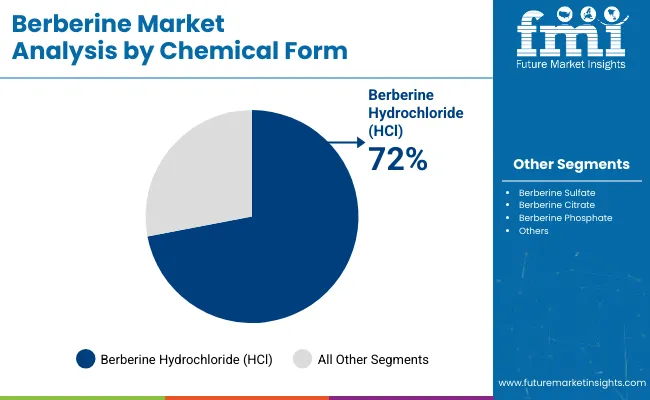
Insights into Chemical Form Segment with Berberine HCl Dominating Supply

Berberine Market Analysis By Chemical Form

Chemical Form 2025 Market Share (%)
Berberine Hydrochloride ( HCl ) 72%
Berberine Sulfate 12%
Berberine Citrate 7%
Berberine Phosphate 5%
Other Berberine Salts 4%

Berberine Hydrochloride (HCl) has been identified as the most commercially dominant chemical form, comprising 72% of the global market in 2025. Its strong performance has been attributed to high bioavailability, chemical stability, and broad regulatory acceptance across major markets. This form has been widely used in both standalone supplements and blended nutraceuticals due to its favorable pharmacokinetic profile and compatibility with multiple delivery formats.

Meanwhile, alternative salts such as berberine citrate and berberine sulfate have been gaining interest, particularly for their potential to enhance absorption and drive novel combinations in metabolic formulations. “Other berberine salts” are projected to register a CAGR exceeding 9.5%, reflecting robust innovation pipelines focused on improved absorption, differentiated dosing profiles, and premium product positioning. These shifts in formulation preferences are expected to support greater personalization and performance-driven product segmentation in the years ahead.

What are the Drivers, Restraints, and Key Trends of the Berberine Market?

Limited bioavailability and lack of standardized dosing challenge berberine adoption, even as demand surges across metabolic health, cardiovascular care, and clean-label supplements, driven by rising lifestyle disorders and growing interest in plant-based, clinically validated nutraceutical alternatives.

Clinical Legitimacy and Therapeutic Diversification Are Reshaping Berberine’s Competitive Profile

A growing body of human clinical trials is enabling berberine to be positioned beyond traditional herbal use, accelerating its inclusion in practitioner-grade and evidence-based supplement protocols. As of 2025, over 100 published studies have evaluated berberine’s effects on glycemic control, lipid profiles, and metabolic syndrome markers.

This clinical validation is being increasingly cited by DTC brands and functional medicine practitioners to differentiate their offerings and justify premium pricing. Moreover, therapeutic diversification is unfolding rapidly berberine is now being studied in adjunct protocols for PCOS, gut microbiota modulation, and neuroinflammation, expanding its addressable market.

Regulatory scrutiny, such as EFSA’s 2025 Article 8 safety evaluation, is also prompting standardized dosage frameworks, which will ultimately improve physician confidence and support OTC expansion in Europe. These dynamics are solidifying berberine’s transition from a niche botanical to a clinically substantiated nutraceutical platform ingredient.

Supply-Side Vulnerability and Adulteration Risks Threaten Brand Trust and Ingredient Integrity

Despite rising demand, the global berberine supply chain remains heavily concentrated in select provinces of China and parts of India, where wild harvesting of key plant sources exposes the market to climate shocks, yield inconsistency, and biodiversity degradation. As demand has outpaced sustainable sourcing, instances of adulteration and mislabeling have increased particularly in the online retail environment.

In December 2023, NOW Foods’ market surveillance revealed that over 50% of berberine supplements purchased via Amazon and Walmart contained less than 50% of the labeled dosage, raising serious concerns over quality assurance. Such findings are eroding consumer and practitioner trust, especially among premium buyers who rely on verified potency.

Brands that fail to demonstrate third-party testing, traceability, and ingredient origin transparency are likely to lose market share. Moving forward, sustainable cultivation, vertical integration, and DNA-based authentication technologies will be critical in mitigating supply-side risk and reinforcing market credibility.
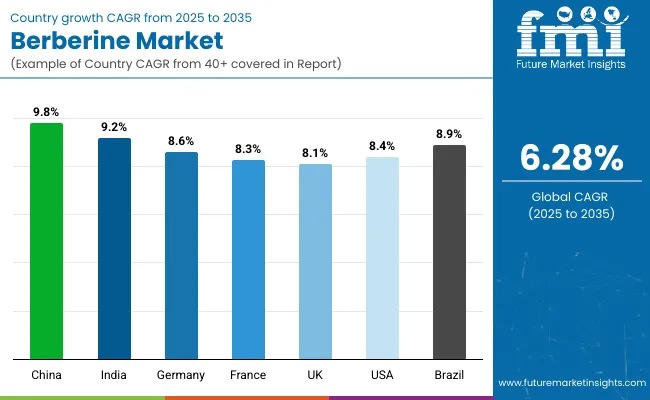
Analysis of Berberine Market By Key Countries

Country Wise Analysis Of Berberine Market

Countries CAGR
China 9.80%
India 9.20%
Germany 8.60%
France 8.30%
UK 8.10%
USA 8.40%
Brazil 8.90%

The global berberine market has demonstrated pronounced regional divergence in growth momentum, shaped by disparities in healthcare infrastructure, regulatory pathways, and integration of traditional medicine systems. The Asia-Pacific region has been identified as the fastest-growing, led by China (9.80% CAGR) and India (9.20%), where berberine is deeply embedded in Traditional Chinese Medicine (TCM) and Ayurvedic practices, respectively.

In China, this growth has been supported by widespread cultivation of Coptischinensis and Phellodendronamurense, combined with the strength of domestic nutraceutical manufacturing and distribution networks. India’s momentum has been attributed to the proliferation of Ayurvedic formulations, rising practitioner-led recommendations, and e-commerce-enabled access to metabolic health supplements in urban centers.

In Latin America, demand has been expanding rapidly, with Brazil (8.90%) emerging as a key contributor, supported by growing interest in botanical alternatives and the scaling of retail health chains focused on functional wellness. In Europe, countries such as Germany (8.60%), France (8.30%), and the UK (8.10%) have been driving growth through cardiometabolic wellness initiatives and increased regulatory scrutiny favoring clean-label, clinically supported supplements.

In the United States (8.40%), market expansion has been propelled by the rise of direct-to-consumer (DTC) brands, functional medicine integration, and consumer education around bioavailability-enhanced berberine. Regulatory stability and clinical substantiation continue to support berberine’s mainstream adoption across North America.

Sales Outlook for Berberine in the United States

Year USA Berberine Market (USD Million)
2025 350
2026 379
2027 411
2028 445
2029 482
2030 522
2031 565
2032 612
2033 663
2034 663
2035 779

The berberine market in the United States is projected to expand at a CAGR of 8.40% between 2025 and 2035, supported by growing adoption across personalized nutrition protocols, cardiometabolic health applications, and a rapidly evolving direct-to-consumer (DTC) landscape.

Clinical usage has been steadily increasing, particularly within functional medicine and integrative care settings, where berberine is being recommended for blood glucose regulation, lipid balance, and weight management. Formulations incorporating bioavailability-enhanced technologies, such as phytosome and liposomal delivery systems, are being deployed to improve compliance, particularly among aging consumers and health-conscious millennials.

  • Market penetration is being driven by DTC brands utilizing influencer-led education and subscription-based models.
  • Recommendations by naturopaths and integrative practitioners for cardiovascular and metabolic support have been expanding.
  • Liposomal and cyclodextrin-based berberine formats are being prioritized in practitioner-focused and e-commerce channels.
  • Formulations combining berberine with inositol, chromium, or milk thistle are broadening therapeutic application scopes.
  • A shift toward vegan, gluten-free, and allergen-free formats is being fueled by rising clean-label demand among USA consumers.

Growth and Expansion Outlook for Berberine Market in the United Kingdom

The berberine market in the United Kingdom is forecasted to expand at a CAGR of 8.10% between 2025 and 2035, supported by rising consumer preference for plant-based interventions targeting metabolic and cardiovascular health.

Growth has been further enabled by the UK’s advanced regulatory landscape, which has encouraged the adoption of clean-label, clinically validated supplements, including standardized berberine extracts. E-commerce platforms and specialty health retailers have been established as leading distribution channels, with elevated demand observed for vegan, gluten-free, and allergen-free product formats. Notable momentum has been recorded in combination products addressing multi-functional concerns such as cholesterol management, blood sugar control, and inflammation.

  • Berberine is being increasingly recommended through pharmacist-led supplement channels for cardiometabolic applications.
  • Enhanced bioavailability formats are being adopted by premium consumer segments seeking clinical-grade performance.
  • Rising NHS wait times have prompted a shift toward self-directed wellness, driving OTC botanical supplement demand.

In-depth Analysis of Berberine in Europe

Countries 2025 Market Share (%)
UK 12%
Germany 18%
Italy 10%
France 14%
Spain 8%
BENELUX 7%
Nordic 6%
Rest of Europe 25%
Countries 2035 Market Share (%)
UK 13%
Germany 17%
Italy 10%
France 14%
Spain 9%
BENELUX 7%
Nordic 7%
Rest of Europe 23%

Sales Outlook for Berberine in India

The berberine market in India is projected to expand at a CAGR of 9.20% between 2025 and 2035, supported by the country’s increasing diabetes prevalence and deep-rooted cultural orientation toward plant-based therapeutic systems. Berberine has been progressively integrated into Ayurvedic and polyherbal formulations, gaining acceptance across both modern clinical settings and traditional healthcare practices.

Domestic nutraceutical brands have been addressing demand through retail pharmacy chains, digital health platforms, and direct-to-consumer wellness kits. High adoption has been particularly observed among urban middle-class populations, where blood sugar and weight control remain top health concerns.

  • Practitioner endorsement in integrative and Ayurvedic clinics has been accelerating product acceptance.
  • Innovation in functional blends combining berberine with turmeric, fenugreek, and ashwagandha has been prioritized by Indian firms.
  • E-commerce-led awareness, driven by health influencers and vernacular outreach, has been expanding consumer access and education.

Sales Outlook for Berberine in China

China’s berberine market is projected to expand at a CAGR of 9.80% between 2025 and 2035, positioning it as the fastest-growing national market worldwide. Berberine has been long established within Traditional Chinese Medicine (TCM) and is widely acknowledged for its efficacy in managing digestive and metabolic disorders.

Current demand is being driven by both historical usage patterns and the rise of modern supplement innovations, particularly in capsules, tinctures, and bioavailability-enhanced delivery systems. Strong regulatory support for evidence-backed botanical actives, coupled with China’s robust domestic production infrastructure, has enabled the country to operate as a self-sufficient and globally competitive supplier.

  • Long-term demand is being reinforced by TCM’s integration into formal healthcare systems.
  • Functional beverages, powders, and combination formats are being launched by domestic nutraceutical firms.
  • Offline distribution is led by pharmacy chains and TCM clinics, while cross-border e-commerce is expanding market reach into Southeast Asia.

Growth Outlook for Berberine Market in Japan

Application Segment Japan Market Share, 2025
Blood Sugar Management 38%
Lipid Management (Cholesterol) 24%
Weight Management 15%
Cardiovascular Health 10%
Digestive Health 7%
Anti inflammatory / Wellness 6%

The berberine market in Japan is projected to reach approximately USD 123.16 million in 2025, with demand primarily concentrated in blood sugar management (38%) and lipid regulation (24%), together comprising over 60% of total national consumption.

This demand has been largely driven by Japan’s aging population and the growing prevalence of metabolic syndrome, both of which have increased interest in clinically validated botanical interventions. Berberine’s incorporation into self-medication products and over-the-counter (OTC) supplements has been aligned with widespread consumer preference for non-pharmaceutical health solutions.

Further support has been provided by Japan’s longstanding preference for precision-formulated supplements, particularly capsules and softgels, which are often backed by clinical documentation. Regulatory clarity surrounding botanical ingredients and a well-developed retail pharmacy network have helped to reinforce product accessibility and consumer confidence. Additionally, local formulators have been leveraging berberine in combination with CoQ10 and curcumin, extending its utility in cardiovascular and anti-inflammatory applications.

  • Japan accounts for 7.25% of the global market in 2025
  • Blood sugar and lipid management dominate with 62% combined share
  • Growth driven by aging population, OTC adoption, and clinical format innovation

Opportunity Analysis of South Korea Berberine Market

Chemical Form South Korea Market Share, 2025
Berberine Hydrochloride ( HCl ) 70%
Berberine Sulfate 12%
Berberine Citrate 8%
Berberine Phosphate 6%
Other Berberine Salts 4%

The berberine market in South Korea is projected to reach approximately USD 85.27 million in 2025, contributing an estimated 5.02% to the global market. Market leadership is held by Berberine Hydrochloride (HCl), which commands 70% of national consumption, attributed to its cost efficiency, stability, and broad acceptance among formulators. However, increasing interest in berberine citrate and sulfate has been observed, driven by growing emphasis on absorption enhancement and product differentiation.

The South Korean market has been shaped by a robust nutraceutical R&D ecosystem and high consumer receptivity to biofunctional ingredients. Domestic brands have been actively developing combination formulations that integrate berberine with ingredients such as ginseng, milk thistle, and probiotics, targeting digestive and metabolic health. The growth of retail pharmacy networks and the expansion of cross-border e-commerce with Japan and Southeast Asia have been instrumental in amplifying berberine’s regional footprint.
  • South Korea holds 5.02% of global market in 2025
  • HCl form dominates, but alternative salts are gaining innovation share
  • Growth supported by R&D-driven formulation and export-oriented nutraceutical production

Competitive Landscape of Berberine Market

Berberine Market Analysis By Company

Company Global Value Share 2025
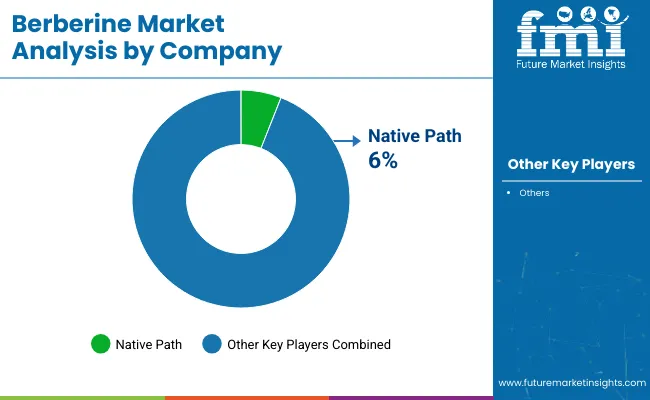
Native Path 6%
Others 94%

The global berberine market has been characterized as moderately fragmented, with competition occurring across botanical sourcing, formulation advancement, and consumer-focused innovation. Dominance in ingredient supply has been primarily maintained by Chinese bulk extractors such as Sichuan Benepure Pharm, Chengdu Chenlv Biological Tech, and Sunriver Biotech, owing to their access to high-yield botanical sources and production capacity for berberine hydrochloride and emerging salts. These firms have been recognized for ensuring pharma-grade quality, international regulatory certifications (USP, EP, GMP), and readiness for global functional and pharmaceutical markets.

Mid-sized Indian contract manufacturers, including Alpspure Lifesciences, Quad Lifesciences, and Inga Pharmaceuticals, have been focused on delivering customized formulations, incorporating berberine with complementary botanicals or nutraceutical co-actives. Growth in this segment has been supported by clean-label compliance, regional botanical integration, and private-label partnerships with international supplement brands.

Western nutraceutical brands such as NativePath and Science Natural Supplements have led the DTC segment, using e-commerce, personalization tools, and subscription models to reach health-conscious consumers. Competitive differentiation has been shifting from raw purity and cost efficiency toward bioavailability enhancement, clinical substantiation, and condition-specific claims (e.g., glucose, lipids, inflammation). Future market leadership is expected to rely on scientific delivery systems, clinical trials, and omnichannel retail strategies.

Key Developments in Berberine Market

  • In March 2025, Verywell Health published a widely circulated article warning that although berberine is being touted as a natural alternative to GLP‑1 drugs like Ozempic, scientific experts confirmed it works via AMPK not GLP‑1 pathways and its weight‑loss efficacy remains unproven.
  • In January 2025, the European Food Safety Authority (EFSA) announced it is advancing a safety assessment of berberine-containing supplement ingredients under Article 8 procedures, a critical step toward establishing tolerable daily intake thresholds and harmonizing EU regulatory standards.

Scope of the Report

Item Value
Quantitative Units USD 1.79 Billion
Source Barberry (Berberis vulgaris), Goldenseal (Hydrastis canadensis), Oregon Grape (Mahonia aquifolium), Chinese Goldthread (Coptis chinensis), Tree Turmeric (Berberis aristata), Phellodendron Bark (Phellodendron amurense), Others
Chemical Form Berberine Hydrochloride ( HCl ), Berberine Sulfate, Berberine Citrate, Berberine Phosphate, Other Berberine Salts
Formulation Type Standard Extract, Enhanced Bioavailability Complex (Phytosome, Cyclodextrin, Liposomal), Combination Formulas (With Botanicals, With Nutraceuticals)
Product Format Capsules, Tablets, Softgels, Powder, Liquid Extract / Tincture, Gummies, Functional Foods & Beverages
Application Blood Sugar Management, Lipid Management (Cholesterol, Triglycerides), Weight Management, Cardiovascular Health, Digestive Health, Anti-inflammatory / General Wellness
Sales Channels Pharmacies & Drugstores, Health & Nutrition Stores, Online Retail, Direct-to-Consumer (DTC) Brands, Mass Market Retailers, Practitioner / Clinic Distribution
Regions Covered North America, Europe, Asia-Pacific, Latin America, Middle East & Africa
Countries Covered United States, Canada, Germany, France, United Kingdom, China, Japan, India, Brazil, South Korea

Key Segmentation

By Source:

  • Barberry (Berberis vulgaris)
  • Goldenseal (Hydrastis canadensis)
  • Oregon Grape (Mahonia aquifolium)
  • Chinese Goldthread (Coptis chinensis)
  • Tree Turmeric (Berberis aristata)
  • Phellodendron Bark (Phellodendron amurense)
  • Others

By Chemical Form:

  • Hydrochloride (HCl)
  • Sulfate
  • Citrate
  • Phosphate
  • Other Salts

By Formulation Type:

  • Standard Extract
  • Enhanced Bioavailability Complex (Phytosome, Cyclodextrin, Liposomal)
    • Phytosome
    • Cyclodextrin
    • Liposomal
  • Combination Formulas (With Botanicals, With Nutraceuticals)
    • With Botanicals
    • With Nutraceuticals

By Product Format:

  • Capsules
  • Tablets
  • Softgels
  • Powder
  • Liquid Extract/Tincture
  • Gummies
  • Functional Foods & Beverages\

By Application:

  • Blood Sugar Management
  • Lipid Management (Cholesterol, Triglycerides)
    • Cholesterol
    • Triglycerides
  • Weight Management
  • Cardiovascular Health
  • Digestive Health
  • Anti-inflammatory/General Wellness

By Sales Channel:

  • Pharmacies & Drugstores
  • Health & Nutrition Stores
  • Online Retail
  • Direct-to-Consumer (DTC) Brands
  • Mass Market Retailers
  • Practitioner/Clinic Distribution

By Region:

  • North America
  • Latin America
  • Europe
  • East Asia
  • South Asia & Pacific
  • MEA

Table of Content

  1. Executive Summary
    • Global Market Outlook
    • Demand-side Trends
    • Supply-side Trends
    • Technology Roadmap Analysis
    • Analysis and Recommendations
  2. Market Overview
    • Market Coverage / Taxonomy
    • Market Definition / Scope / Limitations
  3. Market Background
    • Market Dynamics
      • Drivers
      • Restraints
      • Opportunity
      • Trends
    • Scenario Forecast
      • Demand in Optimistic Scenario
      • Demand in Likely Scenario
      • Demand in Conservative Scenario
    • Opportunity Map Analysis
    • Product Life Cycle Analysis
    • Supply Chain Analysis
      • Supply Side Participants and their Roles
        • Producers
        • Mid-Level Participants (Traders/ Agents/ Brokers)
        • Wholesalers and Distributors
      • Value Added and Value Created at Node in the Supply Chain
      • List of Raw Material Suppliers
      • List of Existing and Potential Buyer’s
    • Investment Feasibility Matrix
    • Value Chain Analysis
      • Profit Margin Analysis
      • Wholesalers and Distributors
      • Retailers
    • PESTLE and Porter’s Analysis
    • Regulatory Landscape
      • By Key Regions
      • By Key Countries
    • Regional Parent Market Outlook
    • Production and Consumption Statistics
    • Import and Export Statistics
  4. Global Market Analysis 2020 to 2024 and Forecast, 2025 to 2035
    • Historical Market Size Value (USD Million) & Volume (Units) Analysis, 2020 to 2024
    • Current and Future Market Size Value (USD Million) & Volume (Units) Projections, 2025 to 2035
      • Y-o-Y Growth Trend Analysis
      • Absolute $ Opportunity Analysis
  5. Global Market Analysis 2020 to 2024 and Forecast 2025 to 2035, By Source
    • Introduction / Key Findings
    • Historical Market Size Value (USD Million) & Volume (Units) Analysis By Source, 2020 to 2024
    • Current and Future Market Size Value (USD Million) & Volume (Units) Analysis and Forecast By Source, 2025 to 2035
      • Barberry (Berberis vulgaris)
      • Goldenseal (Hydrastis canadensis)
      • Oregon Grape (Mahonia aquifolium)
      • Chinese Goldthread (Coptis chinensis)
      • Tree Turmeric (Berberis aristata)
      • Phellodendron Bark (Phellodendron amurense)
      • Others
    • Y-o-Y Growth Trend Analysis By Source, 2020 to 2024
    • Absolute $ Opportunity Analysis By Source, 2025 to 2035
  6. Global Market Analysis 2020 to 2024 and Forecast 2025 to 2035, By Chemical Form
    • Introduction / Key Findings
    • Historical Market Size Value (USD Million) & Volume (Units) Analysis By Chemical Form, 2020 to 2024
    • Current and Future Market Size Value (USD Million) & Volume (Units) Analysis and Forecast By Chemical Form, 2025 to 2035
      • Hydrochloride (HCl)
      • Sulfate
      • Citrate
      • Phosphate
      • Other Salts
    • Y-o-Y Growth Trend Analysis By Chemical Form, 2020 to 2024
    • Absolute $ Opportunity Analysis By Chemical Form, 2025 to 2035
  7. Global Market Analysis 2020 to 2024 and Forecast 2025 to 2035, By Formulation Type
    • Introduction / Key Findings
    • Historical Market Size Value (USD Million) & Volume (Units) Analysis By Formulation Type, 2020 to 2024
    • Current and Future Market Size Value (USD Million) & Volume (Units) Analysis and Forecast By Formulation Type, 2025 to 2035
      • Standard Extract
      • Enhanced Bioavailability Complex (Phytosome, Cyclodextrin, Liposomal)
        • Phytosome
        • Cyclodextrin
        • Liposomal
      • Combination Formulas (With Botanicals, With Nutraceuticals)
        • With Botanicals
        • With Nutraceuticals
    • Y-o-Y Growth Trend Analysis By Formulation Type, 2020 to 2024
    • Absolute $ Opportunity Analysis By Formulation Type, 2025 to 2035
  8. Global Market Analysis 2020 to 2024 and Forecast 2025 to 2035, By Product Format
    • Introduction / Key Findings
    • Historical Market Size Value (USD Million) & Volume (Units) Analysis By Product Format, 2020 to 2024
    • Current and Future Market Size Value (USD Million) & Volume (Units) Analysis and Forecast By Product Format, 2025 to 2035
      • Capsules
      • Tablets
      • Softgels
      • Powder
      • Liquid Extract / Tincture
      • Gummies
      • Functional Foods & Beverages
    • Y-o-Y Growth Trend Analysis By Product Format, 2020 to 2024
    • Absolute $ Opportunity Analysis By Product Format, 2025 to 2035
  9. Global Market Analysis 2020 to 2024 and Forecast 2025 to 2035, By Application
    • Introduction / Key Findings
    • Historical Market Size Value (USD Million) & Volume (Units) Analysis By Application, 2020 to 2024
    • Current and Future Market Size Value (USD Million) & Volume (Units) Analysis and Forecast By Application, 2025 to 2035
      • Blood Sugar Management
      • Lipid Management (Cholesterol, Triglycerides)
        • Cholesterol
        • Triglycerides
      • Weight Management
      • Cardiovascular Health
      • Digestive Health
      • Anti-inflammatory / General Wellness
    • Y-o-Y Growth Trend Analysis By Application, 2020 to 2024
    • Absolute $ Opportunity Analysis By Application, 2025 to 2035
  10. Global Market Analysis 2020 to 2024 and Forecast 2025 to 2035, By Sales Channel
    • Introduction / Key Findings
    • Historical Market Size Value (USD Million) & Volume (Units) Analysis By Sales Channel, 2020 to 2024
    • Current and Future Market Size Value (USD Million) & Volume (Units) Analysis and Forecast By Sales Channel, 2025 to 2035
      • Pharmacies & Drugstores
      • Health & Nutrition Stores
      • Online Retail
      • Direct-to-Consumer (DTC) Brands
      • Mass Market Retailers
      • Practitioner / Clinic Distribution
    • Y-o-Y Growth Trend Analysis By Sales Channel, 2020 to 2024
    • Absolute $ Opportunity Analysis By Sales Channel, 2025 to 2035
  11. Global Market Analysis 2020 to 2024 and Forecast 2025 to 2035, By Region
    • Introduction
    • Historical Market Size Value (USD Million) & Volume (Units) Analysis By Region, 2020 to 2024
    • Current Market Size Value (USD Million) & Volume (Units) Analysis and Forecast By Region, 2025 to 2035
      • North America
      • Latin America
      • Europe
      • East Asia
      • South Asia & Pacific
      • MEA
    • Market Attractiveness Analysis By Region
  12. North America Market Analysis 2020 to 2024 and Forecast 2025 to 2035, By Country
    • Historical Market Size Value (USD Million) & Volume (Units) Trend Analysis By Market Taxonomy, 2020 to 2024
    • Market Size Value (USD Million) & Volume (Units) Forecast By Market Taxonomy, 2025 to 2035
      • By Country
        • USA
        • Canada
      • By Source
      • By Chemical Form
      • By Formulation Type
      • By Product Format
      • By Application
      • By Sales Channel
    • Market Attractiveness Analysis
      • By Country
      • By Source
      • By Chemical Form
      • By Formulation Type
      • By Product Format
      • By Application
      • By Sales Channel
    • Key Takeaways
  13. Latin America Market Analysis 2020 to 2024 and Forecast 2025 to 2035, By Country
    • Historical Market Size Value (USD Million) & Volume (Units) Trend Analysis By Market Taxonomy, 2020 to 2024
    • Market Size Value (USD Million) & Volume (Units) Forecast By Market Taxonomy, 2025 to 2035
      • By Country
        • Brazil
        • Mexico
        • Colombia
        • Rest of Latin America
      • By Source
      • By Chemical Form
      • By Formulation Type
      • By Product Format
      • By Application
      • By Sales Channel
    • Market Attractiveness Analysis
      • By Country
      • By Source
      • By Chemical Form
      • By Formulation Type
      • By Product Format
      • By Application
      • By Sales Channel
    • Key Takeaways
  14. Europe Market Analysis 2020 to 2024 and Forecast 2025 to 2035, By Country
    • Historical Market Size Value (USD Million) & Volume (Units) Trend Analysis By Market Taxonomy, 2020 to 2024
    • Market Size Value (USD Million) & Volume (Units) Forecast By Market Taxonomy, 2025 to 2035
      • By Country
        • Germany
        • UK
        • France
        • Italy
        • Spain
        • Belgium
        • Netherlands
        • Nordic
        • Switzerland
        • Russia
        • Poland
        • Rest of Europe
      • By Source
      • By Chemical Form
      • By Formulation Type
      • By Product Format
      • By Application
      • By Sales Channel
    • Market Attractiveness Analysis
      • By Country
      • By Source
      • By Chemical Form
      • By Formulation Type
      • By Product Format
      • By Application
      • By Sales Channel
    • Key Takeaways
  15. East Asia Market Analysis 2020 to 2024 and Forecast 2025 to 2035, By Country
    • Historical Market Size Value (USD Million) & Volume (Units) Trend Analysis By Market Taxonomy, 2020 to 2024
    • Market Size Value (USD Million) & Volume (Units) Forecast By Market Taxonomy, 2025 to 2035
      • By Country
        • China
        • Japan
        • South Korea
      • By Source
      • By Chemical Form
      • By Formulation Type
      • By Product Format
      • By Application
      • By Sales Channel
    • Market Attractiveness Analysis
      • By Country
      • By Source
      • By Chemical Form
      • By Formulation Type
      • By Product Format
      • By Application
      • By Sales Channel
    • Key Takeaways
  16. South Asia & Pacific Market Analysis 2020 to 2024 and Forecast 2025 to 2035, By Country
    • Historical Market Size Value (USD Million) & Volume (Units) Trend Analysis By Market Taxonomy, 2020 to 2024
    • Market Size Value (USD Million) & Volume (Units) Forecast By Market Taxonomy, 2025 to 2035
      • By Country
        • India
        • Thailand
        • Malaysia
        • Indonesia
        • Singapore
        • Vietnam
        • Australia
        • New Zealand
        • Rest of South Asia
      • By Source
      • By Chemical Form
      • By Formulation Type
      • By Product Format
      • By Application
      • By Sales Channel
    • Market Attractiveness Analysis
      • By Country
      • By Source
      • By Chemical Form
      • By Formulation Type
      • By Product Format
      • By Application
      • By Sales Channel
    • Key Takeaways
  17. MEA Market Analysis 2020 to 2024 and Forecast 2025 to 2035, By Country
    • Historical Market Size Value (USD Million) & Volume (Units) Trend Analysis By Market Taxonomy, 2020 to 2024
    • Market Size Value (USD Million) & Volume (Units) Forecast By Market Taxonomy, 2025 to 2035
      • By Country
        • Turkey
        • UAE
        • Saudi Arabia
        • Israel
        • Other GCC Countries
        • North Africa
        • South Africa
        • Central Africa
        • Rest of MEA
      • By Source
      • By Chemical Form
      • By Formulation Type
      • By Product Format
      • By Application
      • By Sales Channel
    • Market Attractiveness Analysis
      • By Country
      • By Source
      • By Chemical Form
      • By Formulation Type
      • By Product Format
      • By Application
      • By Sales Channel
    • Key Takeaways
  18. Key Countries Market Analysis
    • USA
      • Pricing Analysis
      • Market Share Analysis, 2024
        • By Source
        • By Chemical Form
        • By Formulation Type
        • By Product Format
        • By Application
        • By Sales Channel
    • Canada
      • Pricing Analysis
      • Market Share Analysis, 2024
        • By Source
        • By Chemical Form
        • By Formulation Type
        • By Product Format
        • By Application
        • By Sales Channel
    • Brazil
      • Pricing Analysis
      • Market Share Analysis, 2024
        • By Source
        • By Chemical Form
        • By Formulation Type
        • By Product Format
        • By Application
        • By Sales Channel
    • Mexico
      • Pricing Analysis
      • Market Share Analysis, 2024
        • By Source
        • By Chemical Form
        • By Formulation Type
        • By Product Format
        • By Application
        • By Sales Channel
    • Colombia
      • Pricing Analysis
      • Market Share Analysis, 2024
        • By Source
        • By Chemical Form
        • By Formulation Type
        • By Product Format
        • By Application
        • By Sales Channel
    • Germany
      • Pricing Analysis
      • Market Share Analysis, 2024
        • By Source
        • By Chemical Form
        • By Formulation Type
        • By Product Format
        • By Application
        • By Sales Channel
    • UK
      • Pricing Analysis
      • Market Share Analysis, 2024
        • By Source
        • By Chemical Form
        • By Formulation Type
        • By Product Format
        • By Application
        • By Sales Channel
    • France
      • Pricing Analysis
      • Market Share Analysis, 2024
        • By Source
        • By Chemical Form
        • By Formulation Type
        • By Product Format
        • By Application
        • By Sales Channel
    • Italy
      • Pricing Analysis
      • Market Share Analysis, 2024
        • By Source
        • By Chemical Form
        • By Formulation Type
        • By Product Format
        • By Application
        • By Sales Channel
    • Spain
      • Pricing Analysis
      • Market Share Analysis, 2024
        • By Source
        • By Chemical Form
        • By Formulation Type
        • By Product Format
        • By Application
        • By Sales Channel
    • Belgium
      • Pricing Analysis
      • Market Share Analysis, 2024
        • By Source
        • By Chemical Form
        • By Formulation Type
        • By Product Format
        • By Application
        • By Sales Channel
    • Netherlands
      • Pricing Analysis
      • Market Share Analysis, 2024
        • By Source
        • By Chemical Form
        • By Formulation Type
        • By Product Format
        • By Application
        • By Sales Channel
    • Nordic
      • Pricing Analysis
      • Market Share Analysis, 2024
        • By Source
        • By Chemical Form
        • By Formulation Type
        • By Product Format
        • By Application
        • By Sales Channel
    • Switzerland
      • Pricing Analysis
      • Market Share Analysis, 2024
        • By Source
        • By Chemical Form
        • By Formulation Type
        • By Product Format
        • By Application
        • By Sales Channel
    • Russia
      • Pricing Analysis
      • Market Share Analysis, 2024
        • By Source
        • By Chemical Form
        • By Formulation Type
        • By Product Format
        • By Application
        • By Sales Channel
    • Poland
      • Pricing Analysis
      • Market Share Analysis, 2024
        • By Source
        • By Chemical Form
        • By Formulation Type
        • By Product Format
        • By Application
        • By Sales Channel
    • China
      • Pricing Analysis
      • Market Share Analysis, 2024
        • By Source
        • By Chemical Form
        • By Formulation Type
        • By Product Format
        • By Application
        • By Sales Channel
    • Japan
      • Pricing Analysis
      • Market Share Analysis, 2024
        • By Source
        • By Chemical Form
        • By Formulation Type
        • By Product Format
        • By Application
        • By Sales Channel
    • South Korea
      • Pricing Analysis
      • Market Share Analysis, 2024
        • By Source
        • By Chemical Form
        • By Formulation Type
        • By Product Format
        • By Application
        • By Sales Channel
    • India
      • Pricing Analysis
      • Market Share Analysis, 2024
        • By Source
        • By Chemical Form
        • By Formulation Type
        • By Product Format
        • By Application
        • By Sales Channel
    • Thailand
      • Pricing Analysis
      • Market Share Analysis, 2024
        • By Source
        • By Chemical Form
        • By Formulation Type
        • By Product Format
        • By Application
        • By Sales Channel
    • Indonesia
      • Pricing Analysis
      • Market Share Analysis, 2024
        • By Source
        • By Chemical Form
        • By Formulation Type
        • By Product Format
        • By Application
        • By Sales Channel
    • Australia
      • Pricing Analysis
      • Market Share Analysis, 2024
        • By Source
        • By Chemical Form
        • By Formulation Type
        • By Product Format
        • By Application
        • By Sales Channel
    • New Zealand
      • Pricing Analysis
      • Market Share Analysis, 2024
        • By Source
        • By Chemical Form
        • By Formulation Type
        • By Product Format
        • By Application
        • By Sales Channel
    • Turkey
      • Pricing Analysis
      • Market Share Analysis, 2024
        • By Source
        • By Chemical Form
        • By Formulation Type
        • By Product Format
        • By Application
        • By Sales Channel
    • UAE
      • Pricing Analysis
      • Market Share Analysis, 2024
        • By Source
        • By Chemical Form
        • By Formulation Type
        • By Product Format
        • By Application
        • By Sales Channel
    • Saudi Arabia
      • Pricing Analysis
      • Market Share Analysis, 2024
        • By Source
        • By Chemical Form
        • By Formulation Type
        • By Product Format
        • By Application
        • By Sales Channel
    • Israel
      • Pricing Analysis
      • Market Share Analysis, 2024
        • By Source
        • By Chemical Form
        • By Formulation Type
        • By Product Format
        • By Application
        • By Sales Channel
    • North Africa
      • Pricing Analysis
      • Market Share Analysis, 2024
        • By Source
        • By Chemical Form
        • By Formulation Type
        • By Product Format
        • By Application
        • By Sales Channel
    • South Africa
      • Pricing Analysis
      • Market Share Analysis, 2024
        • By Source
        • By Chemical Form
        • By Formulation Type
        • By Product Format
        • By Application
        • By Sales Channel
  19. Market Structure Analysis
    • Competition Dashboard
    • Competition Benchmarking
    • Market Share Analysis of Top Players
      • By Regional
      • By Source
      • By Chemical Form
      • By Formulation Type
      • By Product Format
      • By Application
      • By Sales Channel
  20. Competition Analysis
    • Competition Deep Dive
      • Alpspure Lifesciences
        • Overview
        • Product Portfolio
        • Profitability by Market Segments (Product/Age /Sales Channel/Region)
        • Sales Footprint
        • Strategy Overview
          • Marketing Strategy
          • Product Strategy
          • Channel Strategy
      • Chengdu Chenlv Biological Tech
        • Overview
        • Product Portfolio
        • Profitability by Market Segments (Product/Age /Sales Channel/Region)
        • Sales Footprint
        • Strategy Overview
          • Marketing Strategy
          • Product Strategy
          • Channel Strategy
      • Inga Pharmaceuticals
        • Overview
        • Product Portfolio
        • Profitability by Market Segments (Product/Age /Sales Channel/Region)
        • Sales Footprint
        • Strategy Overview
          • Marketing Strategy
          • Product Strategy
          • Channel Strategy
      • Northeast Pharma Group
        • Overview
        • Product Portfolio
        • Profitability by Market Segments (Product/Age /Sales Channel/Region)
        • Sales Footprint
        • Strategy Overview
          • Marketing Strategy
          • Product Strategy
          • Channel Strategy
      • Quad Lifesciences
        • Overview
        • Product Portfolio
        • Profitability by Market Segments (Product/Age /Sales Channel/Region)
        • Sales Footprint
        • Strategy Overview
          • Marketing Strategy
          • Product Strategy
          • Channel Strategy
      • Sichuan Benepure Pharm
        • Overview
        • Product Portfolio
        • Profitability by Market Segments (Product/Age /Sales Channel/Region)
        • Sales Footprint
        • Strategy Overview
          • Marketing Strategy
          • Product Strategy
          • Channel Strategy
      • Sichuan Xieli Pharm
        • Overview
        • Product Portfolio
        • Profitability by Market Segments (Product/Age /Sales Channel/Region)
        • Sales Footprint
        • Strategy Overview
          • Marketing Strategy
          • Product Strategy
          • Channel Strategy
      • Sunriver Biotech
        • Overview
        • Product Portfolio
        • Profitability by Market Segments (Product/Age /Sales Channel/Region)
        • Sales Footprint
        • Strategy Overview
          • Marketing Strategy
          • Product Strategy
          • Channel Strategy
      • NativePath
        • Overview
        • Product Portfolio
        • Profitability by Market Segments (Product/Age /Sales Channel/Region)
        • Sales Footprint
        • Strategy Overview
          • Marketing Strategy
          • Product Strategy
          • Channel Strategy
      • Science Natural Supplements
        • Overview
        • Product Portfolio
        • Profitability by Market Segments (Product/Age /Sales Channel/Region)
        • Sales Footprint
        • Strategy Overview
          • Marketing Strategy
          • Product Strategy
          • Channel Strategy
      • Others
        • Overview
        • Product Portfolio
        • Profitability by Market Segments (Product/Age /Sales Channel/Region)
        • Sales Footprint
        • Strategy Overview
          • Marketing Strategy
          • Product Strategy
          • Channel Strategy
  21. Assumptions & Acronyms Used
  22. Research Methodology

List of Tables

  • Table 1: Global Market Value (USD Million) Forecast by Region, 2020-2035
  • Table 2: Global Market Volume (Units) Forecast by Region, 2020-2035
  • Table 3: Global Market Value (USD Million) Forecast By Source, 2020-2035
  • Table 4: Global Market Volume (Units) Forecast By Source, 2020-2035
  • Table 5: Global Market Value (USD Million) Forecast By Chemical Form, 2020-2035
  • Table 6: Global Market Volume (Units) Forecast By Chemical Form, 2020-2035
  • Table 7: Global Market Value (USD Million) Forecast By Formulation Type, 2020-2035
  • Table 8: Global Market Volume (Units) Forecast By Formulation Type, 2020-2035
  • Table 9: Global Market Value (USD Million) Forecast By Product Format, 2020-2035
  • Table 10: Global Market Volume (Units) Forecast By Product Format, 2020-2035
  • Table 11: Global Market Value (USD Million) Forecast By Application, 2020-2035
  • Table 12: Global Market Volume (Units) Forecast By Application, 2020-2035
  • Table 13: Global Market Value (USD Million) Forecast By Sales Channel, 2020-2035
  • Table 14: Global Market Volume (Units) Forecast By Sales Channel, 2020-2035
  • Table 15: North America Market Value (USD Million) Forecast by Country, 2020-2035
  • Table 16: North America Market Volume (Units) Forecast by Country, 2020-2035
  • Table 17: North America Market Value (USD Million) Forecast By Source, 2020-2035
  • Table 18: North America Market Volume (Units) Forecast By Source, 2020-2035
  • Table 19: North America Market Value (USD Million) Forecast By Chemical Form, 2020-2035
  • Table 20: North America Market Volume (Units) Forecast By Chemical Form, 2020-2035
  • Table 21: North America Market Value (USD Million) Forecast By Formulation Type, 2020-2035
  • Table 22: North America Market Volume (Units) Forecast By Formulation Type, 2020-2035
  • Table 23: North America Market Value (USD Million) Forecast By Product Format, 2020-2035
  • Table 24: North America Market Volume (Units) Forecast By Product Format, 2020-2035
  • Table 25: North America Market Value (USD Million) Forecast By Application, 2020-2035
  • Table 26: North America Market Volume (Units) Forecast By Application, 2020-2035
  • Table 27: North America Market Value (USD Million) Forecast By Sales Channel, 2020-2035
  • Table 28: North America Market Volume (Units) Forecast By Sales Channel, 2020-2035
  • Table 29: Latin America Market Value (USD Million) Forecast by Country, 2020-2035
  • Table 30: Latin America Market Volume (Units) Forecast by Country, 2020-2035
  • Table 31: Latin America Market Value (USD Million) Forecast By Source, 2020-2035
  • Table 32: Latin America Market Volume (Units) Forecast By Source, 2020-2035
  • Table 33: Latin America Market Value (USD Million) Forecast By Chemical Form, 2020-2035
  • Table 34: Latin America Market Volume (Units) Forecast By Chemical Form, 2020-2035
  • Table 35: Latin America Market Value (USD Million) Forecast By Formulation Type, 2020-2035
  • Table 36: Latin America Market Volume (Units) Forecast By Formulation Type, 2020-2035
  • Table 37: Latin America Market Value (USD Million) Forecast By Product Format, 2020-2035
  • Table 38: Latin America Market Volume (Units) Forecast By Product Format, 2020-2035
  • Table 39: Latin America Market Value (USD Million) Forecast By Application, 2020-2035
  • Table 40: Latin America Market Volume (Units) Forecast By Application, 2020-2035
  • Table 41: Latin America Market Value (USD Million) Forecast By Sales Channel, 2020-2035
  • Table 42: Latin America Market Volume (Units) Forecast By Sales Channel, 2020-2035
  • Table 43: Europe Market Value (USD Million) Forecast by Country, 2020-2035
  • Table 44: Europe Market Volume (Units) Forecast by Country, 2020-2035
  • Table 45: Europe Market Value (USD Million) Forecast By Source, 2020-2035
  • Table 46: Europe Market Volume (Units) Forecast By Source, 2020-2035
  • Table 47: Europe Market Value (USD Million) Forecast By Chemical Form, 2020-2035
  • Table 48: Europe Market Volume (Units) Forecast By Chemical Form, 2020-2035
  • Table 49: Europe Market Value (USD Million) Forecast By Formulation Type, 2020-2035
  • Table 50: Europe Market Volume (Units) Forecast By Formulation Type, 2020-2035
  • Table 51: Europe Market Value (USD Million) Forecast By Product Format, 2020-2035
  • Table 52: Europe Market Volume (Units) Forecast By Product Format, 2020-2035
  • Table 53: Europe Market Value (USD Million) Forecast By Application, 2020-2035
  • Table 54: Europe Market Volume (Units) Forecast By Application, 2020-2035
  • Table 55: Europe Market Value (USD Million) Forecast By Sales Channel, 2020-2035
  • Table 56: Europe Market Volume (Units) Forecast By Sales Channel, 2020-2035
  • Table 57: East Asia Market Value (USD Million) Forecast by Country, 2020-2035
  • Table 58: East Asia Market Volume (Units) Forecast by Country, 2020-2035
  • Table 59: East Asia Market Value (USD Million) Forecast By Source, 2020-2035
  • Table 60: East Asia Market Volume (Units) Forecast By Source, 2020-2035
  • Table 61: East Asia Market Value (USD Million) Forecast By Chemical Form, 2020-2035
  • Table 62: East Asia Market Volume (Units) Forecast By Chemical Form, 2020-2035
  • Table 63: East Asia Market Value (USD Million) Forecast By Formulation Type, 2020-2035
  • Table 64: East Asia Market Volume (Units) Forecast By Formulation Type, 2020-2035
  • Table 65: East Asia Market Value (USD Million) Forecast By Product Format, 2020-2035
  • Table 66: East Asia Market Volume (Units) Forecast By Product Format, 2020-2035
  • Table 67: East Asia Market Value (USD Million) Forecast By Application, 2020-2035
  • Table 68: East Asia Market Volume (Units) Forecast By Application, 2020-2035
  • Table 69: East Asia Market Value (USD Million) Forecast By Sales Channel, 2020-2035
  • Table 70: East Asia Market Volume (Units) Forecast By Sales Channel, 2020-2035
  • Table 71: South Asia & Pacific Market Value (USD Million) Forecast by Country, 2020-2035
  • Table 72: South Asia & Pacific Market Volume (Units) Forecast by Country, 2020-2035
  • Table 73: South Asia & Pacific Market Value (USD Million) Forecast By Source, 2020-2035
  • Table 74: South Asia & Pacific Market Volume (Units) Forecast By Source, 2020-2035
  • Table 75: South Asia & Pacific Market Value (USD Million) Forecast By Chemical Form, 2020-2035
  • Table 76: South Asia & Pacific Market Volume (Units) Forecast By Chemical Form, 2020-2035
  • Table 77: South Asia & Pacific Market Value (USD Million) Forecast By Formulation Type, 2020-2035
  • Table 78: South Asia & Pacific Market Volume (Units) Forecast By Formulation Type, 2020-2035
  • Table 79: South Asia & Pacific Market Value (USD Million) Forecast By Product Format, 2020-2035
  • Table 80: South Asia & Pacific Market Volume (Units) Forecast By Product Format, 2020-2035
  • Table 81: South Asia & Pacific Market Value (USD Million) Forecast By Application, 2020-2035
  • Table 82: South Asia & Pacific Market Volume (Units) Forecast By Application, 2020-2035
  • Table 83: South Asia & Pacific Market Value (USD Million) Forecast By Sales Channel, 2020-2035
  • Table 84: South Asia & Pacific Market Volume (Units) Forecast By Sales Channel, 2020-2035
  • Table 85: MEA Market Value (USD Million) Forecast by Country, 2020-2035
  • Table 86: MEA Market Volume (Units) Forecast by Country, 2020-2035
  • Table 87: MEA Market Value (USD Million) Forecast By Source, 2020-2035
  • Table 88: MEA Market Volume (Units) Forecast By Source, 2020-2035
  • Table 89: MEA Market Value (USD Million) Forecast By Chemical Form, 2020-2035
  • Table 90: MEA Market Volume (Units) Forecast By Chemical Form, 2020-2035
  • Table 91: MEA Market Value (USD Million) Forecast By Formulation Type, 2020-2035
  • Table 92: MEA Market Volume (Units) Forecast By Formulation Type, 2020-2035
  • Table 93: MEA Market Value (USD Million) Forecast By Product Format, 2020-2035
  • Table 94: MEA Market Volume (Units) Forecast By Product Format, 2020-2035
  • Table 95: MEA Market Value (USD Million) Forecast By Application, 2020-2035
  • Table 96: MEA Market Volume (Units) Forecast By Application, 2020-2035
  • Table 97: MEA Market Value (USD Million) Forecast By Sales Channel, 2020-2035
  • Table 98: MEA Market Volume (Units) Forecast By Sales Channel, 2020-2035

List of Figures

  • Figure 1: Global Market Value (USD Million) By Source, 2025-2035
  • Figure 2: Global Market Value (USD Million) By Chemical Form, 2025-2035
  • Figure 3: Global Market Value (USD Million) By Formulation Type, 2025-2035
  • Figure 4: Global Market Value (USD Million) By Product Format, 2025-2035
  • Figure 5: Global Market Value (USD Million) By Application, 2025-2035
  • Figure 6: Global Market Value (USD Million) By Sales Channel, 2025-2035
  • Figure 7: Global Market Value (USD Million) by Region, 2025-2035
  • Figure 8: Global Market Value (USD Million) Analysis by Region, 2020-2035
  • Figure 9: Global Market Volume (Units) Analysis by Region, 2020-2035
  • Figure 10: Global Market Value Share (%) and BPS Analysis by Region, 2025-2035
  • Figure 11: Global Market Y-o-Y Growth (%) Projections by Region, 2025-2035
  • Figure 12: Global Market Value (USD Million) Analysis By Source, 2020-2035
  • Figure 13: Global Market Volume (Units) Analysis By Source, 2020-2035
  • Figure 14: Global Market Value Share (%) and BPS Analysis By Source, 2025-2035
  • Figure 15: Global Market Y-o-Y Growth (%) Projections By Source, 2025-2035
  • Figure 16: Global Market Value (USD Million) Analysis By Chemical Form, 2020-2035
  • Figure 17: Global Market Volume (Units) Analysis By Chemical Form, 2020-2035
  • Figure 18: Global Market Value Share (%) and BPS Analysis By Chemical Form, 2025-2035
  • Figure 19: Global Market Y-o-Y Growth (%) Projections By Chemical Form, 2025-2035
  • Figure 20: Global Market Value (USD Million) Analysis By Formulation Type, 2020-2035
  • Figure 21: Global Market Volume (Units) Analysis By Formulation Type, 2020-2035
  • Figure 22: Global Market Value Share (%) and BPS Analysis By Formulation Type, 2025-2035
  • Figure 23: Global Market Y-o-Y Growth (%) Projections By Formulation Type, 2025-2035
  • Figure 24: Global Market Value (USD Million) Analysis By Product Format, 2020-2035
  • Figure 25: Global Market Volume (Units) Analysis By Product Format, 2020-2035
  • Figure 26: Global Market Value Share (%) and BPS Analysis By Product Format, 2025-2035
  • Figure 27: Global Market Y-o-Y Growth (%) Projections By Product Format, 2025-2035
  • Figure 28: Global Market Value (USD Million) Analysis By Application, 2020-2035
  • Figure 29: Global Market Volume (Units) Analysis By Application, 2020-2035
  • Figure 30: Global Market Value Share (%) and BPS Analysis By Application, 2025-2035
  • Figure 31: Global Market Y-o-Y Growth (%) Projections By Application, 2025-2035
  • Figure 32: Global Market Value (USD Million) Analysis By Sales Channel, 2020-2035
  • Figure 33: Global Market Volume (Units) Analysis By Sales Channel, 2020-2035
  • Figure 34: Global Market Value Share (%) and BPS Analysis By Sales Channel, 2025-2035
  • Figure 35: Global Market Y-o-Y Growth (%) Projections By Sales Channel, 2025-2035
  • Figure 36: Global Market Attractiveness By Source, 2025-2035
  • Figure 37: Global Market Attractiveness By Chemical Form, 2025-2035
  • Figure 38: Global Market Attractiveness By Formulation Type, 2025-2035
  • Figure 39: Global Market Attractiveness By Product Format, 2025-2035
  • Figure 40: Global Market Attractiveness By Application, 2025-2035
  • Figure 41: Global Market Attractiveness By Sales Channel, 2025-2035
  • Figure 42: Global Market Attractiveness by Region, 2025-2035
  • Figure 43: North America Market Value (USD Million) By Source, 2025-2035
  • Figure 44: North America Market Value (USD Million) By Chemical Form, 2025-2035
  • Figure 45: North America Market Value (USD Million) By Formulation Type, 2025-2035
  • Figure 46: North America Market Value (USD Million) By Product Format, 2025-2035
  • Figure 47: North America Market Value (USD Million) By Application, 2025-2035
  • Figure 48: North America Market Value (USD Million) By Sales Channel, 2025-2035
  • Figure 49: North America Market Value (USD Million) by Country, 2025-2035
  • Figure 50: North America Market Value (USD Million) Analysis by Country, 2020-2035
  • Figure 51: North America Market Volume (Units) Analysis by Country, 2020-2035
  • Figure 52: North America Market Value Share (%) and BPS Analysis by Country, 2025-2035
  • Figure 53: North America Market Y-o-Y Growth (%) Projections by Country, 2025-2035
  • Figure 54: North America Market Value (USD Million) Analysis By Source, 2020-2035
  • Figure 55: North America Market Volume (Units) Analysis By Source, 2020-2035
  • Figure 56: North America Market Value Share (%) and BPS Analysis By Source, 2025-2035
  • Figure 57: North America Market Y-o-Y Growth (%) Projections By Source, 2025-2035
  • Figure 58: North America Market Value (USD Million) Analysis By Chemical Form, 2020-2035
  • Figure 59: North America Market Volume (Units) Analysis By Chemical Form, 2020-2035
  • Figure 60: North America Market Value Share (%) and BPS Analysis By Chemical Form, 2025-2035
  • Figure 61: North America Market Y-o-Y Growth (%) Projections By Chemical Form, 2025-2035
  • Figure 62: North America Market Value (USD Million) Analysis By Formulation Type, 2020-2035
  • Figure 63: North America Market Volume (Units) Analysis By Formulation Type, 2020-2035
  • Figure 64: North America Market Value Share (%) and BPS Analysis By Formulation Type, 2025-2035
  • Figure 65: North America Market Y-o-Y Growth (%) Projections By Formulation Type, 2025-2035
  • Figure 66: North America Market Value (USD Million) Analysis By Product Format, 2020-2035
  • Figure 67: North America Market Volume (Units) Analysis By Product Format, 2020-2035
  • Figure 68: North America Market Value Share (%) and BPS Analysis By Product Format, 2025-2035
  • Figure 69: North America Market Y-o-Y Growth (%) Projections By Product Format, 2025-2035
  • Figure 70: North America Market Value (USD Million) Analysis By Application, 2020-2035
  • Figure 71: North America Market Volume (Units) Analysis By Application, 2020-2035
  • Figure 72: North America Market Value Share (%) and BPS Analysis By Application, 2025-2035
  • Figure 73: North America Market Y-o-Y Growth (%) Projections By Application, 2025-2035
  • Figure 74: North America Market Value (USD Million) Analysis By Sales Channel, 2020-2035
  • Figure 75: North America Market Volume (Units) Analysis By Sales Channel, 2020-2035
  • Figure 76: North America Market Value Share (%) and BPS Analysis By Sales Channel, 2025-2035
  • Figure 77: North America Market Y-o-Y Growth (%) Projections By Sales Channel, 2025-2035
  • Figure 78: North America Market Attractiveness By Source, 2025-2035
  • Figure 79: North America Market Attractiveness By Chemical Form, 2025-2035
  • Figure 80: North America Market Attractiveness By Formulation Type, 2025-2035
  • Figure 81: North America Market Attractiveness By Product Format, 2025-2035
  • Figure 82: North America Market Attractiveness By Application, 2025-2035
  • Figure 83: North America Market Attractiveness By Sales Channel, 2025-2035
  • Figure 84: North America Market Attractiveness by Country, 2025-2035
  • Figure 85: Latin America Market Value (USD Million) By Source, 2025-2035
  • Figure 86: Latin America Market Value (USD Million) By Chemical Form, 2025-2035
  • Figure 87: Latin America Market Value (USD Million) By Formulation Type, 2025-2035
  • Figure 88: Latin America Market Value (USD Million) By Product Format, 2025-2035
  • Figure 89: Latin America Market Value (USD Million) By Application, 2025-2035
  • Figure 90: Latin America Market Value (USD Million) By Sales Channel, 2025-2035
  • Figure 91: Latin America Market Value (USD Million) by Country, 2025-2035
  • Figure 92: Latin America Market Value (USD Million) Analysis by Country, 2020-2035
  • Figure 93: Latin America Market Volume (Units) Analysis by Country, 2020-2035
  • Figure 94: Latin America Market Value Share (%) and BPS Analysis by Country, 2025-2035
  • Figure 95: Latin America Market Y-o-Y Growth (%) Projections by Country, 2025-2035
  • Figure 96: Latin America Market Value (USD Million) Analysis By Source, 2020-2035
  • Figure 97: Latin America Market Volume (Units) Analysis By Source, 2020-2035
  • Figure 98: Latin America Market Value Share (%) and BPS Analysis By Source, 2025-2035
  • Figure 99: Latin America Market Y-o-Y Growth (%) Projections By Source, 2025-2035
  • Figure 100: Latin America Market Value (USD Million) Analysis By Chemical Form, 2020-2035
  • Figure 101: Latin America Market Volume (Units) Analysis By Chemical Form, 2020-2035
  • Figure 102: Latin America Market Value Share (%) and BPS Analysis By Chemical Form, 2025-2035
  • Figure 103: Latin America Market Y-o-Y Growth (%) Projections By Chemical Form, 2025-2035
  • Figure 104: Latin America Market Value (USD Million) Analysis By Formulation Type, 2020-2035
  • Figure 105: Latin America Market Volume (Units) Analysis By Formulation Type, 2020-2035
  • Figure 106: Latin America Market Value Share (%) and BPS Analysis By Formulation Type, 2025-2035
  • Figure 107: Latin America Market Y-o-Y Growth (%) Projections By Formulation Type, 2025-2035
  • Figure 108: Latin America Market Value (USD Million) Analysis By Product Format, 2020-2035
  • Figure 109: Latin America Market Volume (Units) Analysis By Product Format, 2020-2035
  • Figure 110: Latin America Market Value Share (%) and BPS Analysis By Product Format, 2025-2035
  • Figure 111: Latin America Market Y-o-Y Growth (%) Projections By Product Format, 2025-2035
  • Figure 112: Latin America Market Value (USD Million) Analysis By Application, 2020-2035
  • Figure 113: Latin America Market Volume (Units) Analysis By Application, 2020-2035
  • Figure 114: Latin America Market Value Share (%) and BPS Analysis By Application, 2025-2035
  • Figure 115: Latin America Market Y-o-Y Growth (%) Projections By Application, 2025-2035
  • Figure 116: Latin America Market Value (USD Million) Analysis By Sales Channel, 2020-2035
  • Figure 117: Latin America Market Volume (Units) Analysis By Sales Channel, 2020-2035
  • Figure 118: Latin America Market Value Share (%) and BPS Analysis By Sales Channel, 2025-2035
  • Figure 119: Latin America Market Y-o-Y Growth (%) Projections By Sales Channel, 2025-2035
  • Figure 120: Latin America Market Attractiveness By Source, 2025-2035
  • Figure 121: Latin America Market Attractiveness By Chemical Form, 2025-2035
  • Figure 122: Latin America Market Attractiveness By Formulation Type, 2025-2035
  • Figure 123: Latin America Market Attractiveness By Product Format, 2025-2035
  • Figure 124: Latin America Market Attractiveness By Application, 2025-2035
  • Figure 125: Latin America Market Attractiveness By Sales Channel, 2025-2035
  • Figure 126: Latin America Market Attractiveness by Country, 2025-2035
  • Figure 127: Europe Market Value (USD Million) By Source, 2025-2035
  • Figure 128: Europe Market Value (USD Million) By Chemical Form, 2025-2035
  • Figure 129: Europe Market Value (USD Million) By Formulation Type, 2025-2035
  • Figure 130: Europe Market Value (USD Million) By Product Format, 2025-2035
  • Figure 131: Europe Market Value (USD Million) By Application, 2025-2035
  • Figure 132: Europe Market Value (USD Million) By Sales Channel, 2025-2035
  • Figure 133: Europe Market Value (USD Million) by Country, 2025-2035
  • Figure 134: Europe Market Value (USD Million) Analysis by Country, 2020-2035
  • Figure 135: Europe Market Volume (Units) Analysis by Country, 2020-2035
  • Figure 136: Europe Market Value Share (%) and BPS Analysis by Country, 2025-2035
  • Figure 137: Europe Market Y-o-Y Growth (%) Projections by Country, 2025-2035
  • Figure 138: Europe Market Value (USD Million) Analysis By Source, 2020-2035
  • Figure 139: Europe Market Volume (Units) Analysis By Source, 2020-2035
  • Figure 140: Europe Market Value Share (%) and BPS Analysis By Source, 2025-2035
  • Figure 141: Europe Market Y-o-Y Growth (%) Projections By Source, 2025-2035
  • Figure 142: Europe Market Value (USD Million) Analysis By Chemical Form, 2020-2035
  • Figure 143: Europe Market Volume (Units) Analysis By Chemical Form, 2020-2035
  • Figure 144: Europe Market Value Share (%) and BPS Analysis By Chemical Form, 2025-2035
  • Figure 145: Europe Market Y-o-Y Growth (%) Projections By Chemical Form, 2025-2035
  • Figure 146: Europe Market Value (USD Million) Analysis By Formulation Type, 2020-2035
  • Figure 147: Europe Market Volume (Units) Analysis By Formulation Type, 2020-2035
  • Figure 148: Europe Market Value Share (%) and BPS Analysis By Formulation Type, 2025-2035
  • Figure 149: Europe Market Y-o-Y Growth (%) Projections By Formulation Type, 2025-2035
  • Figure 150: Europe Market Value (USD Million) Analysis By Product Format, 2020-2035
  • Figure 151: Europe Market Volume (Units) Analysis By Product Format, 2020-2035
  • Figure 152: Europe Market Value Share (%) and BPS Analysis By Product Format, 2025-2035
  • Figure 153: Europe Market Y-o-Y Growth (%) Projections By Product Format, 2025-2035
  • Figure 154: Europe Market Value (USD Million) Analysis By Application, 2020-2035
  • Figure 155: Europe Market Volume (Units) Analysis By Application, 2020-2035
  • Figure 156: Europe Market Value Share (%) and BPS Analysis By Application, 2025-2035
  • Figure 157: Europe Market Y-o-Y Growth (%) Projections By Application, 2025-2035
  • Figure 158: Europe Market Value (USD Million) Analysis By Sales Channel, 2020-2035
  • Figure 159: Europe Market Volume (Units) Analysis By Sales Channel, 2020-2035
  • Figure 160: Europe Market Value Share (%) and BPS Analysis By Sales Channel, 2025-2035
  • Figure 161: Europe Market Y-o-Y Growth (%) Projections By Sales Channel, 2025-2035
  • Figure 162: Europe Market Attractiveness By Source, 2025-2035
  • Figure 163: Europe Market Attractiveness By Chemical Form, 2025-2035
  • Figure 164: Europe Market Attractiveness By Formulation Type, 2025-2035
  • Figure 165: Europe Market Attractiveness By Product Format, 2025-2035
  • Figure 166: Europe Market Attractiveness By Application, 2025-2035
  • Figure 167: Europe Market Attractiveness By Sales Channel, 2025-2035
  • Figure 168: Europe Market Attractiveness by Country, 2025-2035
  • Figure 169: East Asia Market Value (USD Million) By Source, 2025-2035
  • Figure 170: East Asia Market Value (USD Million) By Chemical Form, 2025-2035
  • Figure 171: East Asia Market Value (USD Million) By Formulation Type, 2025-2035
  • Figure 172: East Asia Market Value (USD Million) By Product Format, 2025-2035
  • Figure 173: East Asia Market Value (USD Million) By Application, 2025-2035
  • Figure 174: East Asia Market Value (USD Million) By Sales Channel, 2025-2035
  • Figure 175: East Asia Market Value (USD Million) by Country, 2025-2035
  • Figure 176: East Asia Market Value (USD Million) Analysis by Country, 2020-2035
  • Figure 177: East Asia Market Volume (Units) Analysis by Country, 2020-2035
  • Figure 178: East Asia Market Value Share (%) and BPS Analysis by Country, 2025-2035
  • Figure 179: East Asia Market Y-o-Y Growth (%) Projections by Country, 2025-2035
  • Figure 180: East Asia Market Value (USD Million) Analysis By Source, 2020-2035
  • Figure 181: East Asia Market Volume (Units) Analysis By Source, 2020-2035
  • Figure 182: East Asia Market Value Share (%) and BPS Analysis By Source, 2025-2035
  • Figure 183: East Asia Market Y-o-Y Growth (%) Projections By Source, 2025-2035
  • Figure 184: East Asia Market Value (USD Million) Analysis By Chemical Form, 2020-2035
  • Figure 185: East Asia Market Volume (Units) Analysis By Chemical Form, 2020-2035
  • Figure 186: East Asia Market Value Share (%) and BPS Analysis By Chemical Form, 2025-2035
  • Figure 187: East Asia Market Y-o-Y Growth (%) Projections By Chemical Form, 2025-2035
  • Figure 188: East Asia Market Value (USD Million) Analysis By Formulation Type, 2020-2035
  • Figure 189: East Asia Market Volume (Units) Analysis By Formulation Type, 2020-2035
  • Figure 190: East Asia Market Value Share (%) and BPS Analysis By Formulation Type, 2025-2035
  • Figure 191: East Asia Market Y-o-Y Growth (%) Projections By Formulation Type, 2025-2035
  • Figure 192: East Asia Market Value (USD Million) Analysis By Product Format, 2020-2035
  • Figure 193: East Asia Market Volume (Units) Analysis By Product Format, 2020-2035
  • Figure 194: East Asia Market Value Share (%) and BPS Analysis By Product Format, 2025-2035
  • Figure 195: East Asia Market Y-o-Y Growth (%) Projections By Product Format, 2025-2035
  • Figure 196: East Asia Market Value (USD Million) Analysis By Application, 2020-2035
  • Figure 197: East Asia Market Volume (Units) Analysis By Application, 2020-2035
  • Figure 198: East Asia Market Value Share (%) and BPS Analysis By Application, 2025-2035
  • Figure 199: East Asia Market Y-o-Y Growth (%) Projections By Application, 2025-2035
  • Figure 200: East Asia Market Value (USD Million) Analysis By Sales Channel, 2020-2035
  • Figure 201: East Asia Market Volume (Units) Analysis By Sales Channel, 2020-2035
  • Figure 202: East Asia Market Value Share (%) and BPS Analysis By Sales Channel, 2025-2035
  • Figure 203: East Asia Market Y-o-Y Growth (%) Projections By Sales Channel, 2025-2035
  • Figure 204: East Asia Market Attractiveness By Source, 2025-2035
  • Figure 205: East Asia Market Attractiveness By Chemical Form, 2025-2035
  • Figure 206: East Asia Market Attractiveness By Formulation Type, 2025-2035
  • Figure 207: East Asia Market Attractiveness By Product Format, 2025-2035
  • Figure 208: East Asia Market Attractiveness By Application, 2025-2035
  • Figure 209: East Asia Market Attractiveness By Sales Channel, 2025-2035
  • Figure 210: East Asia Market Attractiveness by Country, 2025-2035
  • Figure 211: South Asia & Pacific Market Value (USD Million) By Source, 2025-2035
  • Figure 212: South Asia & Pacific Market Value (USD Million) By Chemical Form, 2025-2035
  • Figure 213: South Asia & Pacific Market Value (USD Million) By Formulation Type, 2025-2035
  • Figure 214: South Asia & Pacific Market Value (USD Million) By Product Format, 2025-2035
  • Figure 215: South Asia & Pacific Market Value (USD Million) By Application, 2025-2035
  • Figure 216: South Asia & Pacific Market Value (USD Million) By Sales Channel, 2025-2035
  • Figure 217: South Asia & Pacific Market Value (USD Million) by Country, 2025-2035
  • Figure 218: South Asia & Pacific Market Value (USD Million) Analysis by Country, 2020-2035
  • Figure 219: South Asia & Pacific Market Volume (Units) Analysis by Country, 2020-2035
  • Figure 220: South Asia & Pacific Market Value Share (%) and BPS Analysis by Country, 2025-2035
  • Figure 221: South Asia & Pacific Market Y-o-Y Growth (%) Projections by Country, 2025-2035
  • Figure 222: South Asia & Pacific Market Value (USD Million) Analysis By Source, 2020-2035
  • Figure 223: South Asia & Pacific Market Volume (Units) Analysis By Source, 2020-2035
  • Figure 224: South Asia & Pacific Market Value Share (%) and BPS Analysis By Source, 2025-2035
  • Figure 225: South Asia & Pacific Market Y-o-Y Growth (%) Projections By Source, 2025-2035
  • Figure 226: South Asia & Pacific Market Value (USD Million) Analysis By Chemical Form, 2020-2035
  • Figure 227: South Asia & Pacific Market Volume (Units) Analysis By Chemical Form, 2020-2035
  • Figure 228: South Asia & Pacific Market Value Share (%) and BPS Analysis By Chemical Form, 2025-2035
  • Figure 229: South Asia & Pacific Market Y-o-Y Growth (%) Projections By Chemical Form, 2025-2035
  • Figure 230: South Asia & Pacific Market Value (USD Million) Analysis By Formulation Type, 2020-2035
  • Figure 231: South Asia & Pacific Market Volume (Units) Analysis By Formulation Type, 2020-2035
  • Figure 232: South Asia & Pacific Market Value Share (%) and BPS Analysis By Formulation Type, 2025-2035
  • Figure 233: South Asia & Pacific Market Y-o-Y Growth (%) Projections By Formulation Type, 2025-2035
  • Figure 234: South Asia & Pacific Market Value (USD Million) Analysis By Product Format, 2020-2035
  • Figure 235: South Asia & Pacific Market Volume (Units) Analysis By Product Format, 2020-2035
  • Figure 236: South Asia & Pacific Market Value Share (%) and BPS Analysis By Product Format, 2025-2035
  • Figure 237: South Asia & Pacific Market Y-o-Y Growth (%) Projections By Product Format, 2025-2035
  • Figure 238: South Asia & Pacific Market Value (USD Million) Analysis By Application, 2020-2035
  • Figure 239: South Asia & Pacific Market Volume (Units) Analysis By Application, 2020-2035
  • Figure 240: South Asia & Pacific Market Value Share (%) and BPS Analysis By Application, 2025-2035
  • Figure 241: South Asia & Pacific Market Y-o-Y Growth (%) Projections By Application, 2025-2035
  • Figure 242: South Asia & Pacific Market Value (USD Million) Analysis By Sales Channel, 2020-2035
  • Figure 243: South Asia & Pacific Market Volume (Units) Analysis By Sales Channel, 2020-2035
  • Figure 244: South Asia & Pacific Market Value Share (%) and BPS Analysis By Sales Channel, 2025-2035
  • Figure 245: South Asia & Pacific Market Y-o-Y Growth (%) Projections By Sales Channel, 2025-2035
  • Figure 246: South Asia & Pacific Market Attractiveness By Source, 2025-2035
  • Figure 247: South Asia & Pacific Market Attractiveness By Chemical Form, 2025-2035
  • Figure 248: South Asia & Pacific Market Attractiveness By Formulation Type, 2025-2035
  • Figure 249: South Asia & Pacific Market Attractiveness By Product Format, 2025-2035
  • Figure 250: South Asia & Pacific Market Attractiveness By Application, 2025-2035
  • Figure 251: South Asia & Pacific Market Attractiveness By Sales Channel, 2025-2035
  • Figure 252: South Asia & Pacific Market Attractiveness by Country, 2025-2035
  • Figure 253: MEA Market Value (USD Million) By Source, 2025-2035
  • Figure 254: MEA Market Value (USD Million) By Chemical Form, 2025-2035
  • Figure 255: MEA Market Value (USD Million) By Formulation Type, 2025-2035
  • Figure 256: MEA Market Value (USD Million) By Product Format, 2025-2035
  • Figure 257: MEA Market Value (USD Million) By Application, 2025-2035
  • Figure 258: MEA Market Value (USD Million) By Sales Channel, 2025-2035
  • Figure 259: MEA Market Value (USD Million) by Country, 2025-2035
  • Figure 260: MEA Market Value (USD Million) Analysis by Country, 2020-2035
  • Figure 261: MEA Market Volume (Units) Analysis by Country, 2020-2035
  • Figure 262: MEA Market Value Share (%) and BPS Analysis by Country, 2025-2035
  • Figure 263: MEA Market Y-o-Y Growth (%) Projections by Country, 2025-2035
  • Figure 264: MEA Market Value (USD Million) Analysis By Source, 2020-2035
  • Figure 265: MEA Market Volume (Units) Analysis By Source, 2020-2035
  • Figure 266: MEA Market Value Share (%) and BPS Analysis By Source, 2025-2035
  • Figure 267: MEA Market Y-o-Y Growth (%) Projections By Source, 2025-2035
  • Figure 268: MEA Market Value (USD Million) Analysis By Chemical Form, 2020-2035
  • Figure 269: MEA Market Volume (Units) Analysis By Chemical Form, 2020-2035
  • Figure 270: MEA Market Value Share (%) and BPS Analysis By Chemical Form, 2025-2035
  • Figure 271: MEA Market Y-o-Y Growth (%) Projections By Chemical Form, 2025-2035
  • Figure 272: MEA Market Value (USD Million) Analysis By Formulation Type, 2020-2035
  • Figure 273: MEA Market Volume (Units) Analysis By Formulation Type, 2020-2035
  • Figure 274: MEA Market Value Share (%) and BPS Analysis By Formulation Type, 2025-2035
  • Figure 275: MEA Market Y-o-Y Growth (%) Projections By Formulation Type, 2025-2035
  • Figure 276: MEA Market Value (USD Million) Analysis By Product Format, 2020-2035
  • Figure 277: MEA Market Volume (Units) Analysis By Product Format, 2020-2035
  • Figure 278: MEA Market Value Share (%) and BPS Analysis By Product Format, 2025-2035
  • Figure 279: MEA Market Y-o-Y Growth (%) Projections By Product Format, 2025-2035
  • Figure 280: MEA Market Value (USD Million) Analysis By Application, 2020-2035
  • Figure 281: MEA Market Volume (Units) Analysis By Application, 2020-2035
  • Figure 282: MEA Market Value Share (%) and BPS Analysis By Application, 2025-2035
  • Figure 283: MEA Market Y-o-Y Growth (%) Projections By Application, 2025-2035
  • Figure 284: MEA Market Value (USD Million) Analysis By Sales Channel, 2020-2035
  • Figure 285: MEA Market Volume (Units) Analysis By Sales Channel, 2020-2035
  • Figure 286: MEA Market Value Share (%) and BPS Analysis By Sales Channel, 2025-2035
  • Figure 287: MEA Market Y-o-Y Growth (%) Projections By Sales Channel, 2025-2035
  • Figure 288: MEA Market Attractiveness By Source, 2025-2035
  • Figure 289: MEA Market Attractiveness By Chemical Form, 2025-2035
  • Figure 290: MEA Market Attractiveness By Formulation Type, 2025-2035
  • Figure 291: MEA Market Attractiveness By Product Format, 2025-2035
  • Figure 292: MEA Market Attractiveness By Application, 2025-2035
  • Figure 293: MEA Market Attractiveness By Sales Channel, 2025-2035
  • Figure 294: MEA Market Attractiveness by Country, 2025-2035

Frequently Asked Questions

How big is the Berberine Market in 2025?

The global Berberine Market is estimated to be valued at USD 1.79 billion in 2025.

What will be the size of the Berberine Market in 2035?

The market size for the global Berberine Market is projected to reach approximately USD 3.12 billion by 2035.

How much will the Berberine Market grow between 2025 and 2035?

The Berberine Market is expected to grow at a CAGR of 6.28% between 2025 and 2035.

What are the key product formats in the Berberine Market?

The key product formats in the Berberine Market include Capsules, Tablets, Softgels, Powders, Liquid Extracts/Tinctures, Gummies, and Functional Foods & Beverages.

Which application segment will contribute significantly to the Berberine Market in 2025?

In terms of application, the Blood Sugar Management segment is expected to command the largest share at 35% of the Berberine Market in 2025.

Future Market Insights

Berberine Market