Bioinformatics Market Size and Share Forecast Outlook 2025 to 2035

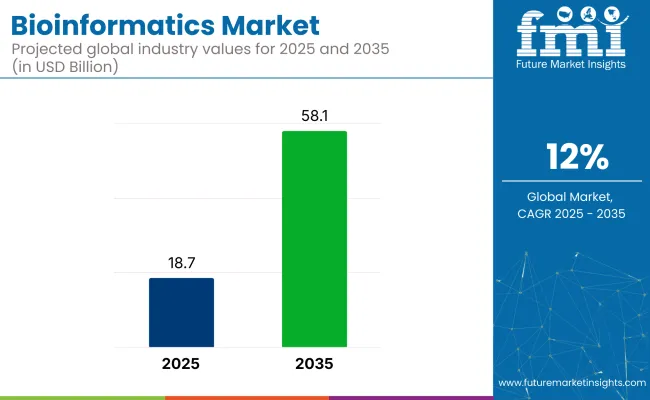
The global bioinformatics market is expected to rise from USD 18.7 billion in 2025 to around USD 58.1 billion by 2035, reflecting a CAGR of 12% during the forecast period. The market is undergoing substantial transformation driven by advancements in next-generation sequencing, AI-powered analytics, and rapid data generation from genomics and proteomics.
Bioinformatics Market Quick Stats

  • Market Value (2025): USD 18.7 billion
  • Forecast Value (2035): USD 58.1 billion
  • Forecast CAGR: 12%
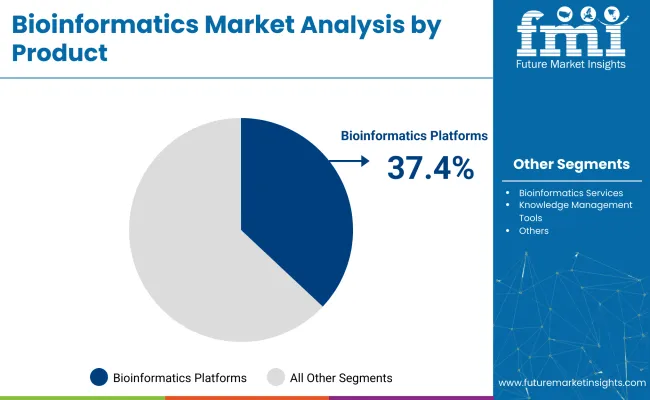
  • Leading Segment in 2025: Bioinformatics platforms (approximately 37.4% share)
  • Key Growth Region: Asia (India)
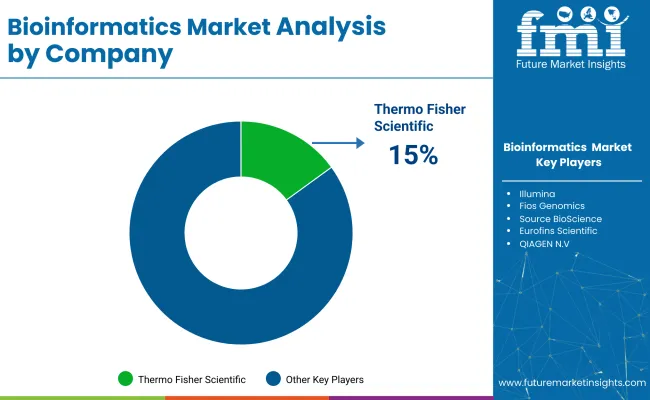
  • Top Key Players: Thermo Fisher Scientific Inc., Eurofins Scientific, QIAGEN N.V., Agilent Technologies Inc., Illumina Inc.

Bioinformatics Market

Attribute Value
Market Size in 2025 USD 18.7 billion
Market Size in 2035 USD 58.1 billion
CAGR (2025 to 2035) 12%

This robust expansion is being fueled by the escalating demand for precision medicine, drug discovery innovations, and integrated healthcare data solutions. Governments and private investors are pouring capital into omics infrastructure, fostering collaborative ecosystems between research institutions, pharma companies, and computational labs.

For instance, public-private initiatives in India and China are streamlining access to genomic databases, creating a fertile ground for applications.Strategic acquisitions and cloud integration efforts by players like PerkinElmer and Eurofins Scientific are being prioritized to strengthen scalability. With the rise of big data and multi-omics, platform interoperability and AI capabilities are becoming critical for companies to stay competitive.

In January 2024, QIAGEN reaffirmed its strategic focus on expanding its footprint in the market through substantial investments in its QIAGEN Digital Insights (QDI) platform. As the demand for data-driven solutions in genomics, precision medicine, and molecular diagnostics continues to grow, QIAGEN is leveraging its expertise in artificial intelligence and natural language processing to deliver scalable, high-performance tools.

The company aims to meet the rising need for advanced data analysis in life sciences and healthcare. As Thierry Bernard, Chief Executive Officer of QIAGEN, stated, “Our significant investments into QDI demonstrate our commitment to accelerating growth and promoting innovation in the market. Based on the track record of doubledigit sales growth combined with a high level of profitability in our bioinformatics business, we believe now is the optimal time to invest.”

Analyzing Bioinformatics Market by Top Investment Segments

Demand in the bioinformatics market is primarily concentrated in three strategic segments: platforms, genomics, and medical biotechnology. These segments are drawing the majority of investment and innovation, led by global leaders in research tools, sequencing, and molecular diagnostics.

Bioinformatics Platforms Are Expected to Lead Demand by Product Type in 2025

Bioinformatics platforms are projected to command 37.4% of the product category in 2025. These platforms are critical to supporting sequence alignment, data interpretation, and visualization.
  • Thermo Fisher Scientific, Illumina, and Agilent Technologies have consistently led this segment through platform scalability and AI integration.
  • In 2024, Agilent released upgrades to its Alissa Interpret software, optimizing sequence annotation for rare disease diagnostics. Increasing use of these tools in gene editing, immuno-oncology, and translational medicine is driving institutional purchases.
  • Cloud-based data pipelines, API interoperability, and algorithm training modules are also being prioritized to meet the scalability needs of pharma R&D and academic institutions. With AI-guided precision therapeutics gaining traction, platform investments are forecasted to rise significantly across North America and Asia.

Bioinformatics Market Analysis By Product

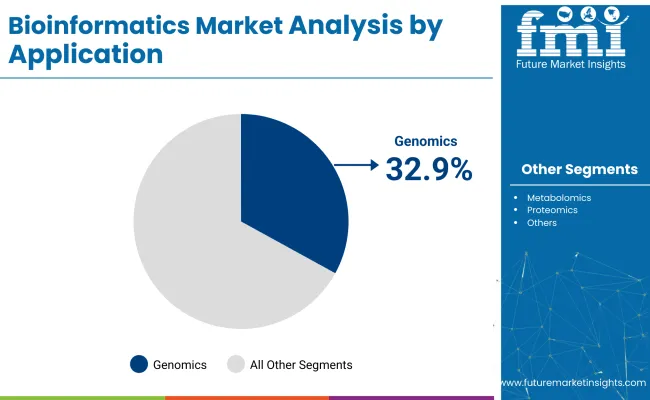
Genomics is likely to dominate by 32.9% market share in 2025

Genomics leads all application segments with a 32.9% market share in 2025. Genomic data is fundamental to identifying hereditary risks, designing personalized drugs, and optimizing trial outcomes.
  • Illumina’s DRAGEN Bio-IT and QIAGEN’s CLC Genomics Workbench are commonly used tools that enable rapid sequence analysis and integration with clinical EMRs.
  • In 2023, China expanded its national genomics databank, which has increased collaboration with companies like BGI Genomics and international biotech partners.
  • Genomics-based approaches also played a crucial role in rare disease registries, neonatal screening, and COVID-19 surveillance, further validating its long-term relevance. As emerging nations ramp up genomics infrastructure, the segment is likely to stay dominant globally.

Bioinformatics Market Analysis By Application

Medical Biotechnology drives sector dominance with 42.8% share in 2025

Medical biotechnology accounts for 42.8% of the bioinformatics market in 2025, making it the largest sectoral contributor. It is extensively used in drug discovery, clinical trial management, and vaccine development.

  • Companies such as PerkinElmer, Eurofins Scientific, and NeoGenomics Laboratories are actively deploying in the market to accelerate biomarker identification and streamline regulatory submissions.
  • In 2024, Eurofins partnered with BioPharmaSpec to offer integrated proteomics services for biologics. The rise of biologics, CAR-T therapies, and RNA-based drugs is increasing the need for biotech pipelines.
  • Moreover, the sector benefits from close collaborations between CROs, pharma companies, and academic biotech labs. With AI-based drug discovery platforms on the rise, medical biotechnology will continue to absorb the highest share of the product tools and services.

Top Bioinformatics Market Dynamics

The bioinformatics market is being fueled by rising demand for precision medicine, omics-based research, and AI-powered data interpretation. However, concerns related to data interoperability and stringent data privacy regulations are being observed as barriers to seamless global adoption.

Advances in omics and AI analytics are accelerating bioinformatics adoption

Significant momentum is being gained through the integration of genomics, proteomics, and metabolomics data. AI-powered platforms such as Illumina’s Emedgene (updated in 2024) are being used to interpret genetic variants with high accuracy, especially in rare disease diagnostics.

National genomics efforts in India, China, and the UK are also being prioritized to expand data repositories and collaborative infrastructure. As a result, the product is being embedded into personalized medicine and pharmaceutical development processes at an unprecedented pace.

Data interoperability and compliance challenges are restraining global deployment

Bioinformatics platforms are being limited by the absence of standardized data models, incompatible APIs, and fragmented systems. Compliance with strict frameworks such as GDPR in Europe and HIPAA in the United States is also being required, complicating cloud-based data access.

A 2023 GA4GH report revealed that more than 60% of professionals experienced regulatory delays in project delivery. Due to these issues, higher infrastructure costs and entry-level barriers are being encountered, particularly among SMEs and startups in emerging markets.

Exploring Top Countries Driving Innovation, Adoption, and Delivery of Bioinformatics Solutions

Global leadership in bioinformatics is being shaped by countries investing in omics infrastructure, AI-based platforms, and cross-disciplinary collaborations. The United States, China, India, the United Kingdom, and South Korea are emerging as influential players with strong CAGR outlooks.

Countrywise Analysis Of Bioinformatics Market

Countries CAGR (2025 to 2035)
United States 9.6%
United Kingdom 9.1%
China 11.2%
India 11.8%
South Korea 10.4%

In-depth Analysis of Bioinformatics Market in the United States

The market in the USA is expected to maintain dominance with a 9.6% CAGR from 2025 to 2035.

  • The United States is being positioned as the global leader in bioinformatics, driven by high R&D investments, AI-led genomic analysis, and precision medicine integration.
  • Major companies such as Thermo Fisher Scientific, Illumina, and NeoGenomics Laboratories are being headquartered in the USA, reinforcing platform innovation. Initiatives like the NIH’s All of Us Research Program are also being used to collect large-scale genomic data.
  • Strong academic-industry partnerships and FDA support for genomic diagnostics are being leveraged to sustain innovation.

Comprehensive Overview of the Bioinformatics Market in China

China is being viewed as a pivotal hub for bioinformatics expansion in Asia with a CAGR of 11.2% through 2035.

  • China’s bioinformatics market is being rapidly developed through national genomics policies and partnerships with leading firms like BGI Genomics.
  • Strong government funding in omics research and AI integration is being prioritized under the Health China 2030 initiative. High-throughput sequencing platforms are being adopted in universities and biopharma firms, improving access.
  • Regional innovation hubs in Beijing, Shanghai, and Shenzhen are being strengthened with cloud-computing support.

Extensive Insights into the Bioinformatics Market in India

India is expected to grow at a CAGR of 11.8% between 2025 and 2035, positioning itself as a strong emerging market player

  • India’s bioinformatics market is being driven by affordable genome sequencing, a skilled IT-biotech workforce, and initiatives like GenomeIndia. AI-based informatics startups and partnerships with institutions like IISc and CSIR are enabling rapid platform deployment.
  • Growing collaborations with global pharmaceutical firms are also increasing data generation from clinical trials. With a favorable regulatory environment and public investments in biobanks and omics infrastructure.

Bioinformatics Market Insights from the United Kingdom

The UK remains a vital player in the European bioinformatics space with a CAGR of 9.1% through 2035.

  • The UK bioinformatics landscape is being advanced by government-supported initiatives such as Genomics England and the NHS Genomic Medicine Service.
  • These programs are integrating into routine healthcare, especially in cancer and rare disease diagnostics. Companies like Oxford Nanopore and Eagle Genomics are supporting local platform innovation.
  • Investments in AI-based tools and secure cloud infrastructure are also being prioritized. Academic-clinical collaboration frameworks are being leveraged to improve interoperability and data reuse.

South Korea’s Bioinformatics Innovation and Adoption Trends

South Korea is being positioned as a technology-forward leader in the East Asian bioinformatics market with a CAGR of 10.4% forecasted through 2035.
  • South Korea’s bioinformatics sector is being shaped by its Precision Medicine Initiative and the expansion of national biobanks. Companies such as Macrogen and Korea BioData are leading innovations in omics analytics.
  • Government support for integrating clinical and genomic data is being observed through the Korean Genome Project. Digital health ecosystems and 5G infrastructure are enabling faster deployment of AI-powered informatics tools.

Leading Bioinformatics Suppliers

Bioinformatics Market Analysis By Company

The bioinformatics market is being led by leading companies such as Thermo Fisher Scientific, Illumina, Agilent Technologies, and QIAGEN, which maintain dominance through proprietary platforms, sequencing systems, and global distribution networks. Emerging players like Fios Genomics, NeoGenomics Laboratories, and Source BioScience are being focused on niche informatics services, including contract analysis and diagnostics.

Strategic partnerships, product enhancements, and cloud integration are being prioritized to strengthen scalability. In 2024, PerkinElmer expanded its genomics software offerings to support rare disease diagnostics. Market entry is being challenged by high R&D costs, regulatory complexities, and platform standardization issues. While the market remains moderately consolidated, competitive intensity is being raised by emerging AI-driven platform developers and region-specific data analytics startups.

Recent Bioinformatics Industry News

  • In July 2024, Indonesia, in collaboration with the World Health Organization (WHO), launched a three-day workshop in Central Java to implement Multisource Collaborative Surveillance (MSCS) for dengue. This approach integrates data from health facilities, meteorological agencies, and community reports to enhance early detection and response. The workshop engaged 55 participants from various sectors to improve health emergency preparedness.
  • In November 2024, Indonesia became the first in Asia-Pacific to implement the Convergence Initiative. A National Inception Workshop in Jakarta brought together over 20 organizations to create a strategic framework that integrates food systems and climate agendas for sustainable development.

Leading Players in the Bioinformatics Market

  • Thermo Fisher Scientific Inc.
  • Eurofins Scientific
  • QIAGEN N.V.
  • Agilent Technologies Inc.
  • Illumina Inc.
  • Waters Corporation
  • NeoGenomics Laboratories
  • PerkinElmer Inc.
  • Fios Genomics
  • Source BioScience

Report Scope of the Market

Report Attributes Details
Current Total Market Size (2025) USD 18.7 billion
Projected Market Size (2035) USD 58.1 billion
CAGR (2025 to 2035) 12%
Base Year for Estimation 2024
Historical Period 2020 to 2024
Projections Period 2025 to 2035
Quantitative Units USD billion for value and million units for volume
Product Types Analyzed Bioinformatics Platforms (Sequence Analysis Platform, Sequence Alignment Platform, Sequence Manipulation Platform, Structural and Functional Analysis Platform, Other)
Application Segmentation Genomics, Molecular Phylogenetics, Metabolomics, Proteomics, Transcriptions, Chemoinformatics and Drug Designing, Others
Sector Segmentation Medical Biotechnology, Animal Biotechnology, Plant Biotechnology, Environmental Biotechnology, Forensic Biotechnology, Other Sectors
Regions Covered North America, Latin America, Europe, Asia-Pacific, Middle East & Africa
Countries Covered United States, Canada, Mexico, Brazil, Argentina, Germany, France, United Kingdom, Italy, Spain, Netherlands, China, India, Japan, South Korea, Australia, New Zealand, GCC Countries, South Africa
Key Players Influencing the Market Thermo Fisher Scientific Inc., Eurofins Scientific, QIAGEN N.V., Agilent Technologies Inc., Illumina Inc., Waters Corporation, NeoGenomics Laboratories, Perkin Elmer Inc., Fios Genomics, Source BioScience
Additional Attributes Dollar sales by product type, application, and sector, growth in personalized medicine and diagnostics, increasing demand for genomics and molecular biology applications, rise in automation and AI adoption in bioinformatics, regional trends in biotech and pharmaceutical R&D.

Key Segments

By Product:

The market is segmented into Bioinformatics Platforms, Bioinformatics Services, Knowledge Management Tools, and Biocontent.

By Application:

The market is segmented into Genomics, Molecular Phylogenetics, Metabolomics, Proteomics, Transcriptions, Chemoinformatics and Drug Designing, and Others.

By Sector:

The market is segmented into Medical Biotechnology, Animal Biotechnology, Plant Biotechnology, Environmental Biotechnology, Forensic Biotechnology, and Other Sectors.

By Region:

The market is segmented into North America, Latin America, Europe, Asia-Pacific, and Middle East & Africa.

Table of Content

  1. Executive Summary
  2. Market Overview
  3. Market Background
  4. Global Market Analysis 2020 to 2024 and Forecast, 2025 to 2035
  5. Global Market Pricing Analysis 2020 to 2024 and Forecast 2025 to 2035
  6. Global Market Analysis 2020 to 2024 and Forecast 2025 to 2035, By Product
    • Platforms
    • Services
    • Knowledge Management Tools
    • Biocontent
  7. Global Market Analysis 2020 to 2024 and Forecast 2025 to 2035, By Application
    • Genomics
    • Molecular Phylogenetics
    • Metabolomics
    • Proteomics
    • Transcriptions
    • Chemoinformatics and Drug Designing
    • Others
  8. Global Market Analysis 2020 to 2024 and Forecast 2025 to 2035, By Sector
    • Medical Biotechnology
    • Animal Biotechnology
    • Plant Biotechnology
    • Environmental Biotechnology
    • Forensic Biotechnology
    • Other Sectors
  9. Global Market Analysis 2020 to 2024 and Forecast 2025 to 2035, By Region
    • North America
    • Latin America
    • Western Europe
    • Eastern Europe
    • East Asia
    • South Asia & Pacific
    • Middle East and Africa
  10. North America Market Analysis 2020 to 2024 and Forecast 2025 to 2035, By Country
  11. Latin America Market Analysis 2020 to 2024 and Forecast 2025 to 2035, By Country
  12. Western Europe Market Analysis 2020 to 2024 and Forecast 2025 to 2035, By Country
  13. Eastern Europe Market Analysis 2020 to 2024 and Forecast 2025 to 2035, By Country
  14. East Asia Market Analysis 2020 to 2024 and Forecast 2025 to 2035, By Country
  15. South Asia & Pacific Market Analysis 2020 to 2024 and Forecast 2025 to 2035, By Country
  16. Middle East and Africa Market Analysis 2020 to 2024 and Forecast 2025 to 2035, By Country
  17. Key Countries Market Analysis
  18. Market Structure Analysis
  19. Competition Analysis
    • Thermo Fisher Scientific Inc.
    • Eurofins Scientific
    • QIAGEN N.V.
    • Agilent Technologies Inc.
    • Illumina Inc.
    • Waters Corporation
    • NeoGenomics Laboratories
    • PerkinElmer Inc.
    • Fios Genomics
    • Source BioScience
  20. Assumptions & Acronyms Used
  21. Research Methodology

List of Tables

  • Table 1: Global Market Value (USD Billion) Forecast by Region, 2020 to 2035
  • Table 2: Global Market Volume (Million Unit) Forecast by Region, 2020 to 2035
  • Table 3: Global Market Value (USD Billion) Forecast by Product, 2020 to 2035
  • Table 4: Global Market Volume (Million Unit) Forecast by Product, 2020 to 2035
  • Table 5: Global Market Value (USD Billion) Forecast by Application, 2020 to 2035
  • Table 6: Global Market Volume (Million Unit) Forecast by Application, 2020 to 2035
  • Table 7: Global Market Value (USD Billion) Forecast by Sector, 2020 to 2035
  • Table 8: Global Market Volume (Million Unit) Forecast by Sector, 2020 to 2035
  • Table 9: North America Market Value (USD Billion) Forecast by Country, 2020 to 2035
  • Table 10: North America Market Volume (Million Unit) Forecast by Country, 2020 to 2035
  • Table 11: North America Market Value (USD Billion) Forecast by Product, 2020 to 2035
  • Table 12: North America Market Volume (Million Unit) Forecast by Product, 2020 to 2035
  • Table 13: North America Market Value (USD Billion) Forecast by Application, 2020 to 2035
  • Table 14: North America Market Volume (Million Unit) Forecast by Application, 2020 to 2035
  • Table 15: North America Market Value (USD Billion) Forecast by Sector, 2020 to 2035
  • Table 16: North America Market Volume (Million Unit) Forecast by Sector, 2020 to 2035
  • Table 17: Latin America Market Value (USD Billion) Forecast by Country, 2020 to 2035
  • Table 18: Latin America Market Volume (Million Unit) Forecast by Country, 2020 to 2035
  • Table 19: Latin America Market Value (USD Billion) Forecast by Product, 2020 to 2035
  • Table 20: Latin America Market Volume (Million Unit) Forecast by Product, 2020 to 2035
  • Table 21: Latin America Market Value (USD Billion) Forecast by Application, 2020 to 2035
  • Table 22: Latin America Market Volume (Million Unit) Forecast by Application, 2020 to 2035
  • Table 23: Latin America Market Value (USD Billion) Forecast by Sector, 2020 to 2035
  • Table 24: Latin America Market Volume (Million Unit) Forecast by Sector, 2020 to 2035
  • Table 25: Western Europe Market Value (USD Billion) Forecast by Country, 2020 to 2035
  • Table 26: Western Europe Market Volume (Million Unit) Forecast by Country, 2020 to 2035
  • Table 27: Western Europe Market Value (USD Billion) Forecast by Product, 2020 to 2035
  • Table 28: Western Europe Market Volume (Million Unit) Forecast by Product, 2020 to 2035
  • Table 29: Western Europe Market Value (USD Billion) Forecast by Application, 2020 to 2035
  • Table 30: Western Europe Market Volume (Million Unit) Forecast by Application, 2020 to 2035
  • Table 31: Western Europe Market Value (USD Billion) Forecast by Sector, 2020 to 2035
  • Table 32: Western Europe Market Volume (Million Unit) Forecast by Sector, 2020 to 2035
  • Table 33: Eastern Europe Market Value (USD Billion) Forecast by Country, 2020 to 2035
  • Table 34: Eastern Europe Market Volume (Million Unit) Forecast by Country, 2020 to 2035
  • Table 35: Eastern Europe Market Value (USD Billion) Forecast by Product, 2020 to 2035
  • Table 36: Eastern Europe Market Volume (Million Unit) Forecast by Product, 2020 to 2035
  • Table 37: Eastern Europe Market Value (USD Billion) Forecast by Application, 2020 to 2035
  • Table 38: Eastern Europe Market Volume (Million Unit) Forecast by Application, 2020 to 2035
  • Table 39: Eastern Europe Market Value (USD Billion) Forecast by Sector, 2020 to 2035
  • Table 40: Eastern Europe Market Volume (Million Unit) Forecast by Sector, 2020 to 2035
  • Table 41: East Asia Market Value (USD Billion) Forecast by Country, 2020 to 2035
  • Table 42: East Asia Market Volume (Million Unit) Forecast by Country, 2020 to 2035
  • Table 43: East Asia Market Value (USD Billion) Forecast by Product, 2020 to 2035
  • Table 44: East Asia Market Volume (Million Unit) Forecast by Product, 2020 to 2035
  • Table 45: East Asia Market Value (USD Billion) Forecast by Application, 2020 to 2035
  • Table 46: East Asia Market Volume (Million Unit) Forecast by Application, 2020 to 2035
  • Table 47: East Asia Market Value (USD Billion) Forecast by Sector, 2020 to 2035
  • Table 48: East Asia Market Volume (Million Unit) Forecast by Sector, 2020 to 2035
  • Table 49: South Asia & Pacific Market Value (USD Billion) Forecast by Country, 2020 to 2035
  • Table 50: South Asia & Pacific Market Volume (Million Unit) Forecast by Country, 2020 to 2035
  • Table 51: South Asia & Pacific Market Value (USD Billion) Forecast by Product, 2020 to 2035
  • Table 52: South Asia & Pacific Market Volume (Million Unit) Forecast by Product, 2020 to 2035
  • Table 53: South Asia & Pacific Market Value (USD Billion) Forecast by Application, 2020 to 2035
  • Table 54: South Asia & Pacific Market Volume (Million Unit) Forecast by Application, 2020 to 2035
  • Table 55: South Asia & Pacific Market Value (USD Billion) Forecast by Sector, 2020 to 2035
  • Table 56: South Asia & Pacific Market Volume (Million Unit) Forecast by Sector, 2020 to 2035
  • Table 57: Middle East and Africa Market Value (USD Billion) Forecast by Country, 2020 to 2035
  • Table 58: Middle East and Africa Market Volume (Million Unit) Forecast by Country, 2020 to 2035
  • Table 59: Middle East and Africa Market Value (USD Billion) Forecast by Product, 2020 to 2035
  • Table 60: Middle East and Africa Market Volume (Million Unit) Forecast by Product, 2020 to 2035
  • Table 61: Middle East and Africa Market Value (USD Billion) Forecast by Application, 2020 to 2035
  • Table 62: Middle East and Africa Market Volume (Million Unit) Forecast by Application, 2020 to 2035
  • Table 63: Middle East and Africa Market Value (USD Billion) Forecast by Sector, 2020 to 2035
  • Table 64: Middle East and Africa Market Volume (Million Unit) Forecast by Sector, 2020 to 2035

List of Figures

  • Figure 1: Global Market Volume (Million Unit) Forecast 2020 to 2035
  • Figure 2: Global Market Pricing Analysis
  • Figure 3: Global Market Value (USD Billion) Forecast 2020 to 2035
  • Figure 4: Global Market Value Share and BPS Analysis by Product, 2025 and 2035
  • Figure 5: Global Market Y-o-Y Growth Comparison by Product, 2025 to 2035
  • Figure 6: Global Market Attractiveness Analysis by Product
  • Figure 7: Global Market Value Share and BPS Analysis by Application, 2025 and 2035
  • Figure 8: Global Market Y-o-Y Growth Comparison by Application, 2025 to 2035
  • Figure 9: Global Market Attractiveness Analysis by Application
  • Figure 10: Global Market Value Share and BPS Analysis by Sector, 2025 and 2035
  • Figure 11: Global Market Y-o-Y Growth Comparison by Sector, 2025 to 2035
  • Figure 12: Global Market Attractiveness Analysis by Sector
  • Figure 13: Global Market Value (USD Billion) Share and BPS Analysis by Region, 2025 and 2035
  • Figure 14: Global Market Y-o-Y Growth Comparison by Region, 2025 to 2035
  • Figure 15: Global Market Attractiveness Analysis by Region
  • Figure 16: North America Market Incremental USD Opportunity, 2025 to 2035
  • Figure 17: Latin America Market Incremental USD Opportunity, 2025 to 2035
  • Figure 18: Western Europe Market Incremental USD Opportunity, 2025 to 2035
  • Figure 19: Eastern Europe Market Incremental USD Opportunity, 2025 to 2035
  • Figure 20: East Asia Market Incremental USD Opportunity, 2025 to 2035
  • Figure 21: South Asia & Pacific Market Incremental USD Opportunity, 2025 to 2035
  • Figure 22: Middle East and Africa Market Incremental USD Opportunity, 2025 to 2035
  • Figure 23: North America Market Value Share and BPS Analysis by Country, 2025 and 2035
  • Figure 24: North America Market Value Share and BPS Analysis by Product, 2025 and 2035
  • Figure 25: North America Market Y-o-Y Growth Comparison by Product, 2025 to 2035
  • Figure 26: North America Market Attractiveness Analysis by Product
  • Figure 27: North America Market Value Share and BPS Analysis by Application, 2025 and 2035
  • Figure 28: North America Market Y-o-Y Growth Comparison by Application, 2025 to 2035
  • Figure 29: North America Market Attractiveness Analysis by Application
  • Figure 30: North America Market Value Share and BPS Analysis by Sector, 2025 and 2035
  • Figure 31: North America Market Y-o-Y Growth Comparison by Sector, 2025 to 2035
  • Figure 32: North America Market Attractiveness Analysis by Sector
  • Figure 33: Latin America Market Value Share and BPS Analysis by Country, 2025 and 2035
  • Figure 34: Latin America Market Value Share and BPS Analysis by Product, 2025 and 2035
  • Figure 35: Latin America Market Y-o-Y Growth Comparison by Product, 2025 to 2035
  • Figure 36: Latin America Market Attractiveness Analysis by Product
  • Figure 37: Latin America Market Value Share and BPS Analysis by Application, 2025 and 2035
  • Figure 38: Latin America Market Y-o-Y Growth Comparison by Application, 2025 to 2035
  • Figure 39: Latin America Market Attractiveness Analysis by Application
  • Figure 40: Latin America Market Value Share and BPS Analysis by Sector, 2025 and 2035
  • Figure 41: Latin America Market Y-o-Y Growth Comparison by Sector, 2025 to 2035
  • Figure 42: Latin America Market Attractiveness Analysis by Sector
  • Figure 43: Western Europe Market Value Share and BPS Analysis by Country, 2025 and 2035
  • Figure 44: Western Europe Market Value Share and BPS Analysis by Product, 2025 and 2035
  • Figure 45: Western Europe Market Y-o-Y Growth Comparison by Product, 2025 to 2035
  • Figure 46: Western Europe Market Attractiveness Analysis by Product
  • Figure 47: Western Europe Market Value Share and BPS Analysis by Application, 2025 and 2035
  • Figure 48: Western Europe Market Y-o-Y Growth Comparison by Application, 2025 to 2035
  • Figure 49: Western Europe Market Attractiveness Analysis by Application
  • Figure 50: Western Europe Market Value Share and BPS Analysis by Sector, 2025 and 2035
  • Figure 51: Western Europe Market Y-o-Y Growth Comparison by Sector, 2025 to 2035
  • Figure 52: Western Europe Market Attractiveness Analysis by Sector
  • Figure 53: Eastern Europe Market Value Share and BPS Analysis by Country, 2025 and 2035
  • Figure 54: Eastern Europe Market Value Share and BPS Analysis by Product, 2025 and 2035
  • Figure 55: Eastern Europe Market Y-o-Y Growth Comparison by Product, 2025 to 2035
  • Figure 56: Eastern Europe Market Attractiveness Analysis by Product
  • Figure 57: Eastern Europe Market Value Share and BPS Analysis by Application, 2025 and 2035
  • Figure 58: Eastern Europe Market Y-o-Y Growth Comparison by Application, 2025 to 2035
  • Figure 59: Eastern Europe Market Attractiveness Analysis by Application
  • Figure 60: Eastern Europe Market Value Share and BPS Analysis by Sector, 2025 and 2035
  • Figure 61: Eastern Europe Market Y-o-Y Growth Comparison by Sector, 2025 to 2035
  • Figure 62: Eastern Europe Market Attractiveness Analysis by Sector
  • Figure 63: East Asia Market Value Share and BPS Analysis by Country, 2025 and 2035
  • Figure 64: East Asia Market Value Share and BPS Analysis by Product, 2025 and 2035
  • Figure 65: East Asia Market Y-o-Y Growth Comparison by Product, 2025 to 2035
  • Figure 66: East Asia Market Attractiveness Analysis by Product
  • Figure 67: East Asia Market Value Share and BPS Analysis by Application, 2025 and 2035
  • Figure 68: East Asia Market Y-o-Y Growth Comparison by Application, 2025 to 2035
  • Figure 69: East Asia Market Attractiveness Analysis by Application
  • Figure 70: East Asia Market Value Share and BPS Analysis by Sector, 2025 and 2035
  • Figure 71: East Asia Market Y-o-Y Growth Comparison by Sector, 2025 to 2035
  • Figure 72: East Asia Market Attractiveness Analysis by Sector
  • Figure 73: South Asia & Pacific Market Value Share and BPS Analysis by Country, 2025 and 2035
  • Figure 74: South Asia & Pacific Market Value Share and BPS Analysis by Product, 2025 and 2035
  • Figure 75: South Asia & Pacific Market Y-o-Y Growth Comparison by Product, 2025 to 2035
  • Figure 76: South Asia & Pacific Market Attractiveness Analysis by Product
  • Figure 77: South Asia & Pacific Market Value Share and BPS Analysis by Application, 2025 and 2035
  • Figure 78: South Asia & Pacific Market Y-o-Y Growth Comparison by Application, 2025 to 2035
  • Figure 79: South Asia & Pacific Market Attractiveness Analysis by Application
  • Figure 80: South Asia & Pacific Market Value Share and BPS Analysis by Sector, 2025 and 2035
  • Figure 81: South Asia & Pacific Market Y-o-Y Growth Comparison by Sector, 2025 to 2035
  • Figure 82: South Asia & Pacific Market Attractiveness Analysis by Sector
  • Figure 83: Middle East and Africa Market Value Share and BPS Analysis by Country, 2025 and 2035
  • Figure 84: Middle East and Africa Market Value Share and BPS Analysis by Product, 2025 and 2035
  • Figure 85: Middle East and Africa Market Y-o-Y Growth Comparison by Product, 2025 to 2035
  • Figure 86: Middle East and Africa Market Attractiveness Analysis by Product
  • Figure 87: Middle East and Africa Market Value Share and BPS Analysis by Application, 2025 and 2035
  • Figure 88: Middle East and Africa Market Y-o-Y Growth Comparison by Application, 2025 to 2035
  • Figure 89: Middle East and Africa Market Attractiveness Analysis by Application
  • Figure 90: Middle East and Africa Market Value Share and BPS Analysis by Sector, 2025 and 2035
  • Figure 91: Middle East and Africa Market Y-o-Y Growth Comparison by Sector, 2025 to 2035
  • Figure 92: Middle East and Africa Market Attractiveness Analysis by Sector
  • Figure 93: Global Market - Tier Structure Analysis
  • Figure 94: Global Market - Company Share Analysis

Frequently Asked Questions

What is the projected market size of the bioinformatics industry by 2035?

The market is projected to reach approximately USD 58.1 billion by 2035.

What is the estimated size of the bioinformatics market in 2025?

In 2025, the market is expected to be valued at around USD 18.7 billion.

Which product segment holds the largest share in 2025?

Bioinformatics platforms are expected to lead with a 37.4% share in 2025.

Which sector is expected to drive the market most significantly?

Medical biotechnology is projected to dominate with a 42.8% market share in 2025.

What is the projected CAGR for the bioinformatics market in India?

India is expected to grow at a CAGR of 11.8%.

Explore Healthcare IT Insights

Future Market Insights

Bioinformatics Market